Songadh, Uchchhal and Vyara villages in Surat district are notified as Eco-sensitive zone. Nearest Eco-sensitive Zone Vyara is also 42 km away from the SUDA boundary.
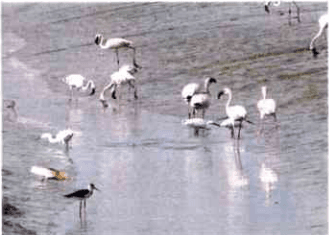
Gaviyar Lake, Karuna Sagar Ovara, Umra Ovara, Umbhel Talav, Ugat Botanical Garden & Lake, Causway at Rander, Lake at Tena village etc. are sites where local and migratory birds can find season wise. Black headed Gulls can found in more numbers at Causeway from December to February. Sarus crane and many other birds species can be found at lake near Tena Village. Huge number of lesser Flamingos visit Surat city in month of June - July, most of them are found at Umra & Karuna Sagar Ovara. Botanical Garden and Umbhel Lake also have good bird's life of local species. Ecological sites need conservation to preserve flora and fauna. Some of them like Ugat, Umbhel, Gaviyar site already conserve as ecological site.
Figure 59: Bird life of Surat City
Source: Hitesh Topiwala, Member of Nature Club, Surat
15.4Flora and Fauna of Suda Area
Many types of species of Flora and Fauna are used to be found within SUDA & SMC area, especially in such villages where Agricultural Land Use has covered more area comparatively. SUDA & SMC area has more number of lake/pond, two rivers the Tapi and Mindhola are passing through and Arabian Sea is adjacent to the SUDA area, where flora and fauna can found more in numbers. List of local and migratory flora, fauna, reptiles and butterflies are listed in Annexure. (Source: Nature Club, Surat)
C C C C C C C C C C C C C C C C C C C C C C C C C C C C C C C C C C C C C C C C C C C C C C C C C C C C C C C C C C C C C C C C C C C C C C C C C C C C C C C C C C C C C C C C C C C C
2017
15.5Impact of Urbanization on Environment
Due to the industrialization a sudden population explosion in form of migration has taken place in the urban areas. The pace of urbanization has been very fast due to which it has not been possible to maintain and serve the population with required standard of living. The rapid urbanization has also given rise to a lot of pollution generation within the environment. Pollution is the introduction of contaminants into an environment that causes instability, disorder, harm or discomfort to the physical systems or living organisms. Pollution can take the form of chemical substances or energy such as noise, heat, or light energy Pollutants, the elements of pollution. The major forms of pollution considered during study, includes air pollution, water pollution, noise pollution and visual pollution.
➢ Pollution Control Mechanisms
• Institutional Framework
The GPCB is the nodal agency that looks after the enforcement and implementation of environmental laws in the city. The environmental management of the city is looked after by several agencies. All these agencies are to act under the co-ordination of GPCB.
GPCB implements pollution control laws in the entire state and is guided by the Central Pollution Control Board. The SMC's role assumes significance as the provider and facilitator of any development in the city and SUDA area.
State Public Works Department is responsible for the maintenance of the major water bodies in the city. The State Highways Department and the National Highway Regulatory Authority are responsible for the maintenance of the highways in the city. The Regional Transport Office in Surat has responsibility to the Vehicular growth in the city and the Surat Traffic Police is responsible for the implementation of traffic management initiatives.
Local body has responsibility to implementation of MSW rules, 2000 and amended thereafter, along with plastic waste management and handling rules, 2011.
• Regulatory Framework
GPCB is empowered to take legal action and punishable measures against law offenders under the EP Act. The Board can also monitor the industrial discharge and terminate the operations if an industry is found flouting the norms.
15.6AIR
Air pollution is the human introduction of chemicals, particulate matter or biological materials into the air that cause harm or discomfort to humans or other living organisms, or damages the natural environment. Ambient air quality is being monitored by GPCB regularly at three locations in Surat. They are: Air India Building, SVR Engineering College and BRC Udhna (Industrial).
NOTE: Ambient Air Quality Standards (CPCB) for Rural and Residential areas are as under:
SURAT URBAN DEVELOPMENT AUTHORITY |
Page
PM₁₀ 100 µ g / NM3
SO₂ 80 µ g / NM3
NOx 80 µ g / NM3
Table 109Ambient air Monitoring statistics, 1996-97
Location of Monitoring Station
Parameters, 1996-97*
SPM
SO₂
NOx
Air-India Building, Kotsafil Road, Surat
355
62
21
S.V.R. Engg. College, Ichchhanath
170
40
15
B.R.C, Udhna
212
52
18
Table 110Ambient air Monitoring statistics, 2009-10
Location of Monitoring Station
Parameters 2009-10*
RSPM
SPM
SO2
NOx
Air-India Building, Kotsafil Road, Surat
85
171
17.80
26.53
S.V.R. Engg. College, Ichchhanath
77
156
15.70
24.36
B.R.C, Udhna
96
192
23.38
29.59
Table 111Ambient air Monitoring statistics, 2013-14
Location of Monitoring Station
Parameters 2013-14*
PM2.5
PM10 RSPM)
SO2
NOx
Air-India Building, Kotsafil Road, Surat
25.99
84.92
12.17
18.03
S.V.R. Engg. College, Ichchhanath
25.39
76.47
11.10
16.73
B.R.C, Udhna
29.91
102.08
15.31
19.78
Source: Annual report of GPCB
The NOx levels have always been below the CPCB prescribed standards. SO₂ levels, which were earlier above the prescribed limits have come down significantly and are now below the limits. Air quality has been monitored at 3 stations in Surat that indicate overall fall in SPM and RSPM.
Through the implementation of the Air Pollution Action Plan, it has been possible to bring down SPM (Suspended Particulate Matter) and RSPM (Respirable Suspended Particulate Matter) in the city of Surat significantly. In regard to SO₂ (Sulphur Dioxides) and NOx (Oxides of Nitrogen) which are the other relevant parameters in assessing the quality of air, in all stations, they remained within limits.
The Central Pollution Control Board (CPCB) in conjunction with IIT-Delhi recently surveyed 88 cities around the country in year 2009-10, as per survey Surat has been ranked 78th in the country and 6th in Gujarat state with respect to Air pollution with Air CEPI score of 46.00. While comparing it with
Page
- C C C C C C C C C C C C C C C C C C C C C C C C C C C C C C C C C C C C C C C C C C C C C C C C C C C C C C C C C C C C C C C C C C C C C C C C C C C C C C C C C C C C C C C C C C C
DEVELOPMENT PLAN 2035
2017
Ahmedabad with air CEPI score of 62.75 which ranked 2nd in country and 1st in Gujarat, it is very clear that Air pollution action plan has been implemented very effectively in Surat area.
Major milestones achieved in implementation of Surat Air Pollution Control Action Plan are as follows:
- SMC / BRTS have introduced 1851 passenger buses & 914 school buses on road. There are more than 28,726 rickshaws in Surat; out of which 95% are CNG auto rickshaws. (Source: RTO, Surat)
- Surat Municipal corporation has introduce mass public transport system such as BRTS and City bus service and also planning to start Metro rail project particularly for SUDA area on outer ring road
- Under Vehicle Inspection Program, many PUC Centers (as per revised system) are registered in Surat.
- Regarding industrial air pollution control, industries having major boilers are identified and in process of air pollution control measures in form of ESP [electro static precipitators], Bag Filters.
- The industrial units are categorized based on fuel consumption & performance of existing APCD (air pollution control devices).
- Many industrial units in pandesara and Sachin have switched over to Natural Gas or coal (instead of chindi waste) as fuel. Looking to the present situation and pace of urbanization, the urban air quality is expected to deteriorate faster in future. So, the long term strategies should be formulated and time bound targets should be set for achieving healthy and safe air environment.
- District level Air pollution control committee has been formed under the chairmanship of Surat District collector to implement the air pollution control plan and review it at every 3 months. The committee consists of officials from Surat RTO, GPCB, SUDA, SMC and members of Industrial associations.
Chapter 15Environment
15.1 Introduction
Today, Surat is one of the major industrial city, contributing major shares of output, especially in textile manufacturing, trade, diamond cutting and polishing industries, intricate Zari works, chemical industries and the gas-based industries at Hazira, established by leading industry houses, such as ONGC, Reliance, ESSAR, Shell etc. Surat is a pivotal centre on the Ahmedabad – Mumbai 'Golden Corridor' as well as on the 225 km long industrial belt having direct linkages with the industrial urban centres of Vaodara, Ankleshwar and Vapi.
In Surat Urban Agglomeration, SMC is the centre of economical activities and Surat city forms the core of SUDA. The total area of SUDA is 715 sq.km. including 326.5 sq.km. of SMC area. SMC along with SUDA are trying to cope up with the urbanizing land and decreasing gap between demand-supply of urban basic services, with a right kind of governing system, which is concerned about public participation, urban poor and their requirements along with the overall quality of Environment in the region. People are exposed to a whole variety of factors that can either promote good health or be hazardous to health, including the physical living environment. SMC along with SUDA has improved health via their material, service-provision, cultural, and aesthetic attributes. They also offer opportunities for cost-effective interventions that can serve many people even if carried out on a small scale. Existing health-promoting infrastructure (e.g., drains; Water distribution networks; Solid waste management, etc.) can, in some situations, be upgraded to meet the local health demands. Health hazards and inequities remain, however, and new threats have emerged, but the knowledge and technologies for creating a healthy city are available.
Urban environment can be divided into two parts: Natural urban environment and Built Urban Environment. The natural urban environments include water bodies, eco sensitive areas and natural resources. The term built environment refers to the human-made surroundings that provide the setting for human activity, ranging in scale from personal shelter and buildings to neighbourhoods and cities that can often include their supporting infrastructure, such as water supply or energy networks. This chapter reviews the existing natural resources like water bodies, eco sensitive areas and natural reserves in SUDA region.
15.2Water Bodies in the City
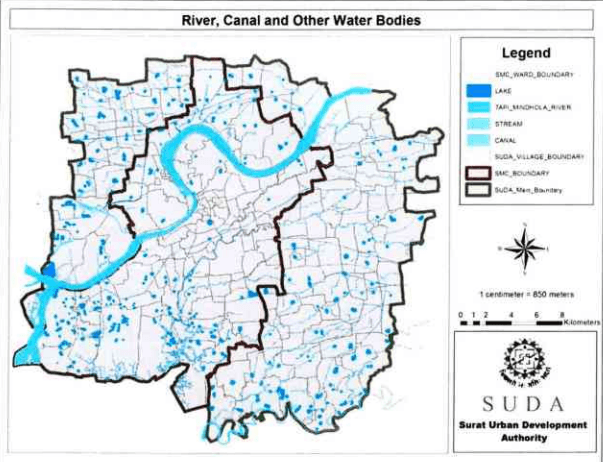
The Tapi River runs through the city of Surat, is one of the major rivers of peninsular India with a length of around 724 km. It is one of only three rivers in peninsular India that run from east to west. The river covers 3601 hectare of the total land under SUDA along with small portion of Mindhola estuary as well on southern part of SUDA area. SUDA region have about 898 no of small and large size lakes covering about 548ha of land area under lakes and pond.
SURAT URBAN DEVELOPMENT AUTHORITY |
| 150
Page
Table 108Details of Lakes in SUDA Region
Sr.No.
Authority
Name of Taluka / Zone
Total Number of Villages / Ward
Number of Ponds or Lake in The Taluka / Ward
Area of The Water Body Per Taluka / Ward (ha)
No. of Notified Lake / Pond
1
SUDA
Kamrej
17
53
26.020
2
Palsana
17
56
33.658
3
Olpad
17
117
71.444
4
Choryasi
44
373
238.647
5
SMC
North Zone
15
19
7.480
6
Central Zone
16
01
7.539
7
West Zone
22
39
24.098
8
East Zone
19
13
4.280
9
South West Zone
24
185
85.750
10
South Zone
15
42
48.639
11
South East Zone
14
00
0.0
Total
220
898
547.555
Source: SUDA Existing Land Use Map
|151
C C C C C C C C C C C C C C C C C C C C C C C C C C C C C C C C C C C C C C C C C C C C C C C C C C C C C C C C C C C C C C C C C C C C C C C C C C C C C C C C C C C C C C C C C C C C C
2017
Figure 57: River, lakes and water bodies in SUDA
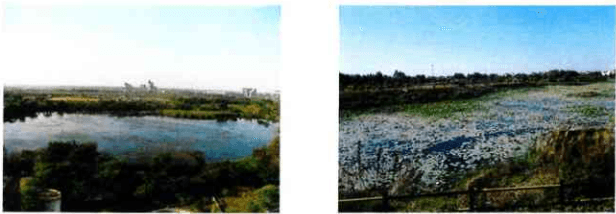
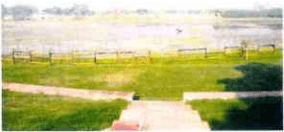
SUDA and SMC have developed walk way on river front and some of the lakes and Sea – shore for recreational purpose. Notable examples include Gaviyar Lake, Lake at Subhash Garden, Dummas Beach, Sultanabad – Dummas, Umbher lake, GopiTalav, Out of total, 13 lakes have been interlinked as on today for managing storm water during the monsoon.
Figure S8: Area Developed for recreational purpose
SURAT URBAN DEVELOPMENT AUTHORITY |
Page
|153
DEVELOPMENT PLAN 2035 | 2017
15.7Water
15.7.1 Source of Water
River Tapi is the perennial river flowing through Surat City. Tapi river is one of the major rivers in India. The total length of the Tapi river is approximately around 724 km. It flows in the central part of India. The river originates from the Betul district of Madhya Pradesh in the Satpura range at an elevation of 752 m above the sea level. The states through which the Tapi river flows include Maharashtra, Gujarat and Madhya Pradesh. Apart from the Narmada river, Tapi is the only river which flows in the westward direction and merges into the Arabian Sea. The Tapi basin extends to the total area of 65, 145 sq.km., which is approximately 2% of the total geographical area of India.
15.7.2 Source and Water Supply Management
River Tapi is the only source of Drinking Water for the citizens of Surat City. The entire water supply scheme executed till now and schemes which are being executed for the future generation is
keeping in mind the availability of quality water in river Tapti with adequate quantity. Presently, Urban Local Body (ULB)- SMC manages more than 950 MLD of to cater the water demand of Surat City. SMC has got riparian right of extracting water of 300 Cusec on daily basis from river Tapti. In order to manage water supply system based on river Tapti, SMC has constructed weir cum causeway near Rander. As a result, sweet water can be stored in the upstream of weir. Downstream of weir receives saline water from Arabian sea during high tide and in normal course too. Hence, because of weir cum causeway, intrusion till now and help managing water supply scheme for Surat City.
Table 112Water Quality of River Tapi as monitored by CPCB
Sr.No.
Location
Water Quality Parameter(Mean value of Year)
pH
Temp.(Deg.C)
Conductivity
NO₃-N⁺
D.O.(in ppm)
BOD(in ppm)
Fecal Coliform MPN/100 ml
Total Coliform MPN/100 ml
1
Ukai, Sherulla Bridge
7.7
27.5
352
0.10
7.0
1.5
2215
3170
2
Mandvi Bridge
8.0
27.7
359
0.22
7.8
1.9
677
1510
3
Upstream of Kathor
8.0
27.5
525
0.30
7.1
1.9
1058
2775
4
Near NH-8, Kathor Bridge
7.7
27.5
535
0.30
7.2
2.0
566
1908
5
Rander Bridge
7.9
27.0
659
0.27
7.0
1.9
1200
2150
6
ONGC Bridge
7.5
27.5
25418
0.20
4.4
4.9
2815
5850
Source: Basin-wise Complied Data – 2011, Central Pollution Control Board (CPCB), MoEF
Above data reveals that the quality of water gets deteriorated as it moves from upstream to downstream. ONGC bridge is the location where river receives saline water from Arabian sea. Also, in comparison to the classification of rivers of CPCB, river Tapi falls under 'C' class or below 'C' class river. Also, since quality of river Tapti is subject to the season variation, during monsoon season, when usually it received fresh water from upstream, it falls under 'B' class because of freshness of water and dilution of water.
15.8Noise
Noise pollution is displeasing human or machine created sound that disturbs the activity or balance of human and animal life. The unwanted sound is called noise. Loudness is measured in decibels
- C C C C C C C C C C C C C C C C C C C C C C C C C C C C C C C C C C C C C C C C C C C C C C C C C C C C C C C C C C C C C C C C C C C C C C C C C C C C C C C C C C C C C C C C C
2017
(dB). 20 db is whisper, 40 db the noise in a quiet office. 60 db is normal conversation, 80 db is the level at which sound becomes physically painful. Steady exposure to sounds higher than 80 dB can have negative long term effects on hearing. Redefining levels of noise pollution has become a crucial issue within densely populated urban areas.
Table 113Noise Level standard limits
Area Code
Category of Area/ Zone
Limits in dB(A) Leq*
Day Time
Night Time
A
Industrial area
75
70
B
Commercial area
65
55
C
Residential area
55
45
D
Silence Zone
50
40
Source: National Ambient Air Quality Standards (NAAQS)
Table 114Existing noise levels in Surat
Sr. No.
Category of Area/ Zone
Limits in dB(A) Leq*
Day Time
Night Time
1
Industrial area
70-80
65-72
2
Commercial area
63-69
60-64
3
Residential area
57-61
45-55
4
Silence Zone
45-50
40-45
Delhi is on the borderline with an average sound intensity of 80 dB. However, other metro cities have crossed this danger mark. Kolkata it is 87 dB, Mumbai 85 dB and Chennai 89 dB. Similarly in Surat city commercial areas reach up to 64-69 dB, and residential areas reach up to 57-61dB, which is higher than the limit suggested by GPCB. Vehicular noise is considered as the major contributor to noise pollution. That apart, uncontrolled use of loud speakers at social events also adds to the noise pollution. Broadly speaking, the noise pollution has two sources, i.e. industrial and non-industrial. Non-industrial source of noise includes the following categories: roads traffic, aircraft, railroads, construction, industry, noise in buildings, and consumer products. No honking zone has been identified for places like hospitals, educational institutions, religious places, etc.
15.9Visual Pollution
In modern times, especially in cities, the hazards of visual pollution are many. Though there is no accurate definition currently available, for our convenience we can define visual pollution as follows:
Visual pollution is any unwanted sight that mentally or physically affects the community or creates any health hazard.
Visual pollution generally refers to those elements of the landscape that the community finds unattractive, including badly maintained buildings, advertisements (hoardings), business signs, telephone and utility poles, weeds, garbage dumps and litter. Solid waste management is one of the core infrastructure facilities for the city. To make the city healthy and livable, sound solid waste management system is required.
SURAT URBAN DEVELOPMENT AUTHORITY |
|158
Page
Efforts to improve solid waste management in the city of Surat were made by the health department after the havoc of the plague in 1994. It is the only city of its kind in Gujarat where private contracting and private participation in solid waste management was introduced first. The city is divided into 7 administrative zones for efficient management and the waste generated is collected throughout the city by door to door collection system and disposed at the Khajod disposal site (200 ha).
Apart from Domestic waste, industrial waste generated is also a big challenge for Surat area as of date there are no industrial waste treatment and disposal site present in Surat area resulting utilization of Mindhola River by industries to discharge toxic waste in absence of proper disposal facility present in Surat Area. More than 1000 industrial units generating 1,13,058.5 MTA industrial wastes has been identified as per GPCB survey report, 2007.
15.10Solid Waste Collection and Disposal
SMC have good door to door solid waste collection system for entire city area and have dumping site at Khajod. SMC also cover few villages of SUDA area adjacent to SMC boundary. In other villages of SUDA area, it has been found during primary survey that door to door collection provided by Grampanchayat or through village's private association. Collected solid wastes are used to dump on either Gouchar land or waste used to burn on open field. In most of the villages, Grampanchayat give door to door collection to houses inside village gamtal as well as construction outside the Gamtal, where in few villages societies out of Gamatal used to collect solid waste by their own at the end of the street together and waste used to burn in open air. Taluka wise present scenario of solid waste collection and disposal has given bellow for SUDA area using primary survey data provided by Sarpanch or Talati of each village.
Table 115Solid Waste Collection and Disposal
Sr.No
Number of villages having Door-to-door Collection (Contractual basis)
Number of villages Disposing individually
Number of villages where waste is Disposed at Khajod
Number of villages where waste is Disposed into Gauchar
Number of villages where waste is Disposed into Creeks