Basic physical infrastructure facilities, services, and installations needed for the functioning of a community or society are roads, water supply, sewerage, storm water lines and solid waste management. Roads have been in the chapter on Traffic and Transport. Hence, this chapter focuses on all services except roads, identifying the issues arising for these services in fulfilling the growing demand. Due to the increase in urbanization at a fast pace in Surat, there exists significant pressure on the urban infrastructure.
The Specific indicators generated basically present the current situations/status of civic amenities in Surat Urban Area. The service level and coverage indicators have been used for estimating the gaps in services via set norms as prescribed by CPHEEO manual. Based on the norms, requirements by the year 2021, 2031 and 2035 have also been estimated. Further, future requirements have been converted into monetary terms, assuming appropriate unit costs.
11.2Water Supply
11.2.1 Water Supply Current Scenario
Water Supply is one of the primary infrastructure services a city needs. The sources of water supply for the entire SUDA region are surface water and ground water. Tapi is a major source of Surface Water. Surface water is drawn by intake wells from perennial channel throughout the year. Ground water is drawn via bores. The entire water supply process takes place through various steps and water is received through the source in the treatment plant where it is treated. The treated water is stored in the storage reservoirs and then supplied to the city areas. The following sections describe how the water supply system in the city has developed from past to present.
The situation with regard to water supply in Surat Municipal Corporation has been analyzed in terms of "Source Sustainability", apart from "Service Levels", "Service Coverage" and "Service Efficiency". These indicators are analyzed for assessing the existing service levels, coverage and efficiency.
11.2.1.1 Evolution of Water Supply
The water supply system for Surat city evolved over a period of more than hundred years.
Table 67Water Supply scenario before 1995
Year
Event
23 April 1852
Surat municipality was established but there was no provision of public water supply at that time
1864
Sir Kawasji Jahangir of Surat had donated Rs.1.25 Lacs to construct a water works for the city
Page | 97
Year
Event
1867
Mr. Gragery prepared a plan to draw water from river Tapi near Kamrej and bring the same up to Delhi Gate by a pipeline
1894
Fardunji Taraporewala was appointed as an Executive Engineer in Surat by the British Government, who planned to build Infiltration wells in the river. In the same year, work for first water supply pipeline was started near Surat railway station by Mr. George Harrison, then Governor of Mumbai
1898
Varachha Water Works was inaugurated. It was then known as Lely Water Works in the name of Mr.Lely, then Collector of Surat. Rander municipal area also got water from this plant as Sheth Haji Yusuf from Rander shared one tenth of the expenditure.
1931
chlorination was used in Surat city water supply for the first time
1950
New Engine House & new overhead tank were started
1952
First surface water treatment plant was commissioned at Varachha
1984
20 new tube wells were constructed at Varachha & Sarthana to increase the water supply capacity
1985
Radial collecting wells (2 No.) were constructed at Sarthana and water distribution stations were constructed at Khatodara, Umarwada & Katargam
1995
gross average daily water supply was 180 MLD to a population of about 18 Lacs resulting in an acute shortage of water supply
1995
A weir-cum-causeway was constructed across river Tapi. Due to the construction of weir, a reservoir of about 31000 TCM (Thousand Cubic Meter) capacity became available for drawing surface water.
Source: Water Supply Master Plan 2041, SMC
Table 68Water Supply scenario post 1995
Year
Event
1997
New water works for the city was commissioned at Katargam
1997
120 MLD capacity water treatment plant was commissioned and increased to total 240 MLD in 1999. Raw water at this water treatment plant was fed by the intake well constructed in the river Tapi.
2001
240 MLD capacity raw water Intake Well & 120 MLD capacity Water Treatment Plant were commissioned at Sarthana Water Works
2003
200 MLD capacity Water Treatment Plant & 360 MLD capacity raw water Intake Well were commissioned at Rander Water Works
2006
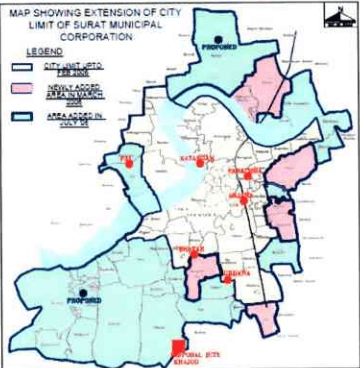
City limit was extended from 112.27 sq.km. to 326.51 sq.km. area, merging 27 Grampanchayats & 8 Nagarpalikas into city.
2007
200 MLD capacity fully automatic water treatment plant with SCADA was commissioned at Sarthana Water Works
2009
two fully automatic water treatment plants with SCADA of 150 MLD capacity each were commissioned and inaugurated by Honorable Chief Minister of Gujarat, Shri Narendrabhai Modi at Katargam & Sarthana Water Works
2011
50 MLD water treatment plant was commissioned at Rander water works under
2017
Year
Event
JnNURM
2012
Water Supply Scheme (part) for Amroli, Kosad, Chhaprabhatha area of New North Zone of Surat was commissioned and inaugurated by Honorable Chief Minister of Gujarat, Shri Narendrabhai Modi
2012
360 MLD Intake well at Sarthana water works and 263 MLD Intake well at Katargam water works commissioned
2013
90 MLD capacity fully automatic water treatment plant with SCADA was commissioned at Kosad Water Works
2013
3 Nos. of UGSR of total 245 Lacs Liters capacity with booster house for water supply scheme for Puna-Simada area of Surat under “Swarnim Jayanti Mukhya Mantri Shaheri Vikas Yojna”
Source: Water Supply Master Plan 2041, SMC
11.2.1.2 Current Service Level(year 2014)
Presently, there is an availability of 1463 MLD of surface water from different sources for SMC area against the total treatment capacity of 1268 MLD. Water from all these sources is taken to treatment plants supplying water to the SMC region. SMC has developed well established, networked water supply system to supply the drinking water to the Citizens of Surat City. Present gross average daily water supply to the citizens of Surat City is 980 MLD with net per capita water supply of 150 Liters per day. Present water supply components like water works, booster house and water distribution stations are connected with water supply GRID network which helps to address water quantity and quality issues. Present population coverage of Surat city (including the extended city limit area in year 2006) is about 93% and it is planned to achieve the target of 100% population coverage by the end of year 2014.
Table 69Water Supply available with SMC
No
Surface Water Source
Intake WellInstalled capacity (MLD)
Water Treatment Plant Installed capacity (MLD)
Percentage Treatment plant installed from intake
1
Sarthana Water Works
600
470
78.33
2
Varachha Water Works
0
68
3
Katargam Water Works
503
390
77.53
4
Rander Water Works
360
250
69.44
5
Kosad Water Works
0
90
Total
1463
1268
86.67
Source: Water Supply Master Plan 2041, SMC
Other than these, the villages in the SUDA area receive water through GWSSB from Tapi river and private bore wells. GWSSB supplies to only 14 villages about 1.6 MLD of water the rest of the villages are dependent on private bores and there are about 223 bores in these villages.
SURAT URBAN DEVELOPMENT AUTHORITY |
Page
Table 70Water supply to villages under SUDA Region Areas through GWSSB
No.
Village
Water Supply ( Litres)
1
Ambetha
139991
2
11.2.3Water Storage
In order to store the treated water, the SMC has built a number of reservoirs comprising of Elevated Service Reservoirs(ESRs) and Ground level Service Reservoirs(GSRs) having a total storage capacity of 747.10 ML of water.
Table 73Water Supply Process Details
Sr. No.
Water Supply Project
Year 2001
Year 2006-07
Year 2014
1
Intake Well (in MLD)
480
840
1463
2
Water Treatment Plants (in MLD)
428
628
1268
3
UGSR Capacity (in Lac lit)
3822
4450
7471
4
ESR Capacity (in Lac lit)
103
150
696
5
Pipeline (in km)
1850
2250
3030
Source: Water Supply Master Plan 2041, SMC
SURAT URBAN DEVELOPMENT AUTHORITY |
Page
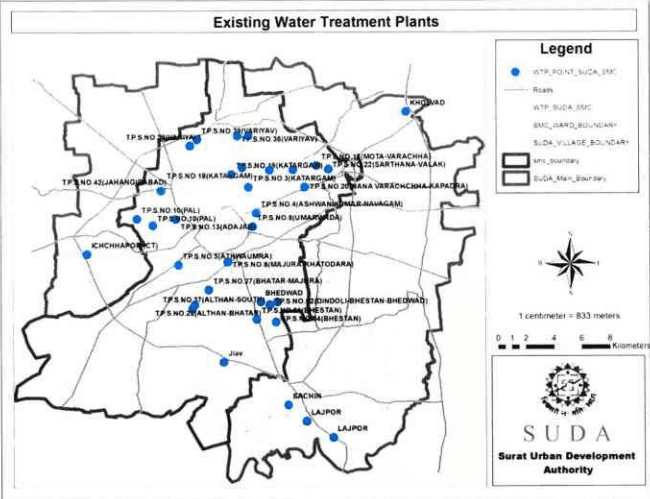
Figure 45: Existing Water Treatment Plant locations
Table 74Zone Wise ESRs and GSRs in SMC Area
Sr.No.
Zone
No. of Water Distribution Station
Capacity of Underground Water Tank (ML)
Capacity of Overhead Water Tank(ML)
Total Capacity(ML)
1
North zone
5
142.3
29.85
172.15
2
South zone
5
140.9
3.8
144.70
3
Central zone
1
19.2
0
19.20
4
West zone
4
104.9
2.8
107.70
5
East zone
6
155.3
6.0
161.30
6
South west
4
72.3
3.3
75.60
7
South East
3
42.6
23.85
66.45
Total
28
677.5
69.60
747.10
Source: Water Supply Master Plan 2041, SMC
In the areas within SMC and outside SMC but within SUDA jurisdiction the water is stored in ESRs and GSRs. The capacity details are as mentioned below.
SURAT URBAN DEVELOPMENT AUTHORITY |
Page
|102
2017
Table 75ESRs and GSRs in SUDA Area
Sr. No.
Name of Taluka
Total Number of Villages
Underground Tank
Overhead Tank
Number
Total Capacity (in Lakhs Litres)
Number
Total Capacity (in Lakhs Litres)
1
Kamrej
17
0
0
32
15.2
2
Palsana
17
2
4
36
17.3
3
Olpad
17
7
1.8
23
9.5
4
Choryasi
44
13
19.65
61
33.9
Total
95
22
25.45
152
75.9
Source: Primary Survey SUDA, March 2014
11.2.2Water Treatment Plant
In the entire of SUDA region, there are total five nos. of water treatment plants, operated by SMC in order to provide quality water to the urban developed and developing areas. Presently, the villages in SUDA area do not have any treatment plants. The five water treatment plants have a combined
SURAT URBAN DEVELOPMENT AUTHORITY I
page
C C C C C C C C C C C C C C C C C C C C C C C C C C C C C C C C C C C C C C C C C C C C C C C C C C C C C C C C C C C C C C C C C C C C C C C C C C C C C C C C C C C
2017
treatment capacity of 1268 MLD. Moreover 2 newly constructed water treatment plants of total 110 MLD capacity are yet to be commissioned and work for 90 MLD capacity water treatment plant is in progress.
Present installed capacity of Water Works is 1268 MLD, Present gross daily average water supply is 980 MLD via 28 water distribution centres.
Table 72Existing water treatment plants
Sr.No.
Surface Water Source
Water Treatment Plant
Current Utilisation (MLD)
Percentage Utilisation
1
Sarthana Water Works
470
355
75.53
2
Varachha Water Works
68
60
88.24
3
Katargam Water Works
390
350
89.74
4
Rander Water Works
250
200
80.00
5
Kosad Water Works
90
15
75.53
Total
1268
980
88.24
Source: Water Supply Master Plan 2041, SMC
Treatment Given to Water
• Pre-Chlorination
• Alum dosing/mixing
• Clari-flocculation by sludge blanket Lamella clarifiers / Conventional clarifiers
• Filtration by declining rate type rapid gravity sand filters
• Post Chlorination
11.2.4Existing Scenario for Water Supply & Demand
Water utilized by the metropolitan and mega cities provided with piped water supply where sewerage system exists (as per CPHEEO Manual) for domestic uses is 150 lpcd. Considering the unaccounted for water as 20%, as well as considering water demands by the commercial, institutional and civic amenities the per capita water supply provided is 180 lpcd.
Table 76Demand- Supply Analysis for water supply
Sr.No.
Service Head
Service Levels, Demand and Surplus/Deficit for Year 2011
Available(MLD)
SupplyMLD
DemandMLD
Deficit MLD
1
Daily Supply (SMC)
1463
980
1020
-40
2
Daily Supply via GWSSB(Urbanized area of SUDAexcl. SMC) Per capita
1.6
1.6
59.71
-58.11
3
Daily Supply (Urbanized areaof SUDA Incl. SMC)
1464.6
981.6
1079.71
-98.11
4
Treatment Capacity (SMC)
1268
980
1020
-40
5
Treatment Capacity(Urbanized area of SUDAexcl. SMC)
0
0
59.71
-59.71
6
Treatment Capacity(Urbanized area of SUDAIncl. SMC)
1268
980
1079.71
-99.71
Source: Water Supply Master Plan 2041, SMC & GWSSB, 2014
Taking into consideration the factors mentioned in the previous section for the water demand; it is worked out for the respective administrative areas in the SUDA region. The surplus/ deficit analysis is worked out in this section for each of these administrative areas.
SURAT URBAN DEVELOPMENT AUTHORITY |
Page
The water demand constantly increases with the rise in population. The table shows that water demand is 1020 MLD against the treated water supply of 980 MLD. There is a deficit of 40 MLD of water in SMC area at present. Moreover the water available at source is 1463 MLD out of which only 980 MLD is utilized, which signifies that there is an availability of spare water at source. Therefore 40 MLD of water is not exactly the gap. Also the existing water supply network does not cover some of the area merged into city in year 2006 as work for the same is currently in progress. In order to serve the entire SMC area, work for all new water supply schemes will be completed by year 2015.
Area under SUDA receives water through Tapi, borewells and the respective village Grampanchayats. Due to this reason, the exact water supply in this region cannot be measured. The water received through Tapi canal undergoes primary treatment; is received by the villages which is supplied by GWSSB. The above table shows that the water demand is higher than the water supply which signifies that there exist a gap for the water supply. Water treatment plants are not available in the major growth centres like Kamrej, Palsana, Olpad and Choryasi Taluka.
11.2.5Observations and Issues
11.2.5.1 Compulsory Rain Water Recharge
Due to high rainfall water should be compulsorily recharged. SMC has already started initiatives for rain water recharging activities long ago like - giving subsidy to citizens for installing rain water recharging in private premises, rain water recharging in SMC's own premises and plots, making it mandatory for private plots larger than 4000 sq.m. and high-rise buildings.
11.2.5.2 Inadequate Coverage
7% of the municipal corporation is yet to be provided with network for water supply. By 2015, 100% coverage in SMC area shall be done. Out of 95 only 25 villages are provided with GWSSB water remaining 70 villages do not have conventional water supply network.
11.2.5.3 Exploitation of ground water
Most of the villages in the SUDA area are reliant on ground water and bores for water supply. Apart from municipal bores a large number of private bores supply water in the various village areas. This leads to exploitation of ground water source.
11.2.5.4 System (Transmission and Distribution) Losses and Unaccounted for Water
The gross average supply in the city is 150 lpcd (Gross LPCD - Including @ 20% Losses). It is estimated that transmission and distribution losses account for 20 percent of the total supply. Scientific and systematic water audit is required to check these figures and also amount of water unaccounted for.
11.2.5.5 Inadequate Treatment Facility and Coverage outside SMC Area
Presently there is a lack of treatment plants in area outside SMC jurisdiction and within SUDA limits. There is an underprovision of water supply network in the part of the developing areas of Kamrej, Palsana, Vav , Navagam , Kholvad , Sachin, Talangpore, Vanz, Ichhapore , Bhatha, etc.
C C C C C C C C C C C C C C C C C C C C C C C C C C C C C C C C C C C C C C C C C C C C C C C C C C C C C C C C C C C C C C C C C C C C C C C C C C C C C C C C C C C C C C C
2017
11.2.5.6 Leakage and Contamination of Water at Household Connections
Although rehabilitation of old pipelines has been taken up in recent past, the problem of low pressure in water supply persists due to the existence of an aged network especially in central zone. Increasing population has also added to the already existing woes. Apart from these, the use of GI pipes for household connections leads to leakage and contamination of water in several areas of the corporation, further increasing the maintenance cost. A separate leak detection cell with latest leak detection equipments and sufficient trained staff will be required.
11.2.5.7 Alternate Source of Raw Water
- Since centuries, Surat city is substantially dependent on surface water of river Tapi for daily water supply.
- In the absence of any alternative source of water, city water supply may get hampered due to any unforeseen situation (like drought in consecutive years) in future.
- To create an alternate source of water, three options are being actively considered:
○ Constructing 2 new French wells – under construction stage at present.
○ Laying 58 Km. long pipeline from Kakrapar to Surat – Feasibility study report
○ Construction of Balloon Barrage - Feasibility study report
11.2.5.8 100% Water Metering
It is envisaged to implement 100% water metering on all consumer connections. At present all water connections above 15 mm size are metered. Majority of water connections in the city area before expansion in year 2006 are of 15 mm size, which are yet to be metered. In new area of city merged in year 2006, all connections including 15 mm size are metered.
11.3Storm Water Drain
11.3.1 Storm Water Scenario
Initially there was no established full-fledged storm water drainage system in Surat city, except in some area in piece-meal manner. However, there were old peripheral wall in the walled area of the city and the moats outside this peripheral wall, which carried storm water of the city.
11.3.1.1 Storm Water Scenario Prior to 2001
- City did not have a well established storm water drainage system in the walled city area.
- There were military walls in the wall town and moats outside the military walls carried storm water of the city.
- These moats are covered with pipes and box as and when required.
- Till 80's about 23.74 km of storm drain laid in the city on piece meal basis.
- City area gradually increased to 112.28 sq.km. from walled city area of 8.18 sq.km.
- Storm water master plan was prepared in 1985-86 to cop up the storm drainage requirement. Master plan was proposed to cover the water logged area of entire city.
- Priorities were decided on the basis of vulnerability and first phase of master plan was carried out with financial aid of World Bank.
- Initially, about 15.00 km of storm drainage was laid covering area inundated of Athwa, Varachha, Katargam & Rander.
- Up to end of the decade, total storm drain in city was 152.00 km.
SURAT URBAN DEVELOPMENT AUTHORITY
Page | 105
11.3.1.2 Storm Water Scenario: 2001-Till Date
Prior to Expansion of City Limit (2001-2006)
- Tune to the development of city, remaining storm water lines were laid as per the storm drainage master plan.
• Storm drainage of about 130.29 km were laid up to 2006.
• 32 Flood gates at different location were provided on storm drainage outlet in the city to prevent back water entry of Tapi during flooding condition of river.
• Up to end 2006 total storm drain in city was 321.54 km.
After Expansion of City Limit
- City limit expanded from 112.28 sq.km. to 326.12 sq.km. out of which 200.12 sq.km. are habitable.
- Strengthening storm drainage work by augmenting network in 112.28 sq.km. of old city area to the tune to the development. These will serve old areas of, West zone, North Zone, East Zone, South-East Zone, South Zone, South-West Zone and central zone with additional 200.16 km of storm drain.
- Out of new area, fast developing area of Vesu of Athwa Zone is covered with 43.82 km of storm drainage line.
- New area of East zone (Puna-Simada, Sarthana and magob (Part) is covered with 50.1 km of storm drainage line.
• 10 New Flood gates are constructed in Athwa zone, central zone and west zone.
11.3.2 Extent of Coverage
The map for storm water coverage demarcates the area having storm water network lines installed and signifies that the areas have completed coverage of system to the extent of 144 sq.km. areas, remaining areas will be covered on need basis. Till date strom drainage is laid as below.
Table 77Existinf storm drain network details in SMC area
Zone
Total Storm Drain Laid till date (km)
West Zone
119.85
North Zone
82.31
East Zone
105.67
South East Zone
71.20
South Zone
59.05
South West Zone
124.71
Central Zone
41.47
Total
604.26
Source: Storm Water Department 2014
SURAT URBAN DEVELOPMENT AUTHORITY |
Page
C C C C C C C C C C C C C C C C C C C C C C C C C C C C C C C C C C C C C C C C C C C C C C C C C C C C C C C C C C C C C C C C C C C C C C C C C C C C C C C C C C C C C C C C C C C
2017
The storm water network in SUDA area beyond the SMC limit is hardly available. There are about 16 villages in which network is laid for this storm water disposal. In all the other villages water runs off naturally into the creeks or river or natural water body near the village. The details are as below:
Table 78Existing storm drain details of SUDA area
Sr. No.
Name of Taluka
Total Number of Villages
Storm Water Drain
Number of Villages in which Network is Available
Number Of Villages in which Water Runs off Naturally
1
Kamrej
17
2
15
2
Palsana
17
1
16
3
Olpad
17
0
17
4
Choryasi
44
13
31
Total
95
16
79
16.84%
83.16%
Source: Primary Survey SUDA, March 2014
11.3.3 Mindhola River Rehabilitation Program
Currently about six different creeks are meeting into Mindhola river thereby disposing strom water of the city and outskirt into Mindhola. Untreated Sewerage water of new South-East, South and South-West area are also disposed into these creeks. Therefore project is envisaged to provide sewerage system in unsewered area and providing embankment with road on Mithi and Kankar creek as a first phase.
➢ Following benefits are envisaged.
- Gabion Pitching / Lining on sides of creek will help in prevention of direct disposal of sewage waste in to creek
• Provision of 6.00 m wide road on banks of creek will help removing encroachment on sides of creek, will in turn prevent garbage disposal in to the creek
- Lining on sides of creek smoothen the flow, thereby reduce vector borne diseases
- Protect the quality of creek water, other surface water and ground water against possible pollution due to unscientific discharge of raw sewage
- Improvement in aquatic eco system through maintaining adequate DO content of water bodies on downstream of the point of disposal
In second phase remaining creeks are also planned to be developed accordingly.
11.3.4 Observations and Issues
- Mixing of Sewage into Storm Drainage
• Storm water is discharged into river Tapi through 32 outlets in 5 administrative zone of the municipal corporation. Large quantum of sewage is let out through different
Page | 107
unauthorized connections into the storm water drains which ultimately disposed in to the Tapi river and untreated sewage disposed through storm drain that pollutes the river.
- As a part of "Tapi river Suddhikaran" SMC started project to identify unauthorized connection. In this project, site survey for all manholes of storm water will be carried out and unauthorized connection will be identified and detail report shall be prepared.
➢ Temporary Pumping of Storm Water
- High discharge in Tapi river from the upstream dam creates higher water level in in the river that goes beyond the invert level of existing storm drainage. this situation leads to closer of flood gate in order to avoid entering of river water into the city. During closing of flood, it creates worse scenario if rain occurs.
- To prevent water logging in this situation, temporary pumping arrangement are made every year with the available machineries with SMC.
- SMC has planned to provide Strom water pumping station at critical location.
Natural Waterways Need to be Preserved
- With urbanization natural waterways are blocked. With development of area, ground percolation of water reduces thereby increases surface water flow. Therefore at one side water in the creeks increases and carrying capacity reduces in existing creeks/ nallas.
11.4Sewerage System
SMC had recently augmented their existing water supply scheme. Increased water supply is expected to result in a corresponding increase in wastewater generation. For the purpose; SMC had a master plan prepared for the augmentation of the wastewater disposal system.
The augmented sewerage system under six drainage zones has also resulted in the increase of population coverage from 56 percent in 1996 to 91 percent in 2013. The numbers of sewage pumping stations have also been increased from 18 in 1996 to 42 in 2013 with addition of another 18 likely to start by end of 2015. Before the extension of city limit, the six drainage zones in the city were named based on the location of sewage treatment plant in their respective drainage zones; namely Anjana, Bhesan, Bhatar, Karanj, Singanpore and Bamroli.
After extension of city limit, with the increase of the city limits in each of the above drainage zones and with additional requirement of sewage treatment facilities in some zones; the drainage zones were named on the basis of zone, wherein the sewage treatment plant is located. These are South-East Zone, West zone, South-West East Zone, North Zone and the South Zone drainage schemes respectively.
11.4.1 Sewerage Generation
At present, Surat has sewage generation of 744 MLD. As per the CPHEEO norms, the sewage generation taking into consideration the water supply for computing the water demand is 180 lpcd
SURAT URBAN DEVELOPMENT AUTHORITY | Page | 108
2017
in the water supply section, the quantity of waste water (sewage) generation for the city is computed considering per capita water supply @ 180 lpcd and sewage generation at 80% of water supply.
11.4.2Extent of Coverage
With the increase in the SMC limits from 112.274 sq.km. to 326.52 sq.km; the coverage of sewerage has gone down from 92% to 47%. but at the same time 81% population is being served by underground sewerage system.
Table 79Sewerage System Indicators
Description
2014
Area of SMC (sq.km.)
326.515
SMC total population (Lakhs)
48.00
Actual population served (Lakhss)
43.68
Underground drainage (% population served)
91
Drainage network area ( sq.km.)
154.00
% of habitable area covered
75 %
Total length of drainage network (km.) (On TP roads)
1615
Sewerage pumping stations installed
42
Source: Drainage Department, SMC, 2014
11.4.3Sewerage Network
The sewerage network in Surat is presently served by six drainage schemes inclusive of the sewerage network in walled city area, namely, South-East Zone, West zone, South-West East Zone, North Zone and the South Zone drainage schemes. The schemes serve a total population of 43.5 lakhs (As per Census 2011) through 42 sewerage pumping stations and 10 treatment plants.
Table 80Existing Sewerage Network (2014)
Sr.No
Sewerage Zone
Location
Year of Comm.
Capacity (MLD)
Process
Design
Utilizing
Percentage Utilization
1
South-East
Anjana
1995
82.5
82
99.39
Conventional Activated Sludge
Dindoli
2013
66
25
37.88
Conventional Activated Sludge
2
West
Bhesan -
1995
100
65
65.00
Conventional Activated Sludge
Asharma
2009
15
8
53.33
Moving Bed Bio Reactor
3
South-West
Bhatar
2014
120
115
70.99
Conventional Activated Sludge + SBR
Page | 109
Khajod
2009
25
10
40.00
Moving Bed Bio Reactor
4
East
Karanj
1999
100
98
98.00
Conventional Activated Sludge
5
North
Singanpo re
2014
155
112
72.26
Conventional Activated Sludge+
Variav
11.4.6Green Energy Generation from Sewerage Gas: Best Practice
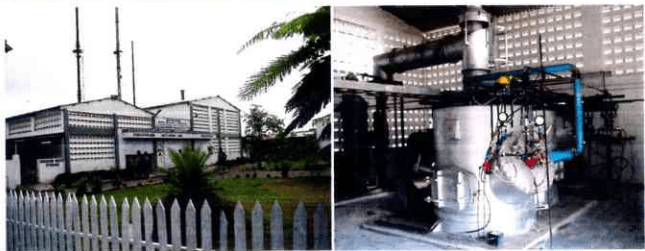
SMC was consuming the electrical power for Operation and maintenance of the Sewage Treatment Plants from the Power supplier, which was imposed an additional financial burden on SMC. As population has been increasing, the volume of sewage pumping and treatment is also increased which transitively increase the power requirement for sewage pumping and treatment as well. As an initiative towards Green Energy Generation from Sewerage; Sewage Gas Based Power Plant at Singanpore, Karanj, Bhatar, Anjana, has been setup. In very short duration of ten months, these projects have been commissioned in 2007-08 and are now operational and providing electricity to respective plant equipments. Following table indicates total kwh generation at different Sewage gas power plants. 0.6 MWe capacity Sewage gas based power plant at Variav, 0.75 MWe capacity Sewage gas based power plant at Dindoli and 0.5 MWe capacity Sewage gas based power plant at Bamroli will commissioned soon.
Table 84Power generation till Sep-2013 at various sewage gas based powerplant
Name
Installed Capacity of Power Plant
Year of Commissioning
Total Unit Generation up to September - 2013 in kwh
Total Energy Saving in Rs.
Anjana
0.5 MWe
Oct-09
16190092
71684203.89
Karanj
1.0 MWe
Mar-09
12499011
60618186.77
Bhatar
1.0 MWe
Aug-09
3956673
19100583.67
Singanpore
1.0 MWe
Mar-09
7338832
34761512.16
Variav
0.6 MWe
June -12
-
-
39984608
186164486.5
Source: Drainage Department, SMC, 2014
Followings are the technological reforms and benefits of Sewage gas based power plant.
- The Production of electricity through purely on sewage gas based engine generator technology have much more advantages and cost benefits over the earlier technology of duel fuel engine generator set;
11.4.5Sewage Treatment Facilities
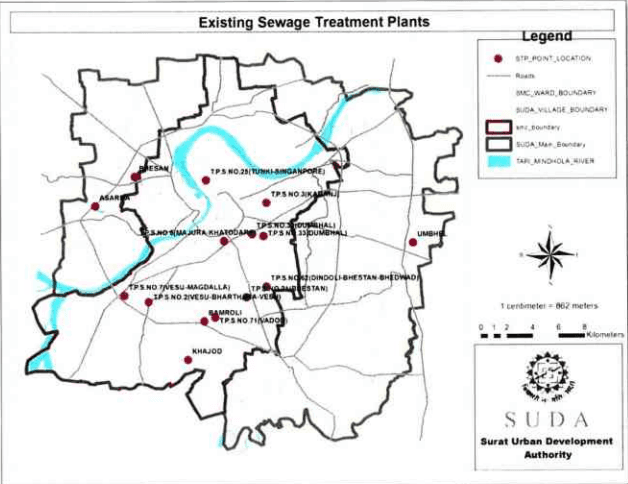
There are ten sewage treatment plants catering to the needs of all the six zones of the city and which have a total treatment capacity of 847.5 MLD of sewage. (One more sewerage treatment plant and augmentation of two STP are under construction stage.) The sewage collected by the drainage schemes is treated at the sewage treatment plants before being let out into river or Khadi. With the increased drainage network over the last three years and coming three years, the entire sewage generated in the city can be treated before disposal by the year 2016.
The total capacity of the ten treatment plants is 847.5 MLD. Ten treatment plants are located at Anjana, Bhesan, Asarma Bhatar, Khajod, Karanj, Dindoli, Bamroli-Vadod, Variav and Singanpore. (One more sewerage treatment plant at Gavier and augmentation of Karanj STP and Bhatar STP are under construction.) The operation and maintenance of all ten sewage treatment plants has been carried out by private agencies.
Treatment plant at Singanpore has been augmented from the Conventional Activated Sludge process facility to advance SBR technology. It has been augmented from 100 MLD capacities to 155 MLD capacities. Wherein treatment plant at Bhatar is being augmented from 120 MLD capacities to 162 MLD from Conventional Activated Sludge process facility to advance SBR technology. The treatment plant at Bamroli- Vadod is based on the Up flow Anaerobic Sludge Blanket process with extended aeration as polishing treatment and is one of the largest plants of its kind in the India. 40 MLD Tertiary Treatment Plant to treat secondary treated sewage and to generate Industrial Grade Water for supplying Industrial Grade water to pandasara industrial units is under commissioning stage. The sewage treatment plant at Asarma and Khajod are based on the Moving Bed Bio Reactor process and are first of its kind in India at Municipal Level. The sewage treatment plant at Variav is combination of UASB and Moving Bed Bio Reactor process. De-silting activity of manholes and drainage lines is privatized by SMC through contracts.
Table 83Zone Wise Drainage Pumping Stations
Drainage Zone
Sewage Pumping Station
Name
Capacity (MLD)
Total Zone wise
11.4.7CDM and Sewage Gas Based Power Generation by SMC
The sewage gas based power generation at STPs at Karanj, Singanpore and Bhatar are eligible for assistance under clean development mechanism for the following reasons. The STPs are designed to generate the sewage gas by treating the sludge generated from primary and secondary clarifier of sewage in an anaerobic processing system (Digester) so as to restrict the atmospheric emission of methane gas. At the same time, the methane gas is recovered without leak in the atmosphere
Confirming to the advantages as described in above case study, it can be concluded that the power generation through sewage gas should be adopted as an integral part of sewage treatment system.
11.5.2Waste Generation and Collection
There are 314 cradle type doorstep bins placed on roadside designated spaces. The total number of waste collection bins is 1170. These are mainly 4.5 cu.m in size with a capacity of 1.5 tonnes (4.5 cu. m)/ dustbin and cover the entire population of the city. The spacing between waste storage depots is about 100 m and there are about 5000 wheel barrows for carrying waste.
For door-to-door collection of waste 3000 bins are installed by private agencies. The cradle type would be designed in such a way that revenue generation through advertisement is possible. There are also initiatives for segregation of waste at source including awareness generation through pamphlets. At present there are 5603 sweepers engaged in the collection of waste across the seven zones of the city. Of the total waste collected, the corporation manages 96 percent while the rest is collected by rag pickers.
11.4.8Smc's Project of Tertiary Sewage Treatment Plant (TTP)
Pandesara is a notified industrial estate which was established by GIDC and falls within SMC limits. It is spread over an area of about 2.8 sq.km. There are about 400 industrial units operating in Pandesara estate, of which 119 units are water based industries comprising largely textile processing units and chemical industries. The size of the estate in terms of its turnover is approx Rs 4000 crores. Current water demand at Pandesara is estimated at approximately 90 – 100 MLD, comprising about 80 – 85 MLD of process water requirement and 10-15 MLD of potable quality water demand. Of the total demand, nearly 55 MLD is met through SMC potable water supply. The remaining demand is met through private sources including borewells and water tankers.
The Pandesara Industrial Estate is just 5 km away from the Sewage Treatment Plant at Bamroli (100 MLD capacity). Hence, SMC decided to set up a 40 MLD capacity Tertiary Treatment Plant to treat secondary treated water from Bamroli Sewage Treatment Plant to supply Industrial Grade Water to Pandesara Industrial Estate through SMC. This would enable SMC to reduce pressure on ground water resources in the city and free up potable water supplied to Pandesara Industrial area at present, which could be further used to supply the drinking water to the newly merged area in the city. This would also minimize the breakage of roads since, the transportation of water tanker would be turn down in the area.
11.4.8.1 Present Status of the Project
SMC has awarded work for 40 MLD capacity Tertiary Sewage Treatment Plant on EPC basis. To ensure income through sale of water as well as to conserve water resources, SMC intends to increase tertiary treated industrial grade water up to 80 MLD in future.
11.4.8.2 Technology Used
The tertiary sewage treatment process will be used at Bamroli treatment plant to achieve the desired treated effluent parameters.
Page
|116
2017
There are following types of tertiary treatments.
• Sand Filtration
• Ultra-filtration
• Membrane Filtration
• Reverse Osmosis (RO)
11.4.8.3 Major Benefits
- It reduces diversion of drinking water for non-potable purposes in the long term.
11.5Solid Waste Management
Efforts to improve solid waste management in the city of Surat were made by the health department after the havoc of the plague in 1994. The city is divided into 7 zones for efficient management and the waste generated is collected throughout the city and dumped at the Khajod disposal site (200 ha). At present in SUDA area, there is no scientific collection and disposal for solid waste available.
11.5.1 Solid Waste Management Current Scenario
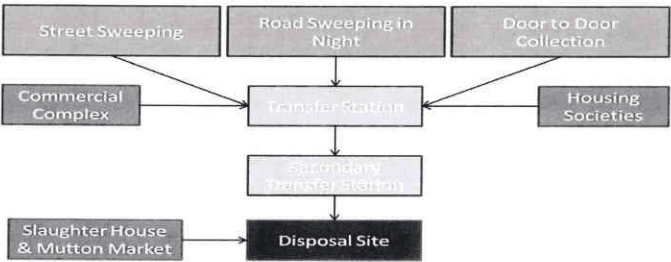
Figure 47: Process of Solid waste Collection to Final Disposal
SURAT URBAN DEVELOPMENT AUTHORITY | Page | 117
Solid waste management is one of the core infrastructure facilities for the city. To make the city healthy and liveable, sound solid waste management system is required.
11.4.10Future Requirements
SMC has prepared a master plan for comprehensive sewerage system (more than 1500 km of sewers and 10 sewage treatment works) to serve not only the domestic and commercial, but also the industrial developments for the year 2026. This shall be further projected for 2035. Wastewater generated from all this development is to be collected by a network of underground sewers and pumping stations and conveyed to sewage treatment works for physical and biological treatment to meet the parameters prescribed by the CPCB before discharge into the nearest watercourse.
11.4.10.1 Sewerage Network
Page
Phase wise execution of the master plan will cover not only the present population of the city but also the population expected by the year 2035. Complete area coverage is expected to be achieved by 2016. This is apart from the revitalization of the entire sewerage network in the central zone, where the present system is outdated. Complete revitalization of the system in the central zone is to be completed by 2020.
C C C C C C C C C C C C C C C C C C C C C C C C C C C C C C C C C C C C C C C C C C C C C C C C C C C C C C C C C C C C C C C C C C C C C C C C C C C C C C C C C C C C C C C C C C C C
2017
11.4.10.2 Sewerage Pumping Stations
With the newly proposed sewerage pumping stations in North, South, South-East and East Drainage Zone, the sewerage pumping stations will total to 60. These are expected to cater to the needs of the population of the city till 2035. Few of the existing sewage pumping stations i.e. Umra, Anjana, Salabatpura shall be rehabilitated.
11.4.10.3 Green Energy Generation
After successful implementation of the Green Energy generation projects at Singanpore, Karanj, Bhatar, Anjana; various organizations, municipal corporations, private agencies and industries at national & international levels have visited the Anjana Sewage Treatment Plant. Presently, several municipal corporations in India, have implemented / taken up implementation of such kind of project at their sites.
Following the successful experience, SMC now incorporates bio gas based power plant along with construction of sewage treatment plant itself. So generation of electricity can start as construction work completed and receiving of raw sewage starts at treatment plant. Installation of bio gas power plant has been completed with construction of treatment plant at Bamroli, Variav & Dindoli. The Work contract specifies the minimum electricity that should be generated from power plant based on incoming sewage quality and quantity; failing which the short fall in guaranteed generation will have to be borne by contractor.
Ariyana
87703
3
Jothan
94056
4
Sonsak
153177
5
Kukni
64345
6
Balkas
68947
7
Talad
94563
8
Kanad
73462
9
Vadod
58006
10
Sarol
34213
11
Ichhapore
321000
12
Pardi Kande
100000
13
Bhatha
206000
14
Bhatpor
135000
Source: GWSSB, 2014
Table 71Water Supply scenario in SUDA area
Sr. No.
Name Of Taluka
Total Number of Villages
Water Supply
Source Tapi - Supply By GWSSB
Number of Villages having Bores
Total Number of Bores
Number of Hand pumps Working
1
Kamrej
17
0
17
25
127
2
Palsana
17
0
17
45
110
3
Olpad
17
9
1
27
43
4
Choryasi
44
5
35
126
290
Total
95
14
81
223
570
Percentage villages
14.73
85.27
Source: Primary Survey SUDA, March 2014
However with the rapid development and rise in population, the city's demand on ground water resources is increasing tremendously. Although there is a huge potential of surface water resources, lack of piped supply network in all the developing urban areas creates significant pressure on existing ground water resources. As such, the village areas have to depend on the ground water, drawn from a number of bore wells located in different parts of the SUDA area.
2012
84
45
53.57
UASB + Moving Bed Bio Reactor
6
South
Bamroli
2002
100
65
65.00
UASB + Extended Aeration
Total
847.5
625
73.74 %
Source: Drainage Department, SMC, 2014
Figure 46: Existing Water Treatment Plant location
For the villages outside SMC area, partial sewage network is available. These networks dispose the water into nearby creeks and water bodies available. In 54 villages closed network is available. There are about 30 villages with no network at all and 10 villages with open or mix network available. The details are as below.
Page |110
2017
Table 81Sewerage Details Of SUDA Area
Sr.No.
Name of Taluka
Total Number of Villages
Disposal of Sewage
Number of Villages in which Network is Available
Mix or Open Network
No Network
1
Kamrej
17
10
2
5
2
Palsana
17
6
4
7
3
Olpad
17
9
4
4
4
Choryasi
44
29
0
14
Total
95
54
10
30
56.84%
10.53%
31.58%
Source: Primary Survey SUDA, March 2014
Rest of the SUDA area disposes the sewage through soak pits and septic tanks. The sewage system in these areas have no sewage network laid, therefore the disposal and treatment shows that a significant deficit exists in this area. In order to meet the increasing demand for sewage system, treatment plants as well as sewage network lines should be implemented. The details of soak pits and septic tank are as below.
Table 82Soakplt And Septic Tank Details of SUDA Area
Sr. No.
Name of Taluka
Total Number of Villages
Number of Soak Pits
Number of Septic Tanks
1
Kamrej
17
270
270
2
Palsana
17
11467
10967
3
Olpad
17
3990
3865
4
Choryasi
44
6564
5895
Total
95
22291
20997
Source: Primary Survey SUDA, March 2014
11.4.4 Sewage Pumping Stations
Out of total 42 sewage-pumping stations, 36 are main stations and the remaining six are auxiliary stations, which are of a lesser capacity and installed in an isolated manner. The diameters of the raising mains of the main stations vary between 600 mm to 1600 mm and those of the auxiliary stations vary from 250 – 500 mm. The depths of the stations vary from 9 to 15 m for main stations and 4 to 9 metres for auxiliary stations.
Page |111
- Power generation and utilization of it in sewage treatment plant reduce the electricity consumption of grid power;
(1) (2) (3)
C C C C C C C C C C C C C C C C C C C C C C C C C C C C C C C C C C C C C C C C C C C C C C C C C C C C C C C C C C C C C C C C C C C C C C C C C C C C C C C C C C C C C C C C C C C C C C C C C C C C C C C C C C C C C C C C C C C
2017
- Saving in electricity bill will reduce revenue expenditure of Sewage treatment plant, which reduces municipal taxes to the citizens;
- Reduction of emission of green house gases for the protection of environment.
West Zone (Rander)
1 Rander
30
149.78
2 Adajan
15
3 Pal
15
4 Bhesan Jahangirabad
32.78
5 Pisad
26
6 Pal-Palanpore
31
South West Zone (Athwa)
7 Nanpura
98
325.5
8 Athwa
21
9 Umra (N)
18.5
10 Umra (s)
19.5
SURAT URBAN DEVELOPMENT AUTHORITY
Page
2017
Drainage Zone
Sewage Pumping Station
Name
Capacity (MLD)
Total Zone wise
11 Althan
19
12 Piplod
9
13 Khatodara
50
14 Khatodara Old GIDC
18.5
15 Vesu Terminal
51
16 Vesu Intermediate (ONGC)
21
North Zone (Katargam)
17 Paras
52
427
18 Singanpore
62
19 Kantareshwar
69
20 Katargam New GIDC
2
21 Shantiniketan
1
22 Kosad
83
23 Kosad Railway
57
24 Chhaprabhatha
25
25 Utran
37
26 Mota Varachha
11
27 Mota Varachha GEB
28
East Zone (Varachha)
28 Karanj
93
153
29 Navagam
55
30 Modi Mohollo
3
31 Patel Nagar
2
South East Zone (Limbayat)
32 Sarthana
9
259
33 Magob
56
34 Parvat
4.5
35 Godadara
27
36 Dindoli
30
37 Salabatpura
65
38 Limbayat
41
39 New Anjana
12
40 Umarwada
14.5
Page
2017
Drainage Zone
Sewage Pumping Station
Name
Capacity (MLD)
Total Zone wise
South Zone (Udhana)
41 Bamroli
180
320
42 Pandesara GIDC
140
Total
1634.28
1634.28
Source: Drainage Department, SMC, 2014
Table 86
Waste Generation & Collection
1
Generation
a.
Tons Per Day
1680 MT
b.
Gms/ capita/ day
350 gm
2
Collection
a.
Corporation (TPD)
1494 MT
C C C C C C C C C C C C C C C C C C C C C C C C C C C C C C C C C C C C C C C C C C C C C C C C C C C C C C C C C C C C C C C C C C C C C C C C C C C C C C C C C C C C C C C C C C
2017
b.
Rag picker (TPD)
90 MT
Source: Solid Waste Department, SMC, 2014
In 2005 the solid waste generation per capita per day was 390 gm which has increased to 400 gm in 2007 and further decreased to 350 gm in 2014.
Table 87Waste Generation through Different Sources
Source
Percentage (2014)
Households
55-58
Shops and Establishments
6-7
Vegetable/Fruit/ Meet/Fish market
12-15
Construction and demolition material
6-8
Hotel/Restaurant waste
7-8
Source: Solid Waste Department, SMC, 2014
Waste is majorly generated at household constituting 55% of the total. At household level there is partly segregation of bio-degradable and recyclable waste.
Table 88Composition of Waste
Sr. No.
Type of waste
Percentage 2014
1
Combustible – Wood
20% to 21%
2
Recycle able
29% to 34%
A
Paper
8% to 9%
B
Plastic
9% to 10%
C
Metal
1% to 2%
D
Glass
2% to 3%
E
Brick Stone
9% to 10%
3
Food waste
15% to 17%
4
Vegetable
20% to 22%
5
Miscellaneous
8% to 9%
F
Cloth & Fabric
8% to 9%
G
Ash
20% to 22%
H
Ph
6 to 7
I
Moisture
55% to 60%
Source: Solid Waste Department, SMC, 2014
SURAT URBAN DEVELOPMENT AUTHORITY |
Page
11.5.2.1 Door-to-door Collection
Handling of door-to-door Refuse / Garbage System is entirely carried out by SMC through its own budget. Hence there is no involvement of any partner in respect of financial collaboration / aid. However, initial investment on the procurement of vehicle is being made by the contractors/agency.
While inviting tenders due care was taken to include the clause for propaganda of door-to-door garbage collection system. This was the responsibility of agency to which the work of door-to-door garbage collection is entrusted. As the agency is paid for the work executed on per MT basis; it is always implementing innovative ideas for improvement in present practice of door-to-door garbage collection System. As part of innovative activities agencies are conducting survey at regular intervals and make changes in TPM schedule for maximum coverage.
Before the implementation of door-to-door garbage collection system it was normal practice to throw house hold waste in the street, from where it is collected by sweepers in handcart for its disposal in nearby containers. This resulted in overall filthy and dirty appearance in the street as well as around the container spot. On implementation of door-to-door garbage collection system; it has now become the practice of every citizen to store the huge household waste generated temporarily in dustbin till the time door-to-door garbage collection vehicle is arrived. This has improved the overall scenario and surrounding environment. On request form shop keepers this system is made operative in second shift from 5 pm to 11 pm to facilitate commercial units.
The door-to-door waste collection in Surat is one of the best practices to strengthen the Municipal Solid Waste (MSW) collection system in the area of urban local body (As identified by 'Best Practices, Peer Experience and Reflective Learning- PEARL, NIUA, May 2009).
The main aspect addressed by this best practice is compliance to MSW Rules-2000. This system has developed the garbage collection activity at doorstep of household there for it made householder to habituate themselves to store their garbage in a bin till vehicles of door-to-door Collection System Reaches To Them.
11.5.2.2 Strategy Used / Activities Implemented to Achieve the Desired
Goals
- Selection of kind of vehicle based on width of road;
- Coverage of number of units in each route is between 1,000 and 3,000;
- Strengthening of the existing system of garbage collection;
- Creating public awareness on garbage management;
- Drivers and "Swachchhta Mitra" are provided with uniforms & identity cards;
- Concession period of this project is kept as Seven years keeping in mind the useful life of vehicle;
- All the garbage vehicles equipped with proper alarm system go to every door step regularly at scheduled time;
- Facility of second shift for collecting waste from commercial unit during 4.00 pm to 11.00 pm daily in each zone;
- First shift collection timing is 7.00 am to 1.00 pm daily for residential zone;
Page | 120
- C C C C C C C C C C C C C C C C C C C C C C C C C C C C C C C C C C C C C C C C C C C C C C C C C C C C C C C C C C C C C C C C C C C C C C C C C C C C C C C C C C C C C C C C
2017
• This system operates for 365 days in a year;
- Creating Public Awareness through campaign is the part of contractor's scope of work;
- Centralized complaint management system at Head office at Mugalsarai & Contractor's office with modern communication facilities;
• Provision for segregated waste collection (Dry & Wet).
Before arriving at the present practice of making payment to the contractor on weight basis various options like lump sum base to cover city as a whole, to cover zone as a whole and payment on number of units covered were thought. The present practice of making payment on weight base is found appropriate.
The system of Door to Door garbage collection involves the huge cost of capital investment in procurement of vehicles for collection of garbage. It also involves the manpower component to run the system effectively and efficiently.
As such Municipal Corporation is paying to agency for the garbage collected from doorsteps of residential and commercial units on weight basis; it has become viable for agency to run the system effectively.
The major component in Solid Waste is Earth – Organic which consists of 42% of the total waste. The recyclable waste which majorly consists of plastic and paper constitute to 20%. The waste coming from vegetable market which is bio-degradable constitute to 22%.
Table 89Existing fleet of Vehicles (2014)
Type of Transportation Vehicle
Number
Capacity(T)
Trips per Day
Dumper placer
71
1.0
08/Day/Vehicle
Mini Lorries/ Truck
19
07
1 to 2 / Day / Vehicle
Tractor Trailers
66
03
1 to 2 / Day / Vehicle
others, please specify (Tata 407 & Equivalent)
311
1.5 to 03
2.2/Day/Vehicle
Secondary Transportation
Tipper Trucks
35
13-15
3 to 4 per day per Vehicle
Table 90SWM indicators
Collection Performance (% Collected to Generated)
92.26%
Total vehicle capacity to total waste generated
137%
% of total waste treated through MSW treatment Plant
33%
Source: Solid Waste Department, SMC, 2014
Page
Table 91Zone wise Solid Waste Generation
Zone
Area (sq.km.)
Solid Waste Generation
2014
Generation per sq.km.
Central
8.97
122.2
13.62
North
34.35
230.4
6.71
East
35.42
356.7
10.07
West
52.62
279.2
5.31
South
53.12
410.2
7.72
South East
19.72
135.4
6.87
South West
117.48
146.4
1.25
Total
326.515
1680.5
5.15
Source: Solid Waste Department, SMC, 2014
The waste generation per sq.km. in central zone is highest due to high density whereas in south west zone the quantum of waste generated is very low.
Table 92Taluka wise Solid Waste Collection
Sr. No.
Name of Taluka
Total Number of Villages
Solid Waste Management Collection
Number of Villages Having Door-to- door Collection (Contractual Basis)
Number of Villages Disposing Individually
1
Kamrej
17
3
14
2
Palsana
17
6
11
3
Olpad
17
3
14
4
Choryasi
44
5
39
Total
95
17
78
Percentage of villages
17.89
76.84
Source: Primary Survey SUDA, March 2014
For SUDA area the solid waste management system is not in place. There are 17 villages where door to door collection for SWM is carried out on contractual basis. Remaining 73 villages there is no collection of waste. It is disposed individually by the people.
- It reduces dependence of Pandesara Industrial Units on bore-wells and private tanker operators.
- It facilitates recycling of wastewater, an environmentally sound and progressive practice.
- It protects the current revenues of SMC from sale of water for industrial purpose in the short term.
- It assures more stability in level of water supply to industrial units by providing supplementary source of water in addition to drinking water.
11.4.9 Emerging Issues
➢ Outdated sewerage system in the walled city area, Athwa and Umra
➢ Mixing of sewage with storm water and solid waste in several areas
➢ Low number of sewer connections
➢ Low per-capita cost recovery
➢ Unavailability of comprehensive wastewater system in Industrial Areas
This will reduce the power need of STP and revenue expense of the urban local bodies besides providing environmental benefits to the cities.
11.5.3Waste Transportation and Disposal
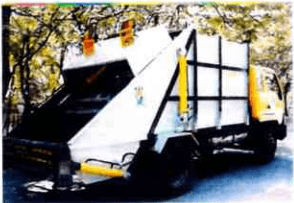
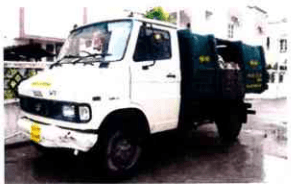
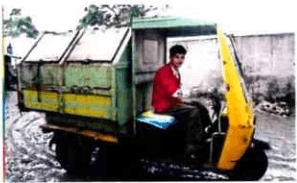
Waste collected from all over the city is transported to the processing and disposal sites by 450 labourers and 104 drivers. The fleet of vehicles available for the purpose includes dumper placers, trucks, tractors, market vans and heavy machines which are 162 in total. 41 labourers are involved in processing and disposing waste at the Khajod disposal sites.
SURAT URBAN DEVELOPMENT AUTHORITY | Page |122
2017
The transportation process is partly mechanized in the form of loaders, bulldozers and breakdown vehicles.
The private sector is partly involved in the transportation of waste in terms of manpower or a transportation of garbage and vehicles. They are mainly involved in transportation of municipal solid waste by dumper trucks and by containers through dumper placers.
11.5.3.1 Primary Transportations
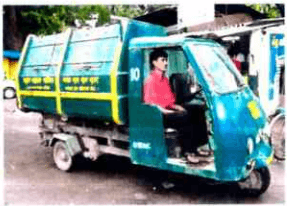
Primary transportation is related to the transportation of municipal solid waste from containers and door-to-door garbage collection to the nearby transfer station. Primary transportation of MSW from various areas to nearby transfer station is done by
• Wheel burrows/Trolleys/Mini tempos
- Three wheeler tempos/ four wheeler tempos/Compactors of door-to-door
• Hydraulic dumper placers/Tractor with trailers/ Dumper trucks
MSW collected through various means reach to the nearby transfer station. The six transfer stations are working in the city in different six zones.
Table 93SUDA area details of Solid Waste Disposal
Sr. No.
Name of Taluka
Total Number of Villages
Solid Waste Management Disposal
Number of Vilages where Waste is Disposed at Khajod
Number of Vilages where Waste is Disposed into Gauchar
Number of Vilages where Waste is Disposed into Creeks
Number of Vilages where Waste is Burnt
1
Kamrej
17
0
9
0
0
2
Palsana
17
0
3
4
1
3
Olpad
17
0
2
0
9
4
Choryasi
44
3
7
4
5
Total
3
21
8
15
Source: Primary Survey SUDA, March 2014
For SUDA area there are only 3 villages from where the waste is transported and disposed at the Khajod disposal. Most of the villages either dispose it into the gauchar land or into the creeks. About 15 villages are such where the waste is either burnt individually or is collected and disposed into the gauchar land and burnt.
Page
DEVELOPMENT PLAN 2035 2017
Figure 48: Transportation Facilities for Waste Collection
11.5.3.2 Transfer Station - Processing And Disposal of Waste
Processing and disposal methods like incineration etc. are not used in Surat. Land available for treatment and disposal of waste, where the land filling is carried out, is about 10 km from the city. The life expectancy of land for the treatment and disposal of waste is 30 years at the Khajod final disposal site. There is sanitary landfill cell created and the cell is ready for its use for disposal of inert material obtained at the end of treatment process of MSW Treatment.
One Bio-Medical Waste Treatment Plant is working on a BOOT basis from 2003. The agency to which the work is granted is responsible for collection and treatment of Bio-Medical Waste. There are total 41 UHC, which are collection centers and Rs. 10 per kg is collected as charge.
Figure 49: Existing Location Of Transfer-Stations
SURAT URBAN DEVELOPMENT AUTHORITY | Page | 124
2017
11.5.3.3 Bio-Medical Waste Treatment: Best Practice
Centralized bio-medical Waste Treatment facility for treatment of bio medical waste generated from all medical institutes like clinics, hospitals, nursing homes, clinical laboratories, health centres, R&D centres and other generators of bio medical waste in Surat city has been installed on BOOT basis. This practice has been awarded best practice award (As identified by 'Best Practices, Peer Experience and Reflective Learning- PEARL, NIUA, May 2009).
In the earlier days, when the impact of biomedical waste was not much recognized as infectious waste, deep burial method was under practice for the purpose of disposal. The only drawback with the system was likely reuse of medical kit without proper sterilization. This may lead to serious out spread of transmissible diseases. On realization of the impact of infectious diseases, Government of Gujarat framed one umbrella act in 1986 covering various activities that have detrimental effect on surrounding environment. In case of Biomedical waste management a Common Bio Medical Waste Treatment Facility (CBMWTF) is perhaps the only feasible solution for environment protection and effective legal compliance.
Most of the hospitals, clinics and other bio medical waste generators of the city have been registered under this scheme. List of the same and total waste collected have been given in the table below. Bio medical waste generated in all organization is collected and brought to Centralised Facility and provided treatment as per 'Biomedical Waste (Management & Handling) Rules, 1998.
Table 94Total Member & Waste Report Year-Wise
Year
Waste (kg)
No. of Registered Members
2008-2009
244109
3067
2009-2010
280725
3089
2010-2011
308798
3125
2011-2012
339678
3215
2012-2013
351003
3168
Source: Solid Waste Department, SMC, 2014
This is the project which is first ever in the history of SMC that has been executed on BOOT base. Here the agency to whom the work is entrusted is allotted only a piece of land measuring 2400 sq.m. at the token rent of Re. 1 per sq.mt per annum and remaining all the other expenditures related to renovation and construction of housing facilities for treatment machines such as Incinerator, Autoclave and Shredder and their purchase is made by agency. The concession period of BOOT Contract is seven years which is expired on 31st December 2009 and it has been already extended further on mutually agreeable conditions.
11.5.3.4 Outcome of the Best Practice
As a matter of fact this project is the best example of symbiotic relationship between Municipal Corporation, agency and generators of Bio-medical waste. Municipal Corporation is benefited by the way of transferring burden of BMW treatment on to the shoulders of agency .To make the plant's operation and maintenance economically viable every occupier of the facility generating BMW is suppose to make the payment to agency for the quantity of BMW being treated. To make it further more viable agency is paid for minimum of 200 kg per day of BMW irrespective of the actual quantity of BMW generated by SMC run hospitals / maternity homes, laboratories and urban health care centres.
11.5.3.5 Emerging Issues
The havoc of plague in Surat helped to convert the city into one of the cleanliest cities of the country. This was made possible through a complete revamping of the entire solid waste management system. The system is working efficiently and effectively at present, wherein private sector is involved.
Bhatar waste disposal site which was used so far; is to be closed. Instead of that Khajod site is being used for disposal of solid waste. Moreover, the location of the site right within the city limits has exposed the entire process to the open air and life threatening parasites. Northern/ eastern part of the city also requires land of around 100 Ha for as land fill site.
Surat Municipal Corporation has been efficient in collecting the solid waste from all over the city and maintaining cleanliness. The need of the day is maintenance of the system in an efficient manner. For this purpose, it is required that the collection and disposal system be upgraded. To cater to the needs of the population 2035, when 3800 MT approximately of solid waste is expected to be generated everyday in the city, additional containers, collection and transportation vehicles, waste storage and transfer stations, and infrastructure at the new waste disposal site at Khajod are the immediate requirements.
SURAT URBAN DEVELOPMENT AUTHORITY |
Page
|126
C C C C C C C C C C C C C C C C C C C C C C C C C C C C C C C C C C C C C C C C C C C C C C C C C C C C C C C C C C C C C C C C C
2017
Issues which can be identified associated to solid waste management; can be:
- Lack of effective technology for scientific disposal of solid,
- Segregation is not happening at source;
- Lack of public awareness;
- Lack of policy for use of bye-products generated from treatment of solid waste.
11.5.3.6 Strategies
Various strategies on policy and administrative levels need to be adopted for strengthening of Solid waste management in the city. Some of those can be:
- There should be planning for system strengthening, for example: up gradation of vehicles;
- All waste generated and collected has to be treated;
- Bhatar landfill site is to be closed (PPP initiative required)
- Separate collection and treatment system for plastic waste, organic waste, e waste etc are under planning stage.
- Separate Landfill site is required for disposal of dead animals. Three separate well developed land parcels need to be developed.
11.5.3.7 Future Requirements
Solid waste has increased and hence there is a need to plan for more compost plant, and workout techno economic feasibility for waste to energy systems. Also various models for reducing the waste need to be reviewed.
Page
Figure 50: Bio medical waste treatment plant run by Envision