Over a period of time, Surat has seen a rapid movement in increase of population with remarkably higher growth rates in past a few decades. The population has been rising with development activities and growth in health, educational and economic opportunities. This section discusses the population growth in past, demography and social aspects of the Surat Urban area under administration of SUDA.
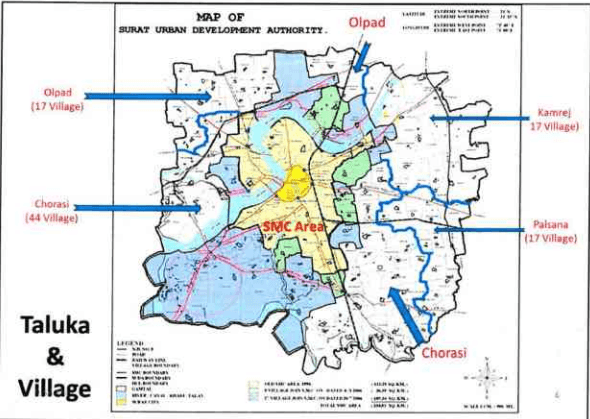
Figure 16: Taluka and Villages in SUDA
6.1 Population Growth Trends
The administrative boundaries of the SMC have been expanded time to time due to the need of accommodation of increasing number of citizens. However, SUDA has never so far had any spatial expansion of administrative limits since its establishment in year 1978 under The Gujarat Town Planning & Urban Development Act, 1976. Table 19 showing details of spatial extent of Surat urban spread over a period of time.
Page |37
- 2023年1月1日,公司收到的现金为人民币1,000万元。
2017
| Year | Area (sq.km.) | |||
| SMC | % | SUDA | % | |
| 1664 (Inner wall Area) | 1.80 | 100 | - | - |
| 1707 (Outer wall Area) | 7.40 | 100 | - | - |
| 1901 | 7.40 | 100 | - | - |
| 1941 | 7.40 | 100 | - | - |
| 1951 | 7.40 | 100 | - | - |
| 1961 | 8.18 | 100 | - | - |
| 1963 | 21.95 | 100 | - | - |
| 1971 | 33.90 | 100 | - | - |
| 1975 | 55.70 | 100 | - | - |
| 1978 | 55.70 | 7.17 | 722.00 | 92.83 |
| 1981 | 55.70 | 7.23 | 715.00 | 92.77 |
| 1986 | 110.00 | 13.33 | 715.00 | 86.67 |
| 1991 | 111.15 | 13.45 | 715.00 | 86.55 |
| 1994 | 112.28 | 13.57 | 715.00 | 86.43 |
| 2001 | 112.28 | 13.57 | 715.00 | 86.43 |
| 2006 | 326.515 | 31.35 | 715.00 | 68.65 |
| 2011 | 326.515 | 31.35 | 715.00 | 68.65 |
Source: City Development Plan, Surat (2006-2012)
Table 20 below states the population and density within SMC and SUDA areas respectively based on area of administration.
SURAT URBAN DEVELOPMENT AUTHORITY | Page |38
2017
| Year | SMC area | SUDA area (Except SMC) | SUDA area | ||||||
| Population | Density per sq.km | Growth Rate | Population | Density per sq.km | Growth Rate | Population | Density per sq.km | Growth Rate | |
| 1981 | 9,99,373 | 3,066 | -- | 1,20,993 | 306 | -- | 11,20,366 | 1,552 | |
| 1991 | 16,24,135 | 4,982 | 62.52% | 1,55,501 | 393 | 28.52% | 17,79,636 | 2,465 | 58.84% |
| 2001 | 28,68,603 | 8,799 | 76.62% | 2,36,521 | 597 | 52.10% | 31,05,124 | 4,301 | 74.48% |
| 2011 | 44,67,797 | 13,721 | 55.75% | 3,37,304 | 838 | 42.61% | 48,05,101 | 6,655 | 54.75% |
Source: SUDA, derived from Census 2011
Growth rate in both of the tables remarkably identify the difference of development pace accommodating citizens near their workplaces.
Interestingly, Table 20 shows the derived population growth and density for entire of Surat city (i.e. SMC and SUDA both combined). Here, with the effect of SUDA area population growth is visible and affecting the SMC population rise giving it moderate trend. Still, the decadal growth rate of the population in area is alarmingly above 54% which has reduced by around 20% from the previous decade.
Figure 17: Surat Population trends
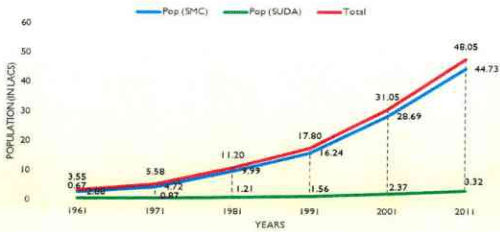
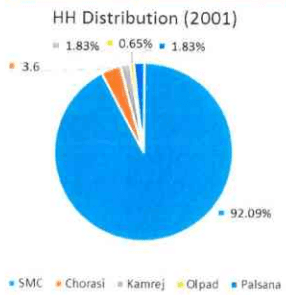
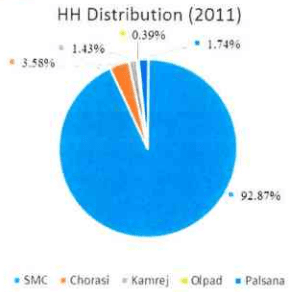
As clearly observed in the Figure 17, SMC population is increased at a very higher growth rate comparison with rest of SUDA. It indicates that SMC serves as a growth magnet which attracts the people for living. Composition of population in administrative area of SMC and four Taluka are shown in Table 21. The major contribution (almost above 90%) in total population is through Surat city whereas rest is distributed almost equally among four Taluka forming rest of SUDA.
Page
| Sr.No. | Area | Population & percentage share in total population | |||||||
| 1981 | 1991 | 2001 | 2011 | ||||||
| 1 | S M C | 9,99,973 | 89.20% | 16,24,135 | 91.26% | 28,68,603 | 92.38% | 44,67,797 | 93.10% |
| Total (SMC) | 9,99,373 | 89.20% | 16,24,135 | 91.26% | 28,68,603 | 92.38% | 44,67,797 | 93.10% | |
| 2 | Olpad Taluka | 16,173 | 1.44% | 17,799 | 1.00% | 20,632 | 0.66% | 19,657 | 0.40% |
| 3 | Chorasi Taluka | 54,030 | 4.82% | 68,078 | 3.83% | 1,06,974 | 3.45% | 1,69,053 | 3.51% |
| 4 | Palsana Taluka | 20,787 | 1.86% | 27,886 | 1.57% | 49,691 | 1.60% | 77,185 | 1.61% |
| 5 | Kamrej Taluka | 28,562 | 2.55% | 39,920 | 2.24% | 56,848 | 1.83% | 71,409 | 1.49% |
| Total (Rest of SUDA) | 1,20,993 | 10.80% | 1,55,501 | 8.74% | 2,36,521 | 7.62% | 3,37,304 | 7.00% | |
| Grand Total | 11,20,366 | 100.00% | 17,79,636 | 100.00% | 31,05,124 | 100.00% | 48,05,101 | 100.00% | |
Source: SUDA, derived from Census 2011
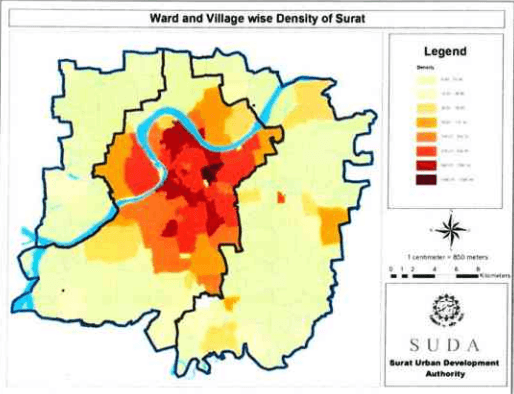
It is observed that Surat city with area of 326.52 sq.km. i.e. 45.22% of SUDA area comprises 93.10% of total population of the urban agglomeration. The trend has been similar over the past decades and subsequently there has been spatial expansions observed for Surat city limits to accommodate the newly populated peri-urban pockets. Detailed note on village-wise population in context to city as well as SUDA administration boundaries can be referred in Annexure.