5.1 Physiographical Conditions
The city of Surat is located on banks of Tapi river. The area within SUDA has a gradual slope towards the western and southern side of the city, having a natural drainage system towards Tapi River. The coastal area of south western side slopes towards Mindhola River. The city is divided in two parts by Tapi river. The development in the SUDA area has taken place on both the sides of the river. The coastal line at Hazira, Mora, Damka, Limla, Dumas, Bhimpore, Abhawa, Gavier, Sarsana and Vesu i.e. the land between the mouth of river Tapi and Mindhola is at low elevation.
The altitude of Surat is around 13 m above mean sea level.
5.2 Flood Prone Areas
Surat lies in the flood plain and also lies in an estuarial region. There are number of creeks in the south- western part of the city. The city has been historically susceptible to flooding. Development of Surat in the past has been affected a number to times due to the high flood in Tapi.
Flood risk exposure and vulnerability of the city has increased over the past few decades. Flood in the year 2006 covered almost the entire city and affected nearly two-third of the Surat city population. Since the altitude of Surat is less than 13 m above mean sea level, even with a sea level rise of one meter, the area under high tide zone particularly western parts of the city which are less than 10 m above mean sea level may be highly impacted. Now with the Ukai dam and the flood embankment scheme undertaken by the State Government, this area is safe from low intensity floods. The height of Nehru bridge is however one of the controlling point for further strengthening of flood embankment.
Ukai reservoir has been designed for a gross storage of 6.9 million acres feet at F.R.L. 345. During the floods, this can be raised to the high flood level of about 351 to hold the excess water of about one million acres foot. Any further rise in flood level could endanger the up-stream area by sub-merging them. The plan shows the provision of embankment scheme. According to this scheme the development of Rander-Adajan is still under the flood affected zone. The embankment scheme has to be further strengthened.
The walled city area has no good drainage system. There are few pockets of low lying area, where water gets logged in the rainy season. It is observed that the area of Navasari Bazar, Khapatia Chakla, Panini Bhit, Vada Chauhta area get flooded in rainy season. The other affected area is across the railway line towards the southern side of Kamrej which is also low lying area having the natural drain towards Khakra Khadi.
Page
Page |31
2017
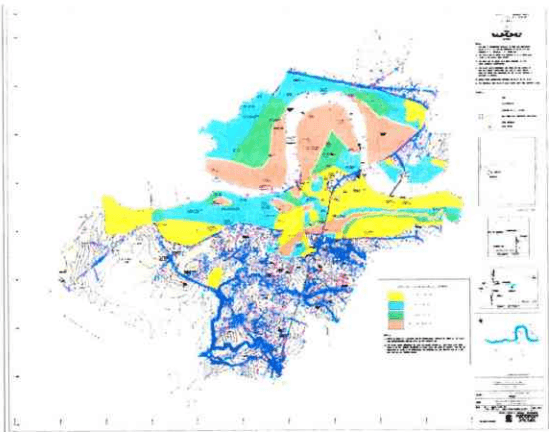
The flood prone area in the figure no. 12 shows the flood affected area in the SUDA.
Figure 12: Flood Map of SMC Area
5.3 Wind Directions
Surat is experiencing predominant wind direction from south-west to north-east, the breeze is mostly from the sea towards the main city.
5.4 Climate
Surat has a tropical savannah climate, moderated strongly by the Sea to the Gulf of Cambay with a summer dry season. There are three distinct climatic seasons in this region. March to June is the summer season. May and June are the hottest months. The highest recorded maximum temperature is 45.6 °C in the months of May and June. The summers are extremely hot and dry. Scorching heat and hot winds are typical characteristics of it. It is very uncomfortable to move around in the daytime.
Late June to early October is the rainy season. It is generally breezy during these months. The scenic quality of the place is greatly enhanced with the onset of monsoon. Most of the areas remain pleasant and comfortable throughout the day. October and November see the retreat of the monsoon.
November to February is the winter season. The month of January is the coldest with average minimum temperature of 14.3°C. The lowest recorded temperature of 4.4 °C is in the month of January. Weather remains pleasant most of the day.
The month wise mean sea temperature is as shown in the Table 14 below:
-
2017
| Jan | Feb | Mar | Apr | May | Jun | Jul | Aug | Sep | Oct | Nov | Dec |
|---|---|---|---|---|---|---|---|---|---|---|---|
| 25°C | 25°C | 25°C | 27°C | 29°C | 29°C | 29°C | 28°C | 28°C | 29°C | 28°C | 26°C |
| Climate Data for Surat, Gujarat | |||||||||||||
| Month | Jan | Feb | Mar | Apr | May | Jun | Jul | Aug | Sep | Oct | Nov | Dec | Year |
| Record high °C | 38.3 | 41.7 | 44.0 | 45.6 | 45.6 | 45.6 | 38.9 | 37.2 | 41.1 | 41.4 | 39.4 | 38.9 | 45.6 |
| Average high °C | 30.3 | 31.7 | 35.4 | 37.2 | 36.4 | 33.9 | 30.7 | 30.5 | 31.7 | 34.4 | 33.3 | ||
5.5 Rainfall
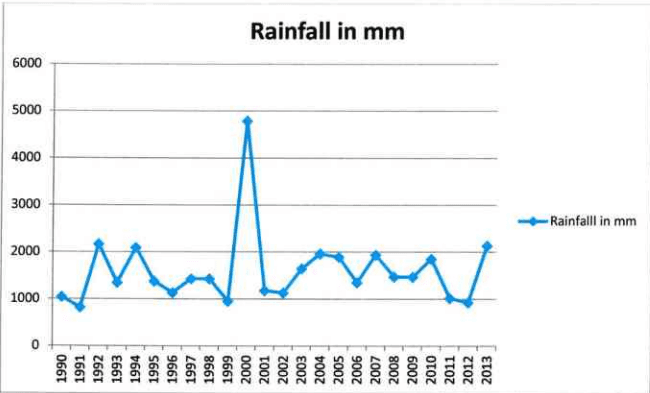
The southwest monsoon in Surat normally occur in the duration of month of June to month of September. Normal rainfall is about 1400 – 1700 mm.
| Rainfall | Normal RF(mm) | Normal Rainy days | Normal Onset | Normal Cessation |
|---|---|---|---|---|
| SW monsoon(June-Sep) | 1400 - 1700 | 45-56 | 3rdweek of June | 4th week of September |
Page
The yearly rainfall details of Surat are shown in the table below. The highlighted cells are the years when river Tapi was flooded.
| Sr. No. | Year | Seasonal total Rainfall in Inch/ Dokda | Seasonal total Rainfall (m) | Seasonal total Rainfall (m) |
|---|---|---|---|---|
| 1 | 1990 | 42.32 | 1044.09 | 1.04 |
| 2 | 1991 | 32.48 | 825.01 | 0.83 |
| 3 | 1992 | 85.4 | 2169.02 | 2.17 |
| 4 | 1993 | 52.43 | 1346.1 | 1.35 |
| 5 | 1994 | 82.5 | 2095.5 | 2.1 |
| 6 | 1995 | 54.28 | 1379.4 | 1.38 |
| 7 | 1996 | 44.67 | 1134.8 | 1.13 |
| 8 | 1997 | 40.6 | 1431.04 | 1.43 |
| 9 | 1998 | 56.39 | 1432.6 | 1.43 |
| 10 | 1999 | 37.56 | 954.2 | 0.95 |
| 11 | 2000 | 30.92 | 4785.8 | 4.79 |
| 12 | 2001 | 46.5 | 1180.5 | 1.18 |
| 13 | 2002 | 44.57 | 1129.8 | 1.13 |
| 14 | 2003 | 66 | 1647 | 1.65 |
| 15 | 2004 | 77.31 | 1962.02 | 1.96 |
| 16 | 2005 | 74.46 |
5.6 Geology
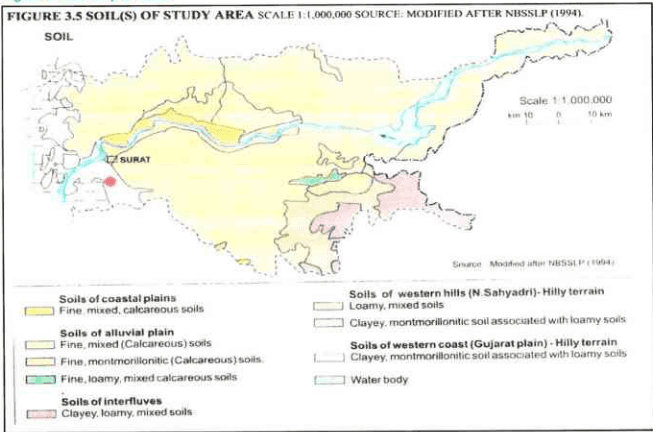
Surat mainly falls under coastal plains. It has fine mixed and calcareous soils. Some part of SUDA also falls under alluvial plains. Thus Surat mainly consists of fine mixed and montmorillonitic type of soil.
Figure 14: Soil Map of SUDA
5.7 Hydrology
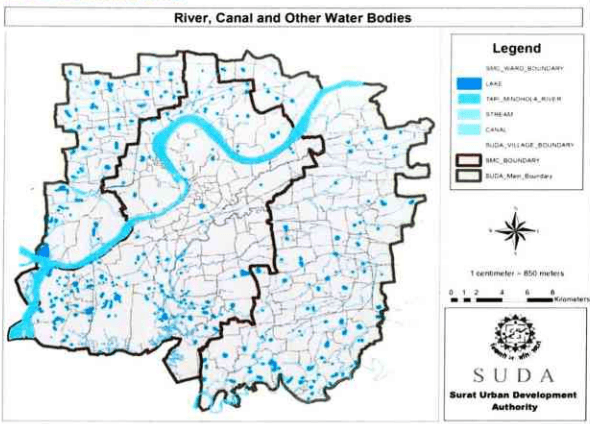
The Tapi River runs through the city of Surat, is one of the major rivers of peninsular India with a length of around 715 km. It is one of only three rivers in peninsular India that run from east to west. The river covers 3601 ha of the total land under SUDA along with small portion of Mindhola estuary as well on southern part of SUDA area. SUDA region have about 898 no. of small and large size lakes covering about 548 ha of land area under lakes and pond.
SUDA and SMC have developed walk way on river front and some of the lakes and Sea – shore for recreational purpose. Notable examples include Gaviyar Lake, Lake at Subhash Garden, Dummas Beach, Sultanabad – Dummas, Umbher lake, Gopi Talav; Out of total, 13 lakes have been interlinked as of today for managing storm water during the monsoon.
C C C C C C C C C C C C C C C C C C C C C C C C C C C C C C C C C C C C C C C C C C C C C C C C C C C C C C C C C C C C C C C C C C C C C C C C C C C C C C C C C C C C
2017
Figure 15: Waterbodies in Surat
| Sr. No. | Authority | Name of Taluka / Zone | Total Number of Villages / Ward | Number of Ponds or Lake in The Taluka / Ward | Area of The Water Body per Taluka / Ward (ha) |
| 1 | SUDA | Kamrej | 17 | 53 | 26.020 |
| 2 | Palsana | 17 | 56 | 33.658 | |
| 3 | Olpad | 17 | 117 | 71.444 | |
| 4 | Choryasi | 44 | 373 | 238.647 | |
| 5 | SMC | North Zone | 15 | 19 | 7.480 |
| 6 | Central Zone | 16 | 01 | 7.539 | |
| 7 | West Zone | 22 | 39 | 24.098 | |
| 8 | East Zone | 19 | 13 | 4.280 | |
| 9 | South West Zone | 24 | 185 | 85.750 | |
| 10 | South Zone | 15 | 42 | 48.639 | |
| 11 | South East Zone | 14 | 00 |