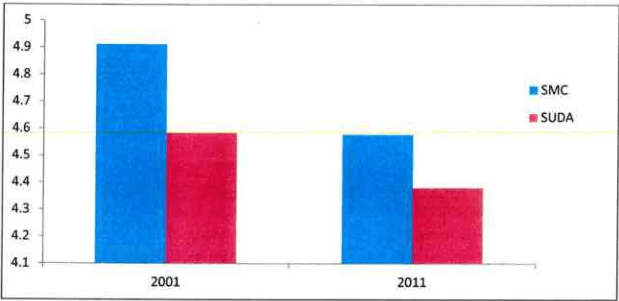
The current housing scenario for the city can be worked out through the average household projections for each of the administrative areas and the population of the city. The figure shows the past trend of Household Size by Administrative Areas for the years 2001 and 2011.
Figure 36: HH Size for Administrative Areas
Source: Census of India, Projection
The table below gives the details about the population, number of households and the household size for the administrative areas for the years 2001 and 2011.
Page
Table 54Population, Number of Households and Household Size of Administrative areas for the years 2001 and 2011
Sr.No.
Administrative Area
Population
No. of HHs
HH size
2001
2011
2001
2011
2001
2011
1
SMC
2876374
4467797
585532
975578
4.9
4.6
2
SUDA
239840
337304
52321
77593
4.6
4.4
TOTAL
3116214
4805101
637853
1053171
4.9
4.6
Source: Census of India 2001 and 2011
The table below summarizes the housing requirement for SMC and SUDA regions. The total housing requirement for the year 2035 for entire SUDA region is 23.75 Lakhs.
Table 55Housing Requirement Projections
Sr.No.
Administrative Area
Population
Housing Requirement
2021
2031
2035
2021
2031
2035
1
SMC
69,36,534
89,46,606
97,50,634
15,14,975
19,53,985
21,29,589
2
SUDA
5,27,961
6,80,954
7,42,151
1,20,494
1,55,411
1,69,378
TOTAL
74,64,495
96,27,560
1,04,92,786
16,35,469
21,09,396
22,98,967
Source: Census of India and Projection
The residential development in the city which is approx 55% of the total urbanized area. The growth in the city is taking place in the Southern and North-eastern direction with major development of planned and unplanned colonies. Area under residential use has increased drastically, from 2695.6 hectares in 1978 to 10,666 hectares in 2014, indicating the extent of the urban sprawl. The percentage distribution of residential area is 58.54% in 2014, which is on a slightly higher side then prescribed standards, which range from 40% to 45%. There are 399 slum pockets of SMC. Mainly these slum pockets are near the medium industry in South and South-East side of the city.
Chapter 9
9.1 Introduction
House is the most basic need of human being after food and clothing that needs to be addressed on priority. It not only provides shelter to a household but also fulfils all basic utilities and needs of each member of the family. Therefore provision of housing for the entire population in the city is essential. In Surat demand for MIG and HIG housing exists besides LIG and EWS housing. Since Surat is becoming the most important industrial hub of the country, the need for LIG and EWS housing for industrial labour is of greater concern in and around industrial areas. This chapter examines the present housing status, housing need, housing issues and related strategies. The chapter then reviews various housing policies that are likely to impact the housing stock in the city in future and provide basic housing to the entire population in the city.
9.4Housing Need
The housing sector needs to be catered for meeting the existing backlog as well as to meet the future demands of the expansion happening in the city. The present deficiency of housing is computed as below, assuming household size of 4.5 for the entire city, based on the census 2011 population data and future housing projections. The table below shows the total shortfall in number of houses required for the population as per zones in the Surat city.
Table 57Housing Shortfall existing in the year Census-2011
Year- 2011
Zone
Population
Total Houses
Average
Shortfall
Central
4,08,760
77,666
5.3
13,170
South West
3,47,447
71,119
4.9
6,091
South
6,95,028
1,65,162
4.2
-10,711
South East
7,48,304
1,52,624
4.9
13,666
East
11,37,138
2,33,164
4.9
19,533
North
7,05,163
1,40,743
5.0
15,960
West
4,24,986
91,695
4.6
2,746
TOTAL
44,67,797
9,32,173
4.8
60,455
Source: Census of India 2011
Page |76
The deficiency in the census year 2011 is based on the optimum household size (4.5 persons per Dwelling Units) thus is 60,455 households (Dwelling Units). The average household size is 4.8 persons per household which is higher than the prescribed Household size (4.5 persons per Dwelling Units) for the city.
The table below shows the total shortfall in the number of housing units for the total population in Surat city in coming years:
Table S8Showing total Housing Shortfall in the projected year
Year
1991
2001
2011
2021
2031
2035
Population
14,99,560
28,76,374
44,67,797
66,33,000
90,23,000
1,10,33,000
Total No. Of houses
6,81,750
7,52,441
13,86,245
21,53,571
29,29,545
35,82,143
Total Houses - Residential Use
4,36,744
4,77,508
9,32,173
14,63,878
19,04,205
23,28,393
Total Vacant Houses
99,267
1,17,236
2,09,506
3,39,619
4,41,775
5,40,187
Housing Requirement
3,33,236
6,39,194
9,92,628
14,74,000
20,05,111
24,51,778
Surplus
1,03,508
Shortfall
1,61,686
60,455
10,122
1,00,906
1,23,385
Source: Derived from Census Information by SUDA
As per deficiency and surplus calculations, housing surplus is being only in the year 1991 and as the city expands in later decades the housing need increases with respect to population, therefore the backlog in the last census year 2011 is 60,455 houses for the population of 44,67,797 and for the year 2035 the housing requirement is 24,51,778 houses for 1,10,33,000 population. With the increase in population the housing need is also increasing for the population projected till 2035.
9.5 Housing Growth
Each zone has maximum number of properties which are residential which together comprises 58.5% of Residential use breakup for land use in the city.
East zone contains maximum number of residential properties. Also as mentioned above central zone is the core of employment activities, therefore the breakup of others type of properties are maximum in this zone. The residential development needs to be spread towards South and East zone, along with focus on education centres development in the city.
9.3Housing Stock
As per census 2011, the Surat city population of 44.66 lakhs, with total number of 13,86,245 of census houses. There are 67.24% of houses which are used for wholly residential use and 15.11% of houses are lying vacant in the city. Below table shows decade growth for central zone. The maximum population density (49,971 person per sq.km.) is in Central zone in mere 8.18 sq.km. area. As discussed above the central zone provided maximum employment opportunities and formation of squatter settlements, which are the root cause of its densification.
Page | 75
C C C C C C C C C C C C C C C C C C C C C C C C C C C C C C C C C C C C C C C C C C C C C C C C C C C C C C C C C C C C C C C C C
2017
The South-east Zone is highly inhabited with population of 7,48,304 (16.75% of total population). In respect to the population and area the East zone consists maximum numbers of Houses with 74.47% of it are optimally used for specifically residential purposes only. The table below is showing the total Housing Stock present in the city in the census year 2011.
Table 56Housing Stock as per Census of India
Sr.No.
Zone
Area(sq.km.)
Population
Density per sq.km.
Decade Growth 2001-2011 (%)
Total No. of Census Houses
Wholly Residential
Vacant Houses
Census 2001
Census 2011
1
Central
8.18
413641
408760
49971
-1.18
153638
77666
21171
2
South West
111.912
242466
347447
3105
43.30
114734
71119
25996
3
South
61.764
407980
695028
11253
70.36
251079
165162
48001
4
South East
19.492
397257
748304
38390
88.37
221643
152624
26773
5
East
37.525
711516
1137138
30303
59.82
313105
233164
27853
6
North
36.363
416370
705163
19392
69.36
201978
140743
34940
7
West
51.279
287144
424986
8288
48.00
130068
91695
24772
TOTAL
326.52
2876374
4467797
13680
55.29
1386245
932173
209506
Source: Census of India 2001 and 2011
9.6Housing Supply and Demand
The rise of Information Technology and Information Technology Enabled Services sector has changed the profile of the city and therefore city is emerging as a favourable investment destination. The city's infrastructure is improving steadily and it has recently seen the completion of a large number of road projects such as elevated roads and flyovers. Leading property developers of the country are implementing
SURAT URBAN DEVELOPMENT AUTHORITY | Page | 77
-
2017
residential and commercial projects in the city. Being the cleanest city of India and its accessibility from neighbouring cities such as Mumbai, Vadodara and Ahmadabad, Surat is catching attention of developers and investors.
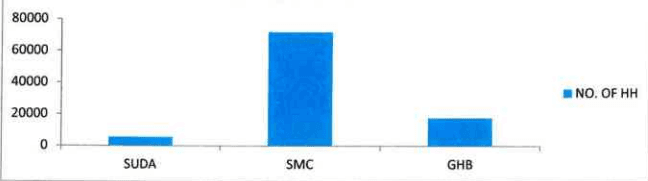
The supply is being segregated into two sectors, Public and private. The major part of Housing Supply is from Private Sector which incorporates around 91.25 % of total housing supply in the city in the year 2014. The public sector supply is contributed by SUDA, SMC and Gujarat Housing Board.
Figure 37: Contribution of public sector in supply of Housing
Housing Supply by Public Sector
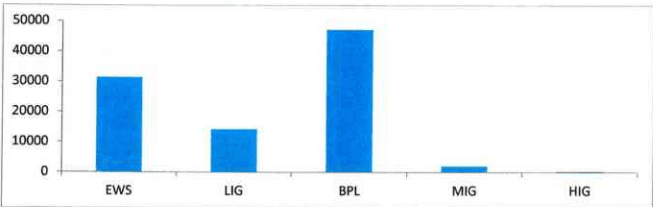
Figure 38: Housing under various category
Source: SMC, SUDA and GHB
Table 59Contribution of public sector in supply of Housing in the Surat City
Sr. No.
Administrative Authority
Up to 2001
2001 to 2012
2013 to Till Date
Total
No. Of Units
No. Of Units
No. Of Units (Under Construction Project)
1
SUDA
EWS
483
1028
1511
LIG
2472
2472
Page |78
Sr. No.
Administrative Authority
Up to 2001
2001 to 2012
2013 to Till Date
Total
No. Of Units
No. Of Units
No. Of Units (Under Construction Project)
Mukhyamantri Gruh Yojana (MGY)
LIG
611
1725
EWS
1114
TOTAL
5708
2
SMC
JnNURM (BSUP)
46856
46856
VAMBAY
372
372
EWS
6243
7424
13667
LIG
113
113
Mukhyamantri Gruh Yojana (MGY)
LIG
2296
11023
EWS
8727
TOTAL
72031
3
GHB
SIHS
738
738
EWS
1641
1641
LIG
7196
7196
MIG
2103
2103
HIG
387
387
OTHER
2781
2781
Mukhyamantri Gruh Yojana (MGY)
LIG
1633
2949
EWS
1316
TOTAL
21572
58265
15697
17795
GRAND TOTAL
95534
95534
Source: SMC, SUDA and GHB
Table indicates that from the public sector, SMC has been doing maximum work for poor people of the Surat city since last so many years. Up till now total 72,031 housing units have been constructed by SMC. After that GHB has performed major role by providing houses to the urban poor and the contribution is 17,795 houses. SUDA has also been proactive in construction of the houses for urban poor in the city since last few years. As on total 95,534 houses have been worked out by public sector in the Surat city which is approximately 8-9% of total Housing supply. The Private sector
Page
C C C C C C C C C C C C C C C C C C C C C C C C C C C C C C C C C C C C C C C C C C C C C C C C C C C C C C C C C C C C C C C C C C C C C C C C C C C C C C C C C C C C C C C C C C
2017
supply is mainly targeted for the Middle Income Group (MIG) and Higher Income Group only; and hence the Lower Income Groups are often neglected.
The demand from Lower income Group for the required housing is on higher side, whereas options for them available in the market are at lower side but post slow down, in year 2014, Real estate developers in Gujarat are eyeing the affordable housing market. Rising demand from lower middle-class population, easy availability of housing loans and low interest rates have made the developers turn to building low-cost 1BHK and 2BHK flats in the range of Rs 4 to Rs 10 lakhs. Earlier, the builders focused more on catering to the demand of the higher-income groups by building luxurious apartments, bungalows and duplexes.
And as the maximum real estate projects are coming from private sector it can be understood, that the share of Housing Supply in Surat City is majorly dominated by Private sector than Public Sector. The supply by Public Sector is mainly for EWS, LIG and underprivileged sections of society, but supply by private sectors are concentrating on all sections and also introducing the concept of Affordable housing for the lower income group.
9.7Urban Poor
Slums are the agglomeration of unhygienic shelters arranged in congested manner without appropriate integral facilities like drinking water, roads, street lights and drainage being provided. Thus, conceptually slums are compact overcrowded residential areas (and not isolated or scattered dwellings) unfit for habitation due to lack of one or more of the basic infrastructure like drinking water, sanitation, electricity, sewerage, streets etc. These squatters are actually like blot on the urban panorama and also create unhygienic and dismal squalid environment and act as the source of spreading diseases in the city.
Slums have become an integral part of growing cities. The increase in industrial activities results in mass migration from other districts and neighbouring states. Due to the lack of resources and poor affordability coupled with inadequate availability of affordable housing, the migrants starts squatting on available public spaces creating in the process slum settlements with minimal available infrastructure. Rapid urbanization has led to rapid growth of slums in the cities.
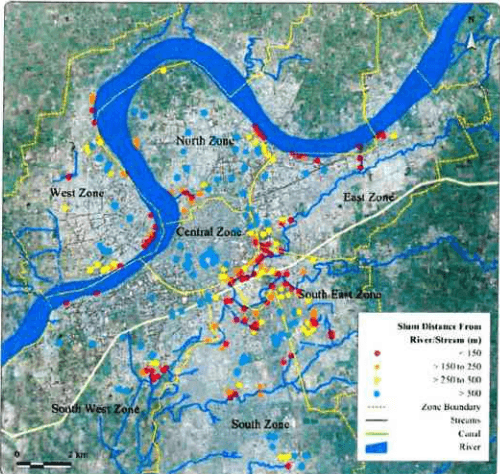
Table below indicates Industrial locations in the Surat City where the Slums have developed nearby industries within SUDA and SMC boundary limit.
Table 60Location of Industries where Slum pockets developed
Sr. No.
SUDA
SMC
1
Bharthana Kosad
Katargam
2
Gothan
Navagam
3
Lashkana
Tunki
4
Navagam
Umarwada
Page | 80
Page
(一)
DEVELOPMENT PLAN 2035
2017
5
Vareli
Magob
6
Vankaneda
Dumbhal
7
Vanz
Anjana
8
Lajpore
Gandhikutir
9
Sachin
Bhatar
10
Bhatia
Althan
11
Gaviar
Udhna
12
Vanta
Bhewad
13
Kavas
Pandesara
14
Bhatpor
Bhestan
15
Ichhapor
Unn
16
Bharthana Kosad
Vadod
17
Kadodra
Bamroli
Source: Development Plan (SUDA)
2017
Figure 39: Slum Locations near industries in Surat (2013-14)
Source: Slum up gradation department, SMC
Table 61Slum Household Size for SMC areas
Sr.No.
Zones
Population
Detail of Slum (census-2001)
Detail of Slum (census-2011)
Census 2001
Census 2011
Slum HH
Slum Population
HH size
Census Vacant houses
Slum HH
Slum Population
HH size
Census Vacant houses
1
Central
413641
408760
9189
43775
4.8
28717
9889
49323
5.0
21171
2
South West
199668
347447
8961
31568
3.5
17926
7502
33982
4.5
25996
3
South
320087
695028
58213
75067
3.8
17323
17887
76025
4.3
48001
4
South East
334561
748304
-
148169
12822
30051
147050
4.9
26773
5
East
581138
1137138
19364
73998
3.8
16599
21334
90992
4.3
27853
Page |82
6
North
334260
705163
9603
43697
4.6
8614
13541
58293
4.3
34940
7
West
250480
424986
11333
50450
4.5
15235
5665
25993
4.6
24772
Total
2433835
4466826
116663
466724
4.15
117236
105869
481658
4.54
209506
Source: Census of India and Projections by SUDA
As per survey conducted in 2013-14 under Rajiv Awas Yojana (RAY) around 399 Slums were identified. Of these 399 slums settlements, a majority of slums 144 were located along the Major Roads or the River, almost 75 Slums were located in the Khadi region or along the Railway other slums are located in the Gardens or in other places around the city.
Amongst the residents of the Slums the composition of the slums is as 42.37% of the slum population is SC, 27.77% of the Slum population is ST, 18.24% of Slums is Baxi- panch and 10.31% of population contains of the general population as per 2001.
Results of the analysis from the primary survey conducted in 2013-14 under RAY by SMC, an average household size of 4.54 was indicated in Surat slums. The average household sizes in the slums are higher than that of the city average.
It is observed that the encroachment on private land is being decreased in recent years by SMC efforts of relocation and re-shifting of slums on Public Land. Therefore out of total land occupied by Slums, 30% is on Private land in 2013-14.
Table 62Land Area covered by Slum Pockets in the Surat City