The city experienced an increase in the density of population despite an increase in area between 1971 and 1981. However, in 1991, the population density declined due to a proportionally larger increase in the area compared to the population. In 1971, the city, with a population of 4,71,656 was spread over an area of 33.90 sq. km. resulting in a population density of 139 PPH.
Page
-
2017
Table 22Population density in SMC and SUDA areas
Year
SMC area (latest area)
SUDA area (Excluding SMC)
SUDA area (with SMC)
Population
Density per sq.km.
Population
Density per sq.km.
Population
Density per sq.km.
1981
10,13,188
3103.03
1,23,793
323.96
11,36,981
1604.45
1991
16,34,605
5006.21
1,60,749
420.67
17,95,354
2533.51
2001
28,76,374
8809.31
2,41,314
631.50
31,17,688
4399.52
2011
44,67,797
13683.28
3,37,304
859.21
48,05,101
6768.04
Source: SUDA, derived from Census of India
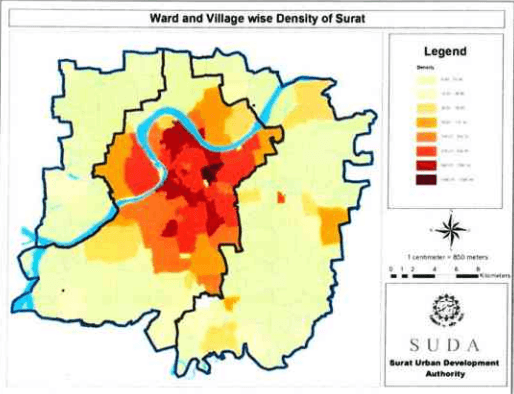
Table 22 shows the data of the population density as recorded in last four census decades. In 2006, city limits witnessed spatial expansion reaching 326.52 sq.km. and with population density of about 137 PPH. The density in SUDA area is comparatively very low which gives rise to opportunity for development. The highest density of population in Municipal Area is observed in Walled city area. In particular in certain localities like Gopipura, Wadifalia, etc. the density of population is stated to be around 1000 persons per hectare. New areas brought in under the jurisdiction of SMC in 1986 are by and large sparsely populated, though along the two prominent corridors, viz. Nana Varachha Road and Udhna (Navsari) road, the population density is moderately high.
Figure 18: Density of Surat in 2011
Chapter 6Social and Demographic Profile
Over a period of time, Surat has seen a rapid movement in increase of population with remarkably higher growth rates in past a few decades. The population has been rising with development activities and growth in health, educational and economic opportunities. This section discusses the population growth in past, demography and social aspects of the Surat Urban area under administration of SUDA.
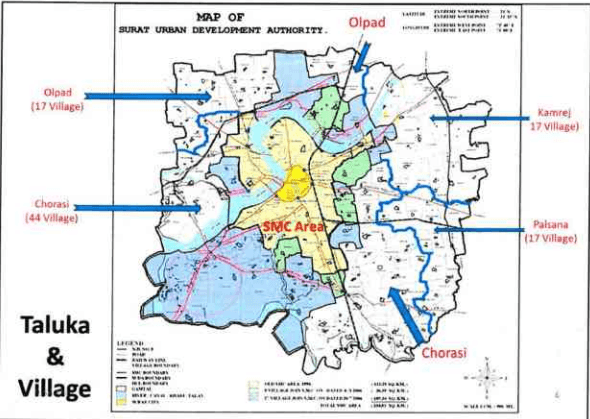
Figure 16: Taluka and Villages in SUDA
6.1 Population Growth Trends
The administrative boundaries of the SMC have been expanded time to time due to the need of accommodation of increasing number of citizens. However, SUDA has never so far had any spatial expansion of administrative limits since its establishment in year 1978 under The Gujarat Town Planning & Urban Development Act, 1976. Table 19 showing details of spatial extent of Surat urban spread over a period of time.
Page |37
2023年1月1日,公司收到的现金为人民币1,000万元。
2017
Table 19Spatial spread of Surat
Year
Area (sq.km.)
SMC
%
SUDA
%
1664 (Inner wall Area)
1.80
100
-
-
1707 (Outer wall Area)
7.40
100
-
-
1901
7.40
100
-
-
1941
7.40
100
-
-
1951
7.40
100
-
-
1961
8.18
100
-
-
1963
21.95
100
-
-
1971
33.90
100
-
-
1975
55.70
100
-
-
1978
55.70
7.17
722.00
92.83
1981
55.70
7.23
715.00
92.77
1986
110.00
13.33
715.00
86.67
1991
111.15
13.45
715.00
86.55
1994
112.28
13.57
715.00
86.43
2001
112.28
13.57
715.00
86.43
2006
326.515
31.35
715.00
68.65
2011
326.515
31.35
715.00
68.65
Source: City Development Plan, Surat (2006-2012)
Table 20 below states the population and density within SMC and SUDA areas respectively based on area of administration.
SURAT URBAN DEVELOPMENT AUTHORITY | Page |38
2017
Table 20Population of SMC with extended area in 2006 and SUDA exclusive of SMC
Year
SMC area
SUDA area (Except SMC)
SUDA area
Population
Density per sq.km
Growth Rate
Population
Density per sq.km
Growth Rate
Population
Density per sq.km
Growth Rate
1981
9,99,373
3,066
--
1,20,993
306
--
11,20,366
1,552
1991
16,24,135
4,982
62.52%
1,55,501
393
28.52%
17,79,636
2,465
58.84%
2001
28,68,603
8,799
76.62%
2,36,521
597
52.10%
31,05,124
4,301
74.48%
2011
44,67,797
13,721
55.75%
3,37,304
838
42.61%
48,05,101
6,655
54.75%
Source: SUDA, derived from Census 2011
Growth rate in both of the tables remarkably identify the difference of development pace accommodating citizens near their workplaces.
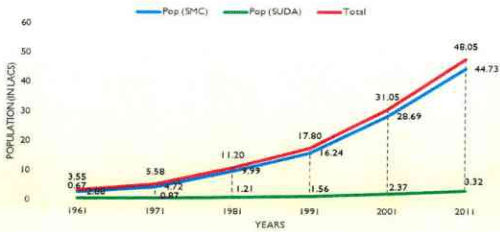
Interestingly, Table 20 shows the derived population growth and density for entire of Surat city (i.e. SMC and SUDA both combined). Here, with the effect of SUDA area population growth is visible and affecting the SMC population rise giving it moderate trend. Still, the decadal growth rate of the population in area is alarmingly above 54% which has reduced by around 20% from the previous decade.
Figure 17: Surat Population trends
As clearly observed in the Figure 17, SMC population is increased at a very higher growth rate comparison with rest of SUDA. It indicates that SMC serves as a growth magnet which attracts the people for living. Composition of population in administrative area of SMC and four Taluka are shown in Table 21. The major contribution (almost above 90%) in total population is through Surat city whereas rest is distributed almost equally among four Taluka forming rest of SUDA.
Page
Table 21Population composition in SUDA region
Sr.No.
Area
Population & percentage share in total population
1981
1991
2001
2011
1
S M C
9,99,973
89.20%
16,24,135
91.26%
28,68,603
92.38%
44,67,797
93.10%
Total (SMC)
9,99,373
89.20%
16,24,135
91.26%
28,68,603
92.38%
44,67,797
93.10%
2
Olpad Taluka
16,173
1.44%
17,799
1.00%
20,632
0.66%
19,657
0.40%
3
Chorasi Taluka
54,030
4.82%
68,078
3.83%
1,06,974
3.45%
1,69,053
3.51%
4
Palsana Taluka
20,787
1.86%
27,886
1.57%
49,691
1.60%
77,185
1.61%
5
Kamrej Taluka
28,562
2.55%
39,920
2.24%
56,848
1.83%
71,409
1.49%
Total (Rest of SUDA)
1,20,993
10.80%
1,55,501
8.74%
2,36,521
7.62%
3,37,304
7.00%
Grand Total
11,20,366
100.00%
17,79,636
100.00%
31,05,124
100.00%
48,05,101
100.00%
Source: SUDA, derived from Census 2011
It is observed that Surat city with area of 326.52 sq.km. i.e. 45.22% of SUDA area comprises 93.10% of total population of the urban agglomeration. The trend has been similar over the past decades and subsequently there has been spatial expansions observed for Surat city limits to accommodate the newly populated peri-urban pockets. Detailed note on village-wise population in context to city as well as SUDA administration boundaries can be referred in Annexure.
6.3Households
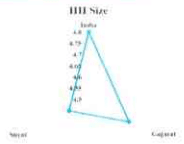
Out of all the spatial administrative constituencies, the average household size was reported as 4.85 persons per family in 2001 which has reduced to 4.60 persons in 2011 in the Census showing a declining growth in household size by 5.45%. The survey on Household size was released through NHFS-3 on 11 th April, 2007 by the IIPS, Mumbai designated by the Ministry of Health and Family Welfare (MoHFW, Gol) which shows that Surat has lower average household size (for 2011) than that of the Country as well as the State. (Figure 19)
Figure 19: Household sizes in SUDA
Source: NHFS-3, by IIPS through MoHFW, 2007
The table no 23 below shows the household size and rates for reported during Census 2001 and 2011.
It was observed that the wards of Surat city area (102 No.) have declined trend during the decade however, the number of households have increased by 39.92%. Moreover, except Olpad taluka constituencies, the HH has increased over past decade. Following table shows the growth of accommodating households in different taluka under SUDA administration.
Table 23Household data of Surat district
2001
2011
Growth Rate (%)
SMC
5,86,230
9,75,797
66.45
Chorasi
22,934
37,583
63.87
Kamrej
11,652
15,062
29.27
Olpad
4,135
4,052
-2.01
Palsana
11,629
18,249
56.93
Total
6,36,580
10,50,743
65.06
Source: Census of India, 2001 and 2011
-
2017
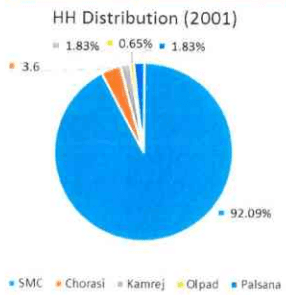
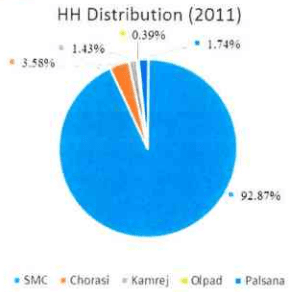
Following charts show the composition of households accommodated in SMC and other taluka under SUDA administration. It shows that with increase in number of households accommodated in different taluka level constituencies, the Surat city has retained its accommodating capacities (with spatial expansion in 2006).
Figure 20: Household distribution in SUDA (2001 and 2011)
6.4SEX Ratio
Surat being industrial and commercial activities oriented city, the sex ratio in the areas has been lower than the national and state average. However, the growth of male and female persons has been almost equal during Census 2001 and 2011. Following table show the male-female growth rates in the said duration.
Table 24Male and female populations
Administrative constituency
Male population
Female population
2001
2011
Growth rate
2001
2011
Growth rate
SMC
16,30,846
25,43,623
55.97%
12,45,528
19,24,174
54.49%
Chorasi
57,667
93,677
62.44%
44,476
68,822
54.74%
Kamrej
29,998
39,480
31.61%
26,850
31,929
18.92%
Olpad
10,716
10,001
-6.67%
9,916
9,656
-2.62%
Palsana
30,523
43,934
43.94%
21,060
32,985
56.62%
Total
17,59,750
27,30,715
55.18%
13,47,830
20,67,566
53.40%
SURAT URBAN DEVELOPMENT AUTHORITY |
Page
|43
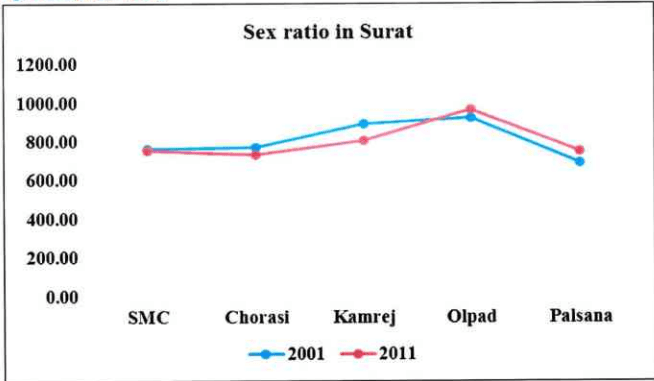
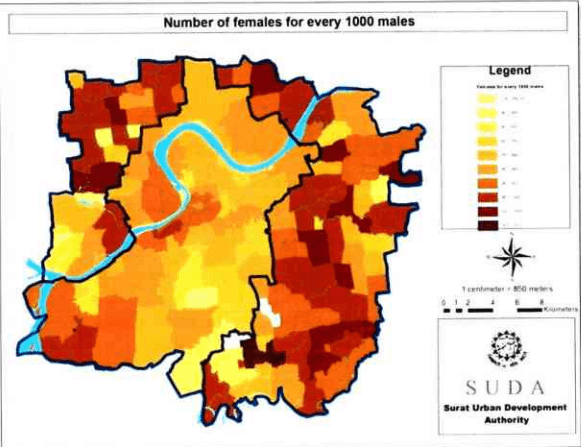
Average sex ratio for the area in Census 2001 was reported as 809 females per 1000 males which had reduced to 803 during Census of India, 2011. National average for the 2011 was reported as 908 and for Gujarat as 909 females per 1000 males.
Figure 21: Sex ratio in Surat
Figure 22: Female population for every 1000 male
6.5Sc/st Composition
Table below shows the composition of Scheduled Caste(SC) population in the city. The recorded data shows that the SC population share has reduced from 3.61% to 2.42% during 2001 and 2011 respectively. However, there is a net increase of 4.13% in the SC population during the decades.
Page |45
Table 26SC population composition in Surat
2001
2011
Growth rate(2001 to 2011)
SC
% share of SC
Total SC
% share of SC
SMC
1,00,272
3.49%
1,05,572
2.36%
5.29%
Chorasi
3,557
3.33%
4,378
2.69%
23.08%
Kamrej
5,054
8.89%
3,364
4.71%
-33.44%
Olpad
1,094
5.30%
668
3.40%
-38.94%
Palsana
2,380
4.57%
2,103
2.73%
-91.05%
Total
1,12,357
3.61%
1,16,085
2.42%
3.32%
Source: SUDA, derived from Census of India
Table below shows the composition of Scheduled Tribe(ST) population in the city. The recorded data show that the ST population share has reduced from 5.50% to 4.02% between 2001 and 2011. However, there is a net increase of 9.97% in the ST population during the decades.
Table 27ST population composition in Surat
2001
2011
Growth rate(2001 to 2011)
ST
% share of ST
Total ST
% share of ST
SMC
1,13,317
3.94%
1,31,622
2.95%
SURAT URBAN DEVELOPMENT AUTHORITY | Page |
-
2017
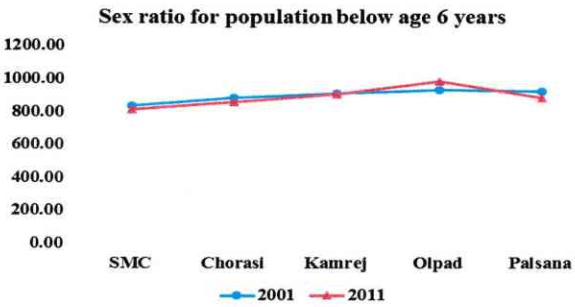
Except for Olpad area, other places have shown not only male predomination in the society but also reduction in female share in the total population. However, for the population of age below 6 years, the ratio is higher showing a very little improvement in the social balance in the city. The same was reported as 900 for the Census 2001 that has reduced to 891 in Census 2011 although reduction, the same is higher than the average of citizens.
Table 25Population of age below 6 years
Administrative constituency
Male population
Female population
2001
2011
Growth rate (%)
2001
2011
Growth rate (%)
SMC
1,83,520
3,01,237
64.14
1,53,836
2,45,728
59.73
Chorasi
7,958
11,232
41.14
7,073
9,652
36.46
Kamrej
4,406
4,624
4.95
4,026
4,201
4.35
Olpad
1,478
1,104
-25.30
1,380
1,090
-21.01
Palsana
3,643
5,781
58.69
3,375
5,127
51.91
Total
2,01,005
3,23,978
61.18
1,69,690
2,65,798
56.64
Figure 23; Sex ratio for population below 6 years of age