House is the most basic need of human being after food and clothing that needs to be addressed on priority. It not only provides shelter to a household but also fulfils all basic utilities and needs of each member of the family. Therefore provision of housing for the entire population in the city is essential. In Surat demand for MIG and HIG housing exists besides LIG and EWS housing. Since Surat is becoming the most important industrial hub of the country, the need for LIG and EWS housing for industrial labour is of greater concern in and around industrial areas. This chapter examines the present housing status, housing need, housing issues and related strategies. The chapter then reviews various housing policies that are likely to impact the housing stock in the city in future and provide basic housing to the entire population in the city.
9.2Housing Scenario
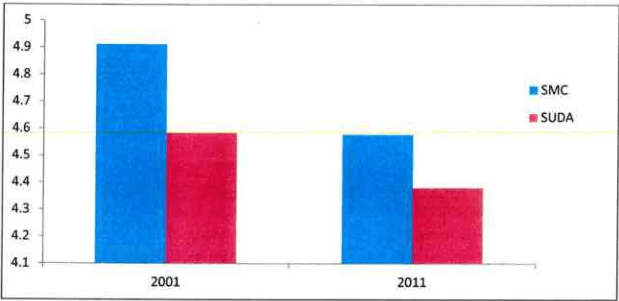
The current housing scenario for the city can be worked out through the average household projections for each of the administrative areas and the population of the city. The figure shows the past trend of Household Size by Administrative Areas for the years 2001 and 2011.
Figure 36: HH Size for Administrative Areas
Source: Census of India, Projection
The table below gives the details about the population, number of households and the household size for the administrative areas for the years 2001 and 2011.
Page
Table 54Population, Number of Households and Household Size of Administrative areas for the years 2001 and 2011
Sr.No.
Administrative Area
Population
No. of HHs
HH size
2001
2011
2001
2011
2001
2011
1
SMC
2876374
4467797
585532
975578
4.9
4.6
2
SUDA
239840
337304
52321
77593
4.6
4.4
TOTAL
3116214
4805101
637853
1053171
4.9
4.6
Source: Census of India 2001 and 2011
The table below summarizes the housing requirement for SMC and SUDA regions. The total housing requirement for the year 2035 for entire SUDA region is 23.75 Lakhs.
Table 55Housing Requirement Projections
Sr.No.
Administrative Area
Population
Housing Requirement
2021
2031
2035
2021
2031
2035
1
SMC
69,36,534
89,46,606
97,50,634
15,14,975
19,53,985
21,29,589
2
SUDA
5,27,961
6,80,954
7,42,151
1,20,494
1,55,411
1,69,378
TOTAL
74,64,495
96,27,560
1,04,92,786
16,35,469
21,09,396
22,98,967
Source: Census of India and Projection
The residential development in the city which is approx 55% of the total urbanized area. The growth in the city is taking place in the Southern and North-eastern direction with major development of planned and unplanned colonies. Area under residential use has increased drastically, from 2695.6 hectares in 1978 to 10,666 hectares in 2014, indicating the extent of the urban sprawl. The percentage distribution of residential area is 58.54% in 2014, which is on a slightly higher side then prescribed standards, which range from 40% to 45%. There are 399 slum pockets of SMC. Mainly these slum pockets are near the medium industry in South and South-East side of the city.
9.3Housing Stock
As per census 2011, the Surat city population of 44.66 lakhs, with total number of 13,86,245 of census houses. There are 67.24% of houses which are used for wholly residential use and 15.11% of houses are lying vacant in the city. Below table shows decade growth for central zone. The maximum population density (49,971 person per sq.km.) is in Central zone in mere 8.18 sq.km. area. As discussed above the central zone provided maximum employment opportunities and formation of squatter settlements, which are the root cause of its densification.
Page | 75
C C C C C C C C C C C C C C C C C C C C C C C C C C C C C C C C C C C C C C C C C C C C C C C C C C C C C C C C C C C C C C C C C
2017
The South-east Zone is highly inhabited with population of 7,48,304 (16.75% of total population). In respect to the population and area the East zone consists maximum numbers of Houses with 74.47% of it are optimally used for specifically residential purposes only. The table below is showing the total Housing Stock present in the city in the census year 2011.