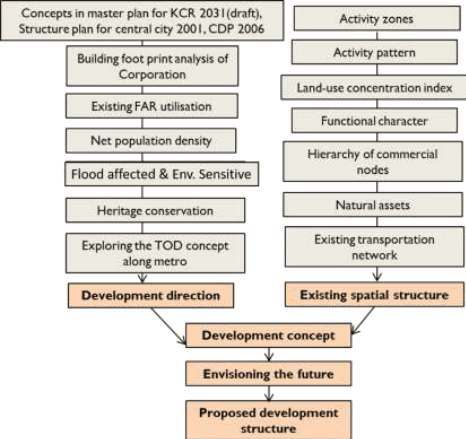
In order to envision the future growth of a city like Kochi, it is imperative to understand its existing spatial structure and development direction. The development direction is understood from the concepts adopted in previous master plans and development documents, building footprint analysis of Kochi corporation area, utilisation pattern of existing FAR limits, net population density distribution, general environmental vulnerability conditions heritage conservation and exploring the concept of Transit Oriented Development along metro corridor. Similarly the existing spatial structure of Kochi corporation area has been obtained by analysing using a GIS tool kit which helps to develop and understand the activity zones, activity pattern, land-use concentration index and functional character of the study area. An analysis on hierarchy of commercial nodes to understand the relevance and distribution of major commercial nodes, the existing transportation network within the city and the distribution of natural assets has been also included to obtain the existing spatial structure of the Kochi Corporation. The development direction and existing spatial structure has been brought together to derive at a future concept for development and then create an idea of how the future growth would be in each sector. The overall framework helps us to arrive at the proposed development structure for the city which would enable growth by sustainably utilising the existing resources and create an improved quality of life for its citizens.
Figure 28:1 Schematic representation of creating of Proposed Development Structure Source: LSGD (Planning)
Kochi Municipal Corporation
DEVELOPMENT CONCEPT
28.2Development Direction
Concepts Adopted in Structure Plan for Central City 2001
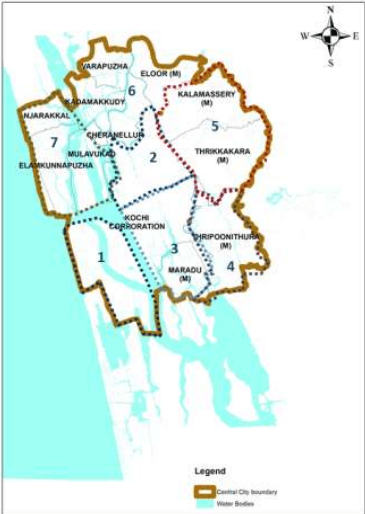
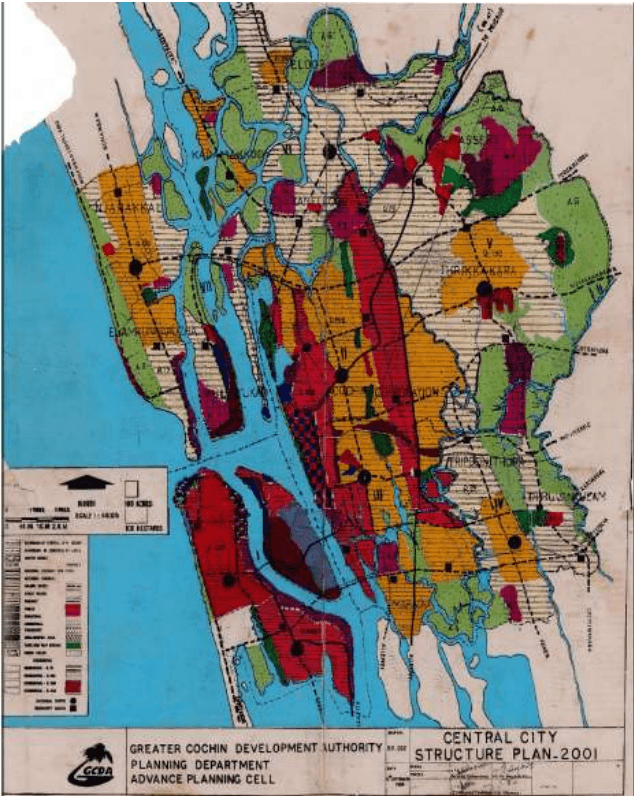
The structure plan which is currently operational is applicable to Cochin Corporation, 5 municipalities (Thrippunithura (M), Kalamassery (M), Eloor (M), Thrikkakara (M), Maradu (M)) and 5 panchayaths (Mulavukad, Njarakkal, Elamkunnappuzha, Cheranelloor, Kadamakkudy and Varapuzha). According to the concept adopted the planning area was divided into seven planning divisions. It was divided as self-contained settlement of communities with regard to their requirement of work places, residential accommodation, shopping, community facilities and recreation. The future population and densities were assigned based on the holding capacity and future growth trend in each of the divisions. It was further sub divided into communities with population ranging from 30000 to 40000. Area under each of the planning divisions was divided into well-defined zones specifying the land use and density of population. The control of land use and density was to be achieved through zoning regulations. The density in the core division was kept high and in the peripheral divisions, the density was assigned low so as to provide space for future planned growth. The land use plan proposed to accommodate major share of the future land requirement for commercial use in the CBD areas and planned sub centres and community centres (Serving 3000 to 4000)
Figure 28:2 Planning divisions as per Structure Plan for Central City 2001 Source: Generated by LSGD (Planning)
Kochi Municipal Corporation
DEVELOPMENT CONCEPT
Figure 28:3 Land use areas as per Structure Plan for Central City 2001 Source: Structure plan for central city -2001
Concepts Adopted in City Development Plan 2006
Kochi city was identified for being developed under Jawaharlal Nehru Urban Renewal Mission (JNNURM). A City Development Plan (CDP) for Kochi would serve as a basis for the Government of India to sanction funding under JNNURM. A City development Plan prepared for Kochi analyses the present status, assesses the future requirements based on
Kochi Municipal Corporation
DEVELOPMENT CONCEPT
growth potential and provides a systematic plan for a sustained growth of the city and its environs.
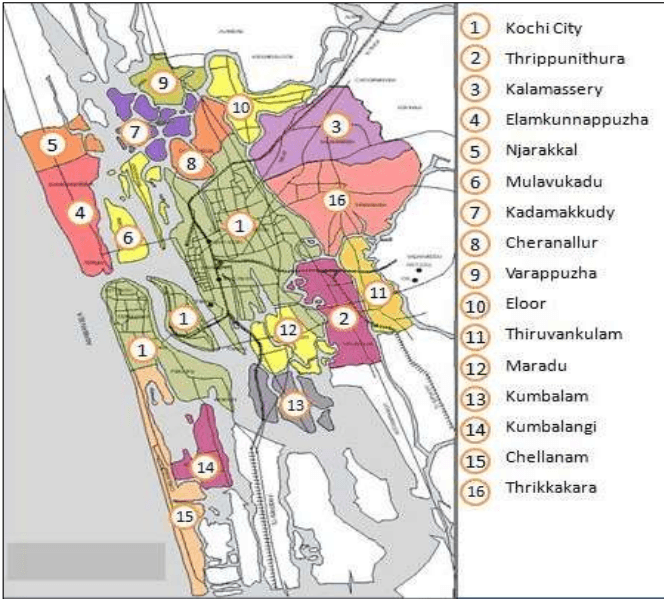
Kochi city, Thrippunithura, Maradu, Thrikkakara, Kalamassery, Eloor , Cheranelloor, Varappuzha, Kadamakkudy, Mulavukadu ,Elamkunnappuzha, Njarakkal, Kumbalam, Kumbalanghi, Chellanam, Vadavucode-,Puthenkurishu and Thiruvankulam. In the plan separate goals and objectives were identified for each of the sectors like Heritage, Spatial Growth Trends and Land Utilization, Water supply, Sewerage, Solid waste management, Drainage, Transportation, BSUP, Social amenities and urban renewal and Tourism.
Figure 28:4 Local bodies within the CDP area Source: City Development Plan 2006
FAR Utilization
As per the Kerala Municipal Building Rules, the maximum permissible FAR in Residential A1 (plotted residential) is 3.0 whereas with an additional fee, the same may be increased to 4.0. For Special Residential A2 category, the maximum permissible FAR is 2.5 whereas with additional fee, it may also be utilised up to a figure of 4.0. Similarly, for commercial and institutional uses such as educational, medical and offices, the maximum permissible FAR varies from 2.0 to 2.5 which may be increased to 3.0 or 4.0 (in case of mercantile businesses).
It is imperative to note that FAR of 3.0 and 4.0 is very high, extensive and exhaustive. Even in metropolitan cities such as Delhi and Mumbai, such FARs being utilised is rare, whereas in Kochi with distinctly sub-divided smaller plots achieving these FARs is not in near future visualisation. Based on the primary surveys conducted by Urban Mass Transit Company ltd, on an average an FAR of 1-1.25 is most common with very few exceptions. Another reason for absence of such high FAR utilisation is found to be absence of a regulation for mixed uses. The KMBR Rules as well as the Development Plan for Kochi do not encourage mixed land uses, as a result of which such high FAR on a single land use is seen as a rule which may bring in an exodus supply of a single use as against the demand in the market.
Concepts Adopted in Master Plan for Kochi City Region, 2031
Before going into the development concept and strategies for the Kochi corporation area, an understanding of the regional context needs to be established. The Master plan prepared for Kochi City region, 2031 is at present in the draft stage. The master plan comprises of
Kochi Municipal Corporation
DEVELOPMENT CONCEPT
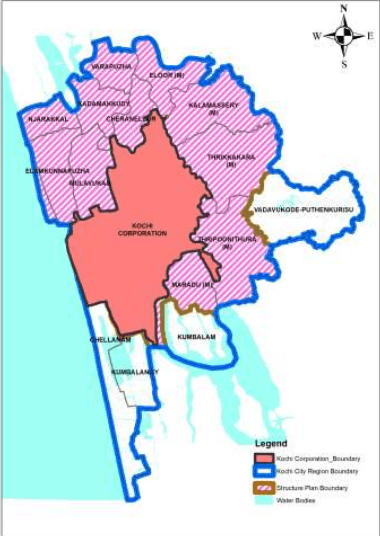
Kochi Corporation as its core area with 5 municipalities (Tripunithura, Maradu, Thrikkakara, Kalamassery, Eloor) and 10 Panchayaths (Cheranelloor, Varappuzha, Kadamakkudy, Mulavukadu, Elamkunnappuzha, Njarakkal, Kumbalam, Kumbalanghi, Chellanam, Vadavucod-Puthenkurish). The concept and strategies adopted at the regional level is directly a beacon of light for towards the development of the Kochi Corporation.
Figure 28:5 Boundaries of Kochi corporation, KCR and structure plan Source: Generated by LSGD (Planning)
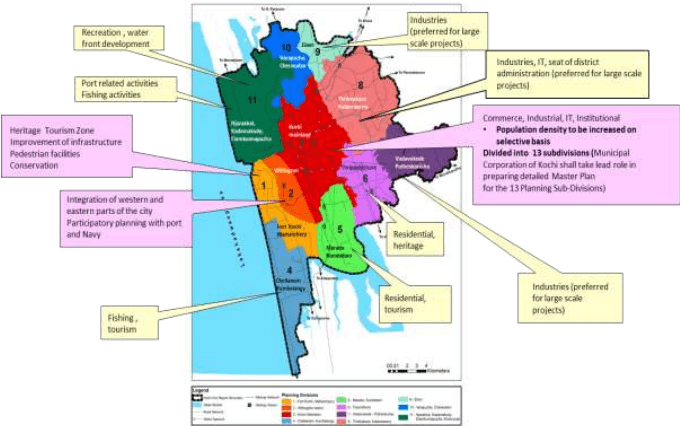
The planning area comprising Kochi City and the constituent units may be treated as a single unit for planning purposes but with different planning divisions for formulating land use proposals and detailed zoning regulations. The planning area thus identified may be subjected to distinct planning interventions to enable them to exercise the desired function exploiting the potentials. Areas like Maradu and Thrippunithura municipality have a potential to be residential hubs and cater to tourism through its backwaters and heritage assets. However Eloor municipality is developing into an industrial hub along with Thrikkakara municipality which is also catering to the IT needs of the state and the district administration along with a residential population primarily attached to these functions. The NH 544 & railway lines (Kochi Bangalore industrial corridor) supports the industrial needs of both the municipalities taking the industrial growth into the outer peripheries of Kochi Corporation. When other Panchayaths like Chellanam & Kumbalangy is developing through fishing and
Kochi Municipal Corporation
DEVELOPMENT CONCEPT
tourism activities Panchayaths like Njarakkal, Kadamakudy, Elamkunnapuzha focuses on port related activities, fishing and creating recreational tourism opportunities with its assets.
Figure 28:6 Schematic diagram showing development direction of local bodies in KCR area Source: Generated by LSGD (Planning)
When it comes to Kochi Corporation there are 3 main planning divisions
Fort Kochi, Mattanchery: This area has a potential for being a Heritage Tourism Zone as per the master plan. However being thickly built up and bordering on slum like conditions, there is much scope for improvement of infrastructure and retrofitting activities. The congestion in transportation corridors call on for focus on pedestrian facilities and NMT. The existing character the area with its cosmopolitan community structure and backdrop of heritage buildings and streets asks for conservation measures to be undertaken in the area to preserve its social and heritage fabric.
Willington Island: As per the master plan the focus should be on Integration of western and eastern parts of the city through participatory planning with port and Navy.
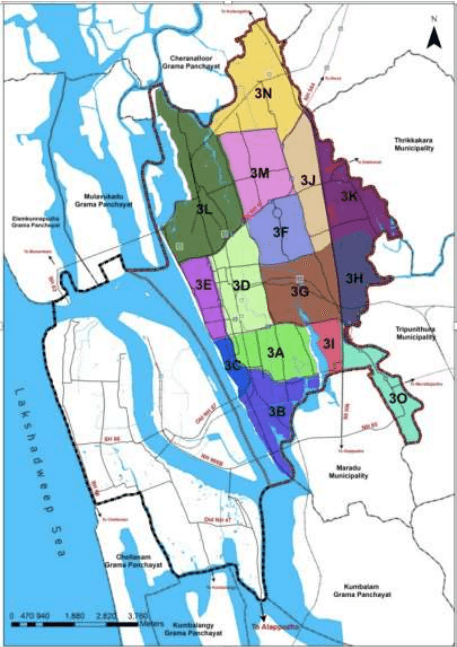
Kochi main land which is split into 13 sub-divisions (3A,3B,3C,3D,3E,3F,3G,3H,3I,3J,3K,3L,3M,3N,3O). The entire focus for Kochi corporation is to develop in commercial, IT, institutional sectors. High density development in the area with participation from the local body, residents
Kochi Municipal Corporation
DEVELOPMENT CONCEPT
associations, real estate developers, traders etc. may be the focus of development here.
Figure 28:7 Planning Subdivisions in mainland as per KCR 2031 Source: Generated by LSGD (Planning)
Uncertainties of future development were not comprehended at the preparation of development plan for KCR in 2009. Several major changes has happened over time in the last decade like development of port area (container terminal , LNG terminal etc.), metro, water metro, changes in transportation infrastructure (bridges , increase in road widths etc.), Muziris Biennale, smart city projects, boom of Commercial nodes like Edapally , frequent urban floods, effects of pandemic in various sectors etc.
Kochi Municipal Corporation
DEVELOPMENT CONCEPT
Exploring Transit Oriented Corridor along Metro
Currently the density all along the metro corridor is quite low. The future of the city calls in for a compact development along a major transit corridor such as metro with mixed-use high-density development near transit facilities and high-quality walking environments. One of the key principles of TOD is to have a mix of uses around the transit station. The other reason for mixed-use development is so integral to TOD is that it balances the peak ridership flow on the transit system. This type of compact development reduces infrastructure asset requirement and costs.
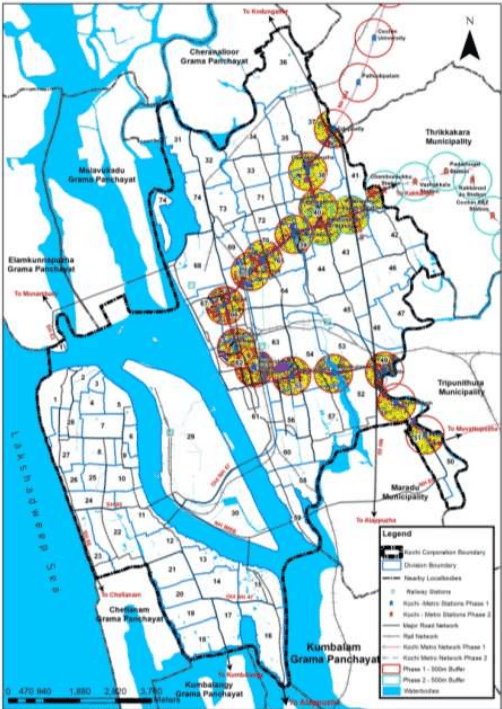
A continuous stretch of 500 m from the metro corridor can be taken up on both sides as TOD zone. Currently the density all along the metro corridor is quite low. To achieve an appropriate TOD density for a given station area, a combination of density baselines i.e. population and residential density and density bonuses are to be provided.
The TOD Corridor area is envisioned to have a mixed land use throughout with preference given to vertical mix use. However, horizontal mixed land use may also be allowed given that any new vertical mixed use coming up in these use zones shall be guided by the TOD guidelines for the zones. Since the transformation from current low density single use development to vertical mixed use may be dependent upon market forces and timeframes, adequate mix of uses horizontally are also encouraged.
New transit-oriented development corridors may be opened up to develop a transportation-oriented development system for Kochi City. Transit Oriented Development may be oriented along the metro stations.
Kochi Municipal Corporation
DEVELOPMENT CONCEPT
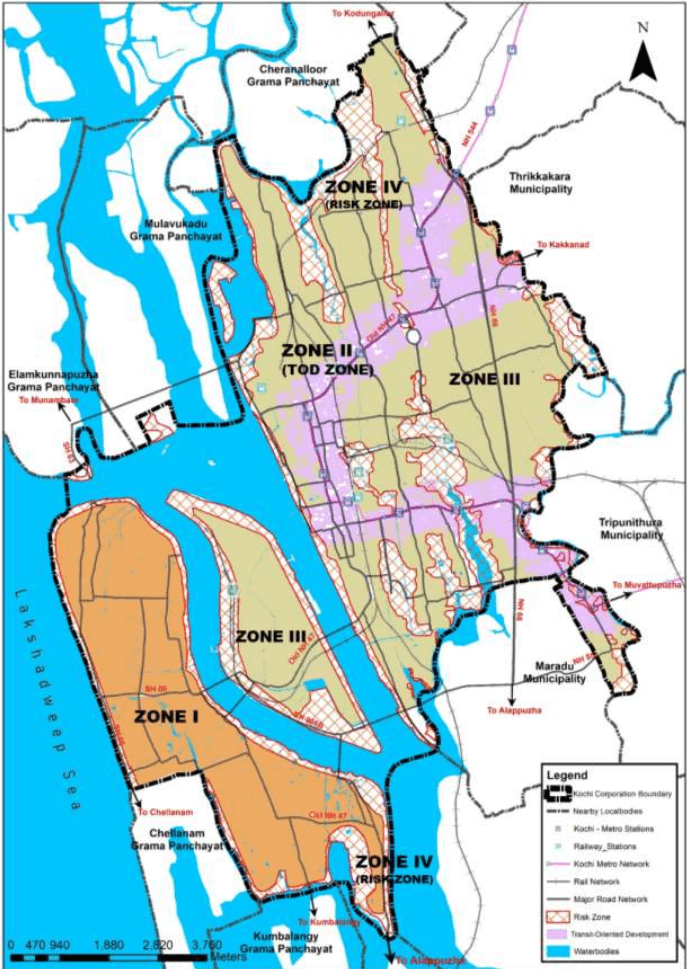
Figure 28:9 Transit Oriented Development Zone Source: Generated by LSGD (Planning)
Building Footprint Density
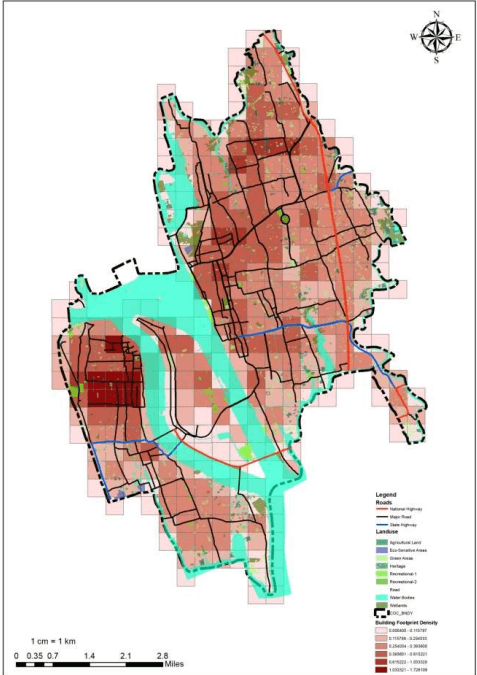
The existing building foot print (Building extent) of city is taken from satellite imagery and GIS analysis is done to identify the pattern of the distribution of built up area. From this the direction of development intensity can be analysed for the city. The building foot print data is generated from satellite imagery divided into grids of 1000 mts X 1000 mts.
(Limitation: The built density map does not analyse the vertical growth of building and is focused on the ground cover)
Foot Print Density=Total Area of the GridTotal Footprint area in a Grid
Figure 28:8 Building Footprint Density
Source: Generated by LSGD (Planning)
As shown in the figure above, the building footprint shows clustered settlement pattern in Fort Kochi and Mattancherry area which is along the coast with high building footprint density. The footprint in the central city area is also dense due to high commercial activities.
Kochi Municipal Corporation
DEVELOPMENT CONCEPT
The physical/built development is found along major transport corridors of the city Banerjee road, MG road, Chittoor road and SA road, Edapally road etc.
Location of Heritage Structures
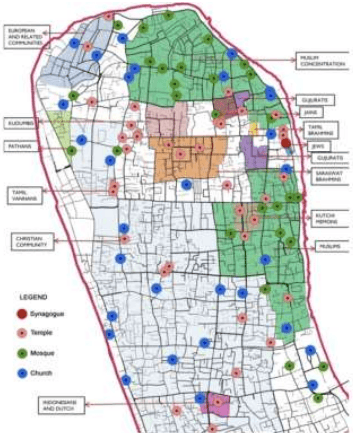
As explained in the chapter on Heritage, Fort Kochi, Mattancherry and Central area of Kochi Corporation houses most of the heritage structures within the city. The trade and port activities brought people from all over the world to Kochi through Fort Kochi and Mattancherry.
The Fort Kochi Mattancherry area has a cultural mosaic that has been evolved through its intricate variety of community structure. This past has several admirers and visitors from within the country and beyond. Hence it is important preserve the heritage value and character of the area from the haphazard and slum like developments cropping up.
Kochi Municipal Corporation
DEVELOPMENT CONCEPT
Figure 28:12 Location of Heritage Structures Source: Generated by LSGD (Planning)
From the above analysis for development direction the following inferences can be drawn.
In the regional context, it can be inferred that the much preferred residential locations are within Maradu, Tripunithura, Kalamassery municipalities owing to the high land value in the city and better residential setting in the peripheries.
The Fort Kochi and Mattancherry area have high intensity of built density and high population density. The areas in the south are also under strain due to high population density.
Being a heritage zone Fort Kochi Mattancherry area and its immediate surrounding are facing loss of character from mushrooming inorganic development through its congested roads and poor infrastructure. Highest number of BPL population is observed in the West Kochi area and this is also chosen more as temporary residence by migrant working population.
Those areas which are prone to flood and inundation along with wetlands, marshlands, water bodies etc. are observed to have less built density and lower land value. The higher land value in prime areas would tend to lead the citizens to move on to the peripheries or on areas with lower land value putting on pressure of existing conservation areas. Development in these areas thus needs to be done in a sustainable manner with mitigation measures.
To regulate the urban sprawl and to create a compact urban form, the existing residential areas are envisioned to be strengthened through inclusion of concepts such as Transit Oriented Development and Sponge cities
Kochi Municipal Corporation
DEVELOPMENT CONCEPT
Areas in the southern part of West Kochi like Palluruthy already house a large number of population (as observed from net population density map) who are suffering from tidal flood effects.
Zone I: The intensity of building footprint in the Fort Kochi, Mattancherry area is high. However when considering issues like recent flood events, tidal floods, storm surges and future potential disasters the area along the coast of corporation area is vulnerable (refer environment vulnerability map) with its high population and built density. Being a heritage zone and an attraction to tourists it is imperative to protect this area from further degradation environmentally and socially. The infrastructure facilities have to be upgraded and an overall redevelopment focusing on the integrity of heritage and environmental quality needs to be the focus.
Zone II: The area along metro corridor which can be designated for Transit oriented development shall be zone II which is proposed for compact redevelopment and Redensification.
Zone III: The area can be called outer city area in the path of urbanisation which could be used for development however without falling prey to organic growth and disorganisation. Focus can be given to vertical development and providing more green cover to aid natural functions.
Zone IV: Those areas within city which are under the influence of canals, tides, inundations, wetlands, marshlands and water bodies which naturally are not chosen for built densification and needs to be conserved and discouraged from high infrastructural load to improve the environment quality and decrease the flood and other disaster susceptibility.
Table 281 Development Strategy
Zones identified
Development strategy
Zone I
Decongesting by bringing down FAR.
Zone II
Transit oriented development for compact urban development along metro corridor. • Higher FAR with incentives for high density development • Promotion of Mixed Use development • Promotion of plot amalgamation • Less pressure on infrastructure • Minimum traffic interruptions • High quality pedestrian infrastructure Development regulations to be provided in Transit oriented development
Zone III
Rest of the Kochi city area except Zone I, zone II and zone IV. FAR modified to act as receiving zone for decongesting Zone 1. Permissible FSI is as per KMBR.
Zone IV
Risk informed guidelines shall be applicable along with development control regulations in these areas which are flood prone thereby ensuring sustainable development through mitigation measures.
Source: LSGD (Planning)
Kochi Municipal Corporation
DEVELOPMENT CONCEPT
Figure 28:13 Zone Wise Distribution of Development Strategies Source: Generated by LSGD (Planning)
Kochi Municipal Corporation
DEVELOPMENT CONCEPT
Net Population Density
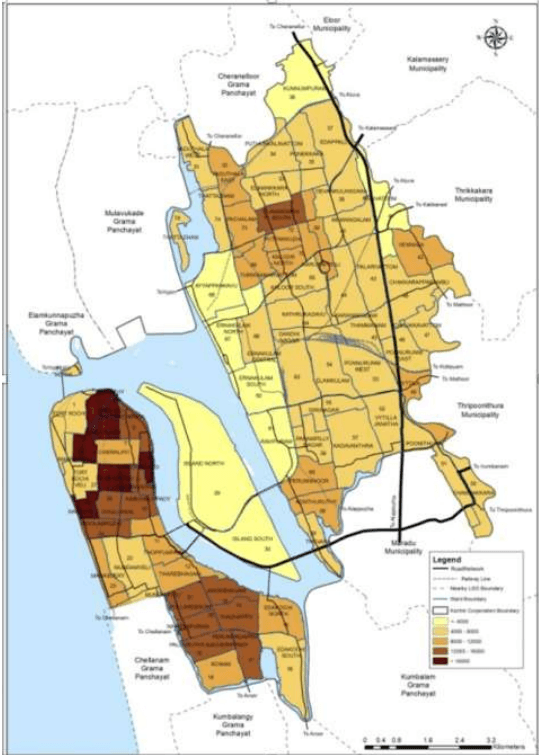
Net population density is highest in Earaveli ward with (3),35608 pp/sq.km, Kochangadi ward(3) with 27370 pp/sq.km followed by wards Amaravathy(28), Nasrath(26) and Kalvathy(2) almost equal to 20000 pp/sq.km. Island North ward (30) in Willingdon has the least population density of 581 pp/sq.km.
Highest population density is seen in the Fort Kochi –Mattancherry area and southern wards of West Kochi. Northern and southern wards of the mainland also show relatively high population density while the least in seen in the Island. Central city area has very low population density compared to the other areas (Below 4000 pp/sq.km)
Kochi Municipal Corporation
DEVELOPMENT CONCEPT
Figure 28:10 Net Population Density Map of Kochi Corporation Source: Generated by LSGD (Planning)
Flood affected areas and environmentaly sensitive areas
It can be understood from the map that West Kochi is under strain from being highly sensitive especially in the southern parts like Palluruthy which are prone to flooding. Similarly nearby banks of canals, Chilavannoor Lake and surroundings which are inundated areas, and areas like Mangalavanam, Thanthony thuruthu with mangroves and wetlands are other prominent sensitive patches.