Data Analysis and Trend Identification: SCADA systems collect and store vast amounts of historical data on pressure, flow, and water levels. Analysing this data can help identify trends and patterns that might indicate slow or developing leaks that wouldn’t be obvious in real-time readings.
Alarm Systems and Notifications: SCADA allows for the configuration of sophisticated alarm systems based on various parameters and their combinations. This ensures that operators are alerted to potential leaks promptly via SMS, email, or visual indicators on the SCADA interface.
For Coimbatore LPA’s water supply system, implementing a SCADA system would involve:
A. Instrumentation: Installing various sensors (pressure, flow, level, water quality) at strategic locations throughout the water network. This can be carried out in phases primarily targeting urban areas with metered water connections. In the later stage, it can be expanded to the rest of LPA when 100% water metering has been achieved.
B. Communication Infrastructure: Establishing a reliable communication network to transmit data from the sensors to a central control room [ICCC already commissioned through Smart City Initiative] with SCADA software for data visualization, monitoring, and control.
C. Trained Personnel: Training operators and maintenance staff to effectively use the SCADA system for leak detection and prevention.
8.8.4The Water Centre
Some of the important recommendations that enable in successful implementation of Decentralized STPs are,
Policy Support: The establishment of policies to promote small sewage treatment plants (STPs) has been crucial in driving the growth of decentralized systems in India.
Water Reuse: Effective reuse of the treated water for irrigation, Ground Water Recharge, Construction and Industrial non-potable use should be established through norms and policy guidelines.
Drawing inspiration from BWSSB, a holistic approach to water management, addressing both supplyside augmentation and demand-side management can be strategized through the initiation of a “Water centre” that acts as repository of existing water landscape, treated water reuse policies, Non-Revenue Water Reduction, RWH, Water Tariffs, Public awareness campaigns and many more.
It is suggested that TWAD board can act as the nodal agency in establishing the centre and developing policies that can be aligned with the central level guidelines such as “National Framework on Safe Use of Treated Water”, CPHEEO norms etc., The water centre can take up the following activities,
8.8.4.1 Develop A Comprehensive Treated Water Reuse Policy
A. Formulate a clear policy outlining the goals, strategies, and implementation framework for treated wastewater reuse in Coimbatore.
B. Identify potential sectors for reuse, such as agriculture, industries (textile, manufacturing), construction, and urban landscaping.
C. Establish quality standards for treated water based on the intended use, ensuring environmental and health safety
D. Incentivize the use of treated water by industries, institutions, commercial buildings and residential communities.
8.8.4.2 Guidelines on Mandating Use of Treated Water by ULBs, Industries, Institutions, Commercial Buildings and Larger Residential Communities
A. Apart from the existing standards on quality of the treated water prescribed by TNPCB, regulations can be prescribed on amount of treated water that has to be mandatorily utilized by Industries, Institutions, commercial buildings and larger residential communities for non-potable usage, GW recharge and irrigation.
B. Stringent guidelines can be brought into force that building construction should only use treated water and usage of borewells should be prohibited completely for its water usage.
8.8.4.3 Digital Marketplace for Treated Water
This web portal, [potentially maintained by TWAD board in collaboration with TNPCB] will act as a central hub, providing comprehensive information about the availability, characteristics, pricing, and logistical aspects of treated water from various Sewage Treatment Plants (STPs) in the zone. The portal would also work as an online marketplace for ULBs, private institutions, larger residential and commercial units to sell excess treated water. Based on the quality of the treated water, it can be utilized for irrigation, GW recharge through shallow aquifers, construction requirements, air pollution control etc.,
The portal can feature a dynamic dashboard displaying the real-time availability of treated water from participating STPs. Crucially, it will also provide detailed information about the quality parameters of the treated water, adhering to the standards set by the TNPCB for different reuse applications potentially as quality reports.
Potential buyers can register on the platform, specifying their water requirements in terms of volume, quality parameters, intended use, and preferred location. This will enable the system to match their needs with available treated water sources with secure online payment and integrated logistics options.
These activities have the potential to aid in stewarding towards a water-secure region that not only replenishes existing surface and sub-surface sources but also encourages the maximum use of recycled water thereby enabling a circular economy.
8.8.5Storm Water Management Policies
Treatment of Runoff Water: Runoff collected through the storm water drainage system should be treated before being discharged into natural water bodies. At present, 2 Water Treatment Plants are available at the Corporation, and Municipalities lack a Water Treatment Plant. Given the region’s low rainfall and limited runoff, a Water treatment plant of 1-3 MLD is proposed in the Municipalities. Considering the spatial location and the run of rain water the capacity for the Water treatment plan is considered.
Table 8.40Proposed Water Treatment Plant for Storm Water
Municipality
Capacity of Water Treatment Plant (in MLD)
Area required (in Ha)
Survey number details
Gudalur
2
0.04
594pt
Madukarai
3
0.06
166 pt
Karuma-thampatti
2
0.04
130 pt
Karamadai
3
0.06
138 pt
Total
10
0.2
Green Buffer zone: The Major drains connecting the water bodies is identified, the linkage of the drains is proposed to ensure strengthening of the drainage pattern of the LPA. A Green Buffer zone as per TNCDBR is proposed along the major drain link in order to avoid encroachment of the major drain due to urbanisation, flooding and to maintain a seamless linkage of the major water bodies.
Following the Master Plan, a comprehensive Drainage Master Plan should be developed for the Coimbatore Local Planning Area (LPA). This plan must provide detailed mapping of the existing drainage network, identify missing links, and propose measures for flood mitigation. It should also incorporate sustainable practices aimed at ensuring long-term resilience. A drainage master plan similar to the Drainage Master Plan for the National Capital Territory (NCT) of Delhi or Assam is required for the Coimbatore LPA, The Drainage Master Plan should further include a robust flood monitoring system and strategies for enhancing groundwater recharge.
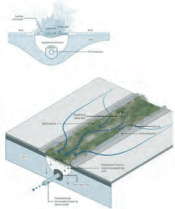
The conventional concrete storm water drain can be replaced by Bioswales at low to medium dense development with wider roads.
a. Bioswale: is a vegetated, shallow channel specifically designed to manage stormwater by slowing, collecting, filtering, and infiltrating rainwater into the ground. When incorporated into urban drainage networks, bioswales help to reduce surface runoff volume, improve water quality, and support groundwater recharge.
b. Infiltration drain: For High dense area with lesser road width, a storm water drain with an infiltration drain can be considered. An infiltration drain is a stormwater management system that collects rainwater and then gradually releases it into the ground, replenishing groundwater resources. These systems are often made of modular plastic crates connected to form a large underground drain, covered with a geotextile to facilitate the infiltration process.
8.9 Proposal Phasing
Figure 8.16: Bioswale as Storm Water Drain
8.9.1Phasing of DEWATS
Other than the Corporation area wherein completed Underground Sewerage System is proposed, setting up decentralized Sewage Treatment Plants can be carried out in phases throughout the LPA. This is strategized considering the following factors,
Ground Water Recharge Potential
Aquifer Depth and Thickness
Institutional Cluster
Industrial Effluent Treatment
Based on previous analysis, it is observed that most of the LPA is over exploited in-terms of Ground Water extraction. This is an important link where treated water, on confirmation of compliance with requisite standards, can be utilized to augment ground water potential. It was observed that the eastern portion of the LPA had acute Ground Water exploitation and also had shallow aquifer depths making it more potential for efficient Ground Water Recharge. As depicted in the Map 8.24, this cluster is considered in the first phase for setting up of DEWATS and water reuse for ground water recharge. Intensive industrial areas and proposed clusters are also considered in this phase so the treated water reuse can be effectively utilized by industries also.
In the second phase, Decentralized STPS can be extended to sub- cluster levels, for instance, institutional clusters, IT parks and service-chains for efficient reuse of treated water for various purposes such as gardening,
flushing, district cooling systems etc., and village panchayats in the western part of the LPA can be taken up in the third phase, if required, after careful consideration on enhancing the sewage treatment capacities in CCMC.
Table 8.41 represents the quantity of sewage to be treated and area required for setting up DEWATS at administrative unit/ cluster level. It should be noted that the technology proposed is tentative and is subject to change as per future trends & raw sewage parameters during the time of design & construction to meet the discharge standards as prescribed by CPCB/TNPCB.
The phasing of the stormwater drain implementation has been strategically planned to address both current and future needs. In the short and medium term, efforts will focus on bridging the existing gaps in the stormwater drainage system. Meanwhile, the proposed expansion and development of the stormwater drainage infrastructure will be tackled in the medium- and long-term phases. The table below outlines the detailed phasing of the stormwater drain project, along with the total cost involved for each phase.
Table 8.42Phasing of Storm Water Drainage
Phasing
Proposed Storm water drain
Proposed Storm water Drain (in Km)
Estimated Cost (in cr.)
Short Term(2025 -2031)
Existing Gap in Coimbatore Corporation
1104.46
938.79
Existing Gap in Municipality
419.50
356.57
Short Term (2025 -2031)
1523.96
1295.37
Mid Term(2031-2035)
Existing Gap in the Town Panchayat
1010.98
185.52
Existing Gap in Villages
2029.67
372.44
Proposed Stormwater Drain in the Corporation
108.93
92.59
Proposed SWD in Municipalities
7.11
6.04
Mid Term (2031-2035)
3156.69
656.59
Long Term(2035-2041)
Proposed SWD in the Town Panchayat
25.87
4.75
Proposed SWD in Village Panchayat
103.33
18.96
Long Term (2035-2041)
129.20
23.71
Grand Total
4809.85
1975.67
SOLIDWASTE MANAGEMENT
9.1 Solidwaste Management
Solid waste management in Coimbatore Corporation follows a structured process involving the collection, segregation, transportation, and disposal of waste. As one of Tamil Nadu’s prominent cities, Coimbatore faces significant challenges due to its high population density, industrial activities, and growing residential sectors, resulting in the generation of substantial volumes of solid waste. This chapter focuses on the solid waste generation across various urban and rural localities within the Coimbatore Local Planning Area (LPA), including the Corporations, Municipalities, Town Panchayats, and Revenue Village.
Source: Data collected from ULB, 2025
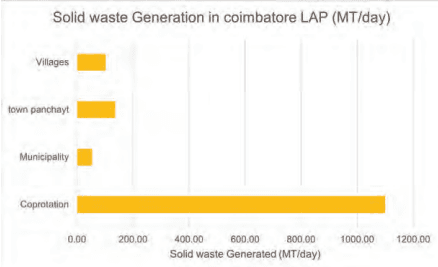
Figure 9.1: Solid Waste Generation in Coimbatore LPA in MT/day
The total solid waste generated within the Coimbatore LPA is approximately 1,390.33 metric tons (MT) per day. Of this, Coimbatore Corporation contributes about 79% of the total waste, while the villages account for roughly 7.28%. The composition of the solid waste generated across the Coimbatore LPA is illustrated in the Figure 9.1.
The per capita solid waste generation within Coimbatore LPA varies significantly, with Coimbatore Corporation generating approximately 479 grams per person per day, while Village Panchayats generate around 129 grams per person per day. On average, the overall per capita solid waste generation across the Coimbatore LPA is about 374 grams per day.
9.1.1Existing Scenario of Solid Waste Management
9.1.1.1 Solid Waste Generation in Coimbatore Corporation
Coimbatore Corporation spans an area of 257.04 square kilometres and accommandates a population of approximately 2,297,839 people as of 2024. The city generates around 1,100 metric tons of waste daily, with a per capita solid waste generation rate of about 479 grams. To enhance waste management, the Corporation has implemented a waste segregation system, classifying waste into biodegradable and non-biodegradable, as well as wet and dry categories. The percentage distribution of each waste category has been analysed to ensure more effective management and processing. The Table 9.1 represents the source of solid waste generation in the corporation
Table 9.1Existing Solid Waste collected from the source
S. No
Description
Water collected (MT)
1
Quantity of waste generated from Households
605.03
2
Quantity of waste generated from Commercial Establishments
393.95
3
Quantity of waste generated from Markets and Shandies
34.53
4
Quantity of waste generated by Bulk Waste Generators
66.49
TOTAL
1100
Source: Data collected from Coimbatore City Municipal Corporation, 2025
Households generate the highest share of waste, contributing 55% of solid waste, emphasizing the need for source segregation and efficient collection. Commercial establishments produce a significant 36%. Markets primarily generate 3% of waste, which can be effectively managed through composting. Bulk waste generators contribute 6% of waste, requiring targeted waste management solutions
9.1.1.2 Composition of Solid Waste
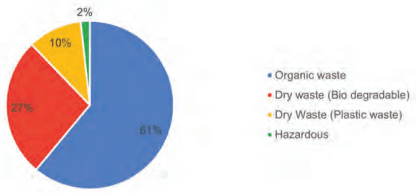
The Solid waste generated is segregated at the source during the door-to-door collection of the solid waste. The highest share of solid waste is Organic waste which accounts for about 61% of the total solid waste collected and the collected waste is transferred to the composting plants. The dry biodegradable waste accounts for about 27% of the solid waste and this are segregated and sent to the Material recovery facility and recycling unit. The non-biodegradable plastic waste accounts for about 10% and are sent to Material recovery facilities and 2% of Hazardous waste are collected and sent to the incinerator. The following Figure 9.2 provides the composition of solid waste collected in Coimbatore Corporation.
Source: Data collected from Coimbatore City Municipal Corporation, 2025
Figure 9.2: Solid Waste composition in the corporation
9.1.1.3 Solid Waste Treatment Facilities in Corporation
Coimbatore Corporation generates 1,100 metric tonnes (MT) of solid waste per day. To treat and manage the solid waste generated per day, the Corporation has established various facilities to treat different types of waste. A significant portion of the solid waste generated is organic waste which is about 671.55 MT/day, the organic waste is processed by multiple facilities including the Waste-to-Compost plant at Vellalur, as well as vermicomposting and micro-composting centers. In addition, around 409.14MT of dry waste is generated daily. Of this, approximately 277 MT is recycled through Material Recovery facilities (MRF) and recycling centres. The remaining dry waste is either sent to
cement factories or handed over to authorized plastic waste handlers for reuse. The table below outlines the current solid waste treatment infrastructure in Coimbatore Corporation. In support of the waste management system, the Corporation operates three transfer stations to streamline the collection and transportation process. These are located at Peelamedu (200 TPD), Ukkadam (200 TPD), and Sathya Road (125 TPD). Waste collected from various wards is temporarily held at these stations before being transported to the Vellalur dump yard. The Table 9.2 below provides an overview of the current solid waste treatment infrastructure in Coimbatore Corporation.
Table 9.2Existing Solid Waste Treatment Facility in Coimbatore Corporation
S. No
Solid Waste Management Facility
Type of Waste
Capacity (TPD)
1
Waste to compost Plant at Vellalur
Organic Waste
55 0
2
Vermicomposting
Organic Waste
100
3
MCC
Organic Waste
35
4
Recyclables and RDF Processing
Dry Waste
240
5
Material Recovery Facilities
Dry Waste
50
6
Animal Waste processing
Organic Waste
10
Total
985
Source: Data collected from Coimbatore City Municipal Corporation, 2025
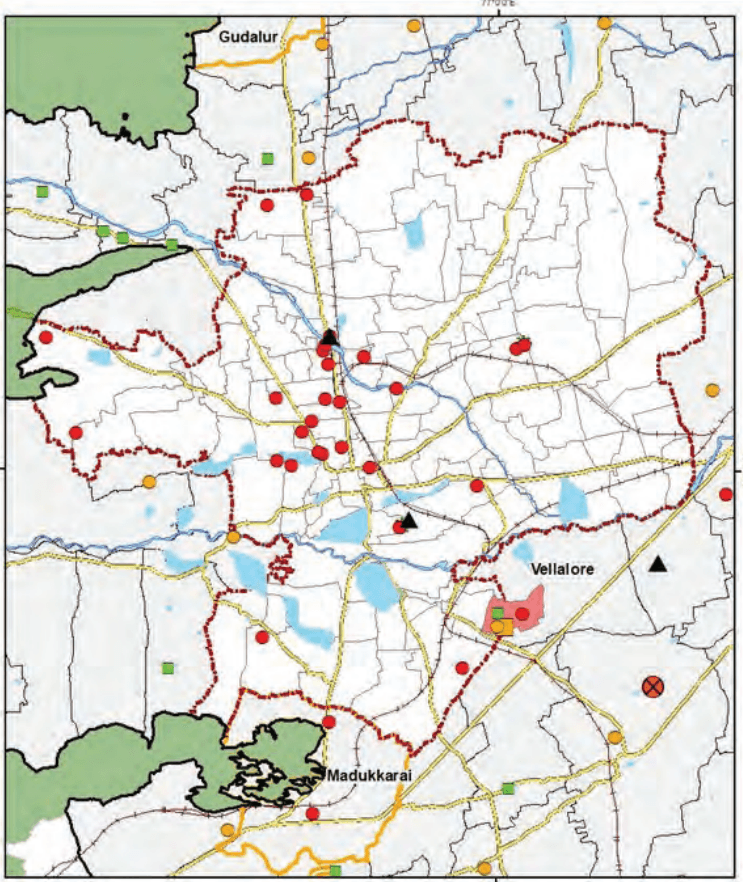
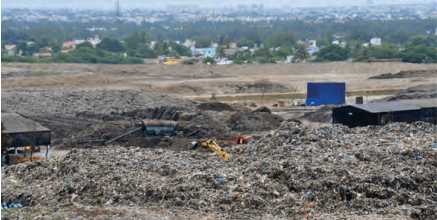
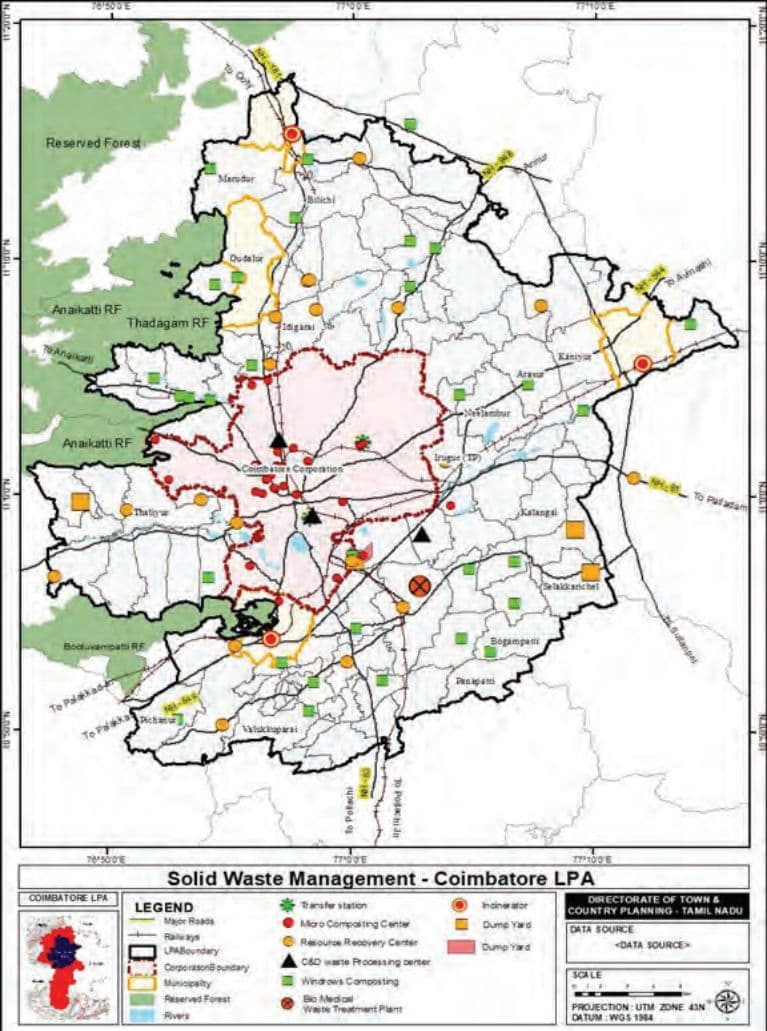
Any residual waste that cannot be processed is transported to the landfill site at Vellalur. About 110 MT of solid waste is dumped daily in the land fill site at Vellalur. The total extent of the Vellore Landfill site is 654.54 acres of which about 12.6 Acres of land is used only for open dumping of the non-treated solid waste collected in the corporation. The Vellalur Dump yard functions as an integrated waste management facility for Coimbatore. In addition to the current open dumping of 110TPD of solid waste, the site is accumulated with the legacy waste for about 134 acres. The Map 9.1 shows the spatial location of the Solid waste facilities in the Municipalities. The following Table 9.3 provides the various facilities in the Vellalur Landfill.
9.1.1.4 Solid Waste Generation in Municipalities
The Coimbatore Local Planning Area (LPA) includes four municipalities: Gudalur, Karamadai, Karumathampatti, and Madukkarai. Together, these municipalities contribute approximately 3.8% of the total solid waste generated within the Coimbatore LPA. Among them, Gudalur Municipality records the highest solid waste generation, producing around 15.85 metric tonnes (MT) per day, which accounts for nearly 30% of the total waste generated by all four municipalities. In contrast, Karumathampatti Municipality generates the least, approximately 11.32 MT per day. Per capita waste generation varies across the municipalities, ranging from 250 grams per person per day in Karumathampatti to 321 grams per person per day in Karamadai Municipality.
Solid waste in the municipalities is collected through door-to-door collection from residential, commercial, industrial areas, as well as from bulk waste generators. The collected waste is then efficiently transported to designated solid waste management facilities. The waste composition in these municipalities shows a higher proportion of organic waste, which makes up approximately 54%, while dry waste contributes around 38%. A detailed breakdown of the waste composition across all municipalities is provided in the table below.
Table 9.5Solid Waste Generation in municipalities
Municipality
Solid Waste Generated per day (MT)
Organic waste
Dry waste (Biodegradable)
Dry Waste (Plastic waste)
Hazardous
Total
Gudalur
7.9
2.25
2
3.7
15.85
Karamadai
7.5
2.76
3.82
0.05
14.13
Karumathampatti
6
2.31
3
0.01
11.32
Madukkarai
7
2.17
2
0.50
11.67
Source: Data collected from Municipalities, 2025
The organic waste collected in the municipalities is treated either through the windrow composting method or at Micro Composting Centres (MCCs). The resulting manure is then distributed free of cost as bio-manure for use in agricultural fields. Dry waste is sorted into recyclable and non-recyclable components. Recyclable materials are processed at dedicated recycling units, while plastic waste is shredded and handed over to authorized plastic waste handlers for repurposing. A Significant portion of the dry waste is also sent to cement factories for co-processing. Hazardous waste is managed separately and disposed of through incineration. The table below outlines the solid waste management facilities available across the municipalities. The Map shows the spatial location of the Solid waste facilities in Coimbatore LPA
9.1.1.5 Solid Waste Generation in Town Panchayat and Village Panchayat
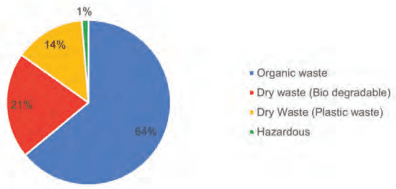
The Coimbatore Local Planning Area (LPA) comprises 21 Town Panchayats, which collectively accommodate approximately 12% of the LPA’s total population. These Town Panchayats generate around 136 metric tonnes of solid waste daily, accounting for about 9.8% of the total solid waste produced within the Coimbatore LPA. The composition of the solid waste generated by these Town Panchayats is depicted in the following figure.
Source: Data collected from Town Panchayats, 2025
Figure 9.4: Composition of Solid Waste in Town Panchayats – Coimbatore LPA
The Town Panchayats within the Coimbatore Local Planning Area generate approximately 136 metric tonnes of solid waste daily. Of this, around 64% (87.17 MT) is organic waste, 35% is dry waste including about 21% non-biodegradable plastic and 1% is hazardous waste. Waste collection is carried out through a door-to-door system, where waste is segregated at source into wet (organic) and dry categories. The organic (wet) waste is processed through the windrow composting method, widely adopted across the Town Panchayats. The resulting bio-manure is distributed free of cost to local farmers as a sustainable agricultural input. Dry waste is transported to the Resource Recovery Park, where recyclable materials are sold at `25 per kilogram. Plastic waste is shredded and handed over to authorized plastic waste handlers for further processing. Unlike Corporations and Municipalities, Town Panchayats do not have Micro Composting Centres (MCCs). The details of solid waste generation and available treatment facilities in Coimbatore LPA’s Town Panchayats are presented below it Table 9.7.
Table 9.7Existing Solid Waste Treatment Facility in Town Panchayats
S. No
Town Panchayat
Solid waste Generated (MT)
Solid Waste Treatment Facilities
Windrow Capacity (MT)
RRC Capacity (MT)
1
Chettipalayam
4.238
3.2
1
2
Dhaliyur
4.307
2.5
1
3
Ettimadai
4.281
2.50
1.00
4
Sarkar Samakulam
7.247
2.70
1.00
5
9.1.1.6 Solid Waste Generation in Village Panchayat
Village Panchayats contribute approximately 7.28% of the total solid waste generated in the region, with an average daily generation of about 101 metric tonnes. Waste collection is carried out through a door-to-door system, with source-level segregation into wet and dry waste. The organic (wet) waste is processed into bio-manure, which is then utilized for agricultural purposes, promoting sustainable farming practices. The dry waste collected from the village panchayat is transferred to the nearby Plastic waste management center. On average about 6.4 MT of waste is recycled per day in Village Panchayat. The Map 9.2 show the solid waste management facilities in Town Panchayat and village Panchayat.
9.1.2Solid waste Management Gap Analysis
9.1.2.1 Existing Gap in Solid Waste Treatment Facilities
The existing gap in the Solid Waste Management facilities is calculated based on the amount of solid waste generated and the existing solid waste treatment facilities available in the corporation, Municipalities, Town Panchayat and Village Panchayat. The following Table 9.8 provides the existing Gap in treating Solid waste generated in Coimbatore LPA
Source: Data collected from Urban Local Bodies, 2025 and DTCP analysis
9.1.2.2 Future Requirement for Solid Waste Treatment Facilities
The Future requirement for the Solid waste Treatment facilities is calculated based on the project Population for the year 2031 and 2041. The per capita solid waste generated is considered based on NEERI standards and a higher value is considered for the future requirements. Based on these projections, the Coimbatore Local Planning Area (LPA) is expected to generate between 1,659 to 1,887 metric tonnes per day (MT/day) of solid waste by 2031, and approximately 2,621 MT/day by 2041.
Projected Solid waste Generation for 2031 (MT/day)
Projected Solid waste Generation for 2041 (MT/day)
Additional Requirement2041
Corporation
2764842
3903784
1382.42
1951.89
966.89
Municipality
236449
305996
118.22
153.00
112.00
Town panchayats
459188
567685
145.87
179.92
78.51
Village panchayats
744476
1047241
239.84
335.27
335.27
Total
4204955
5824706
1886.35
2620.08
1492.68
Source: Data collected from Urban Local Bodies, 2025 and DTCP analysis
9.1.3SWOT Analysis
Swot analysis has been carried out for the Solid Waste Management in Coimbatore LPA to evaluate existing conditions and guide future planning proposals effectively.
Strengths
Integrated Waste Management Facility: Vellalur functions as an integrated solid waste management site, housing composting units, recycling facilities, and proposed biogas plants, supporting centralized waste processing.
Urban Centralization Advantage: The spatial location of the urban core allows for a centralized waste treatment system, which is more efficient than decentralized models.
Established Waste Segregation and Collection System: Coimbatore Corporation has an effective source-level segregation and door-to-door waste collection mechanism.
Advanced Waste Processing Infrastructure: Existing facilities for vermicomposting, micro composting, material recovery, and RDF processing provide a strong foundation for expansion.
Weaknesses
Design Limitations at Vellalur: The current layout of the Vellalur dump yard requires redesign to accommodate sustainable and future-ready operations.
Rural Area Coverage Deficit: Village and Town Panchayats lack adequate waste processing infrastructure, leading to open dumping and environmental risks.
Gaps in Treatment Capacity: An overall shortfall of approximately 207 MT/day in existing treatment capacity indicates under preparedness for current and future waste volumes.
High Proportion of Legacy Waste: Approximately 134 acres at Vellalur are occupied by untreated legacy waste, posing environmental and land use challenges.
Opportunities
Bio-Mining and Land Reclamation: Ongoing biomining initiatives can recover significant land area and reduce the environmental burden of legacy waste.
Cluster-Based Treatment Strategy: Grouping local bodies into clusters for integrated treatment facilities improves resource optimization and management efficiency.
Emerging Technologies: Adoption of biogas plants, bio-methanation, and decentralized composting can enhance sustainability and energy recovery.
Policy and Incentive Framework: Proposals for Zero Waste Policies, incentive-based waste collection, and digital monitoring platforms offer pathways for systemic improvement.
Threats
Rapid Urbanization: With projected waste generation reaching ~2,655 MT/day by 2041, the infrastructure may be overwhelmed without timely upgrades.
Environmental Sensitivity: Areas near reserve forests, HACA villages and ecological zones risk degradation from improper waste management
9.1.4Solid Waste Management Proposal
Coimbatore LPA is estimated to generate about 2,620.08 MT/day which is about 88.6% increase in the existing solid waste generated in the LPA. To ensure the safe and efficient management of Solid waste, it is essential to address both the existing shortfall in treatment capacity and the anticipated future demand. The following are the planned proposals for the Coimbatore Corporation
Bio Mining of Legacy Waste – Phase II :
The Legacy waste present in the Vellalur Dump yard is one of the major hazards for the corporation. Bio mining of the legacy waste is started as part of the Swachh Mission for Coimbatore and phase 1 Bio mining of the legacy waste of 7.52 lakhs MT quantity is completed and recovering around 50 acres of land. In continuation to Phase I, the Phase II program is in progress to treat about 9,92,673 cubic meters of Solid waste and recover 84.62 Acres of land at a cost of Rs. 58.54Cr.
Bio Gas Plant at Vellalur- the Corporation has proposed for a Bio Gas Plant to be set up at Vellalur to treat the organic waste generated in the corporation, the total capacity of the plant is around 250 TPD and at a cost of 69.20 Cr.
In addition to these proposed integrated Solid waste treatment facilities by the Corporation, to meet the anticipated increase in waste generation, as a mitigation strategy, the enhancement of existing treatment facilities is proposed to bridge the current gap, while integrated solid waste treatment facilities are planned to accommodate the anticipated increase in waste generation.
9.1.4.1 Proposal 1 : Enhancement of Solid Waste Treatment Facilities in Corporation
The total solid waste generated within the Coimbatore Corporation amounts to approximately 1100 MT/day, while the existing treatment capacity stands at 985 MT/day.
A processing gap exists, particularly in managing dry biodegradable waste and hazardous waste. Dry biodegradable waste can be effectively handled through Micro Composting Centres (MCCs), while bio-medical waste is directed to the Kovai Bio-Medical Waste Treatment Facility. The Table 9.10 outlines the types of solid waste generated, the current treatment capacities, and the corresponding gaps. It is evident that nearly all waste generated is being processed, with only 96 MT/day of dry biodegradable waste currently being sent to the dump yard. The Corporation presently operates 36 MCC plants. By augmenting their combined capacity to 150 MT/day, this remaining volume of dry biodegradable waste can also be effectively treated, ensuring comprehensive waste management within the Corporation.
Bio Medical Waste Sent to Kovai Bio Medical Waste Treatment Plan
0
Total (MT/day)
1100
985
Additional 19 MT/day
Source: Data collected from Urban Local Bodies, 2025 and DTCP analysis
In addition to addressing the current solid waste management requirements, augmenting the capacity of MCCs from 35 MT/day to 150 MT/day will enhance the overall treatment capacity by approximately 19 MT/day, which can be leveraged to meet future demand.
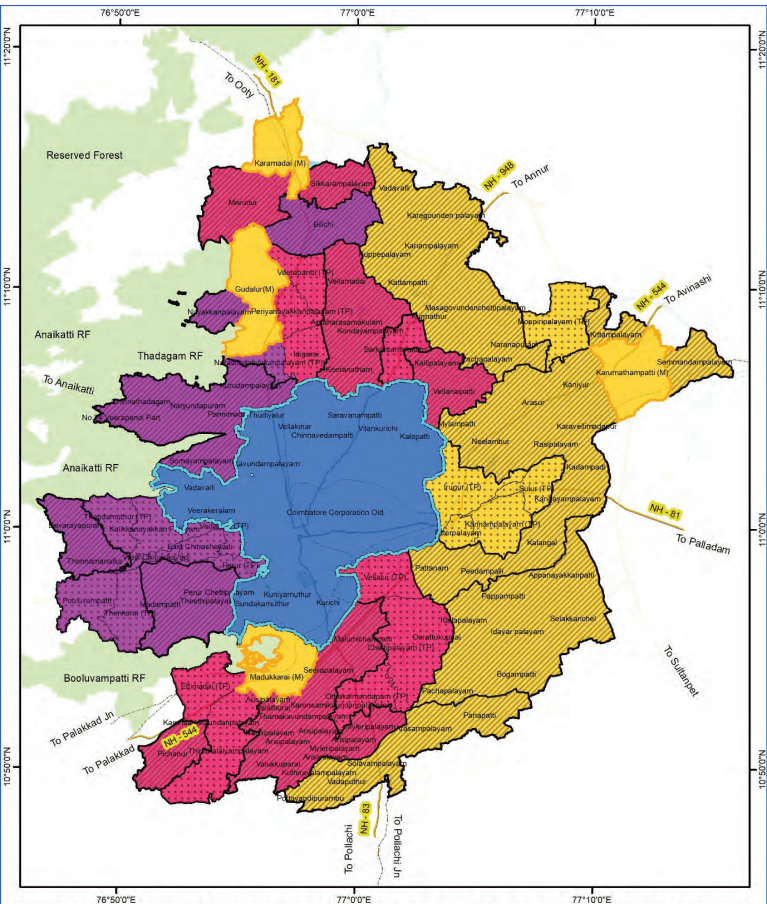
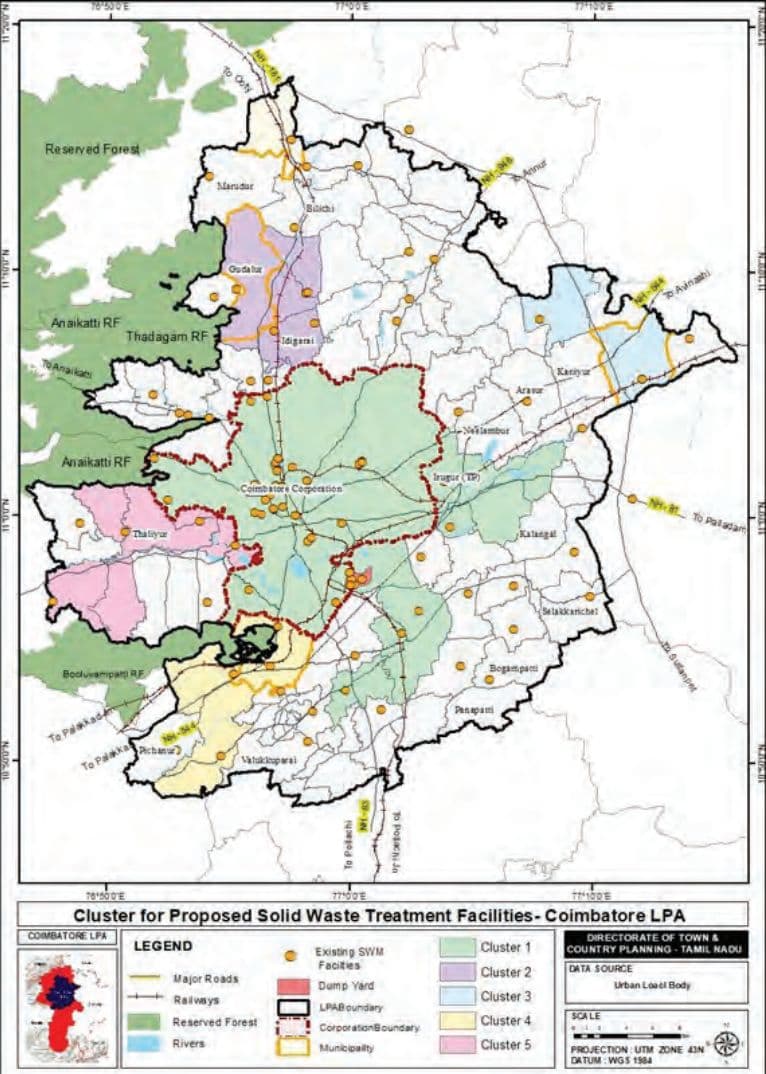
The Coimbatore Local Planning Area (LPA) currently generates approximately 1,390 metric tonnes (MT) of solid waste per day. By 2041, this is projected to increase to 2,655 MT/day, based on the projected population for the year 2041. Around 88% of the future solid waste is anticipated to be generated from the existing urban zones, including the Corporation, Municipalities, and Town Panchayats. A treatment capacity shortfall of about 1,526 MT/day has been identified. Upon analyzing the spatial distribution of these urban areas, it is evident that establishing separate waste treatment facilities for each administrative body is not feasible. Instead, an integrated Solid Waste Management system is proposed, taking into account the total waste generated, the land requirements for treatment, and the necessary resources. The Corporation, Municipalities, and Town Panchayats are grouped into clusters, and dedicated treatment facilities are proposed accordingly for the Coimbatore LPA. The following are the various clusters considered for providing Solid Waste Treatment Facilities as mentioned in Table 9.11
Table 9.11Identified Clusters for Integrated Solid Waste Treatment Facility
Clusters
Areas included
Cluster I
Coimbatore Corporation
Cluster I
Chettipalayam (TP)
Cluster I
Vellalur (TP)
Cluster I
Othakalmandapam(TP)
Cluster I
Irugur(TP)
Cluster I
Sulur (TP)
Cluster I
Otterpalayama (TP)
Cluster I
Kannampalayam (TP)
Clusters
Areas included
Cluster II
Gudalur - Municipality
Cluster II
Idigarai (TP)
Cluster II
Narasimmanayakkanpalayam (TP)
Cluster II
Periyanayakkanpalayaam (TP)
Cluster II
Veerapandi (TP)
Cluster III
Karumathampatti (M)
Cluster III
Mooripalayam(TP)
Cluster IV
Madukkarai (M)
Cluster IV
Ettimadai (TP)
Cluster IV
Thirumalaiyampalayam (TP)
Cluster V
Dhaliyur (TP)
Cluster V
Vedapatti(TP)
Proposal 2E : Combined Solid Waste Treatment Centre– Cluster 5
Cluster 5 comprises Town Panchayats located on the western side of the Local Planning Area (LPA), in close proximity to reserve forests, hilly terrains, and HACA villages. Given the ecological sensitivity of the region, effective collection and disposal of solid waste are essential to minimize environmental impact. In view of this, a combined solid waste treatment facility is proposed for Cluster 5. The table below outlines the details of the proposed facility.
Table 9.16Details of Combined Solid Waste Treatment Center - Cluster 5
Content
Quantity
Total Solid Waste Estimated to be generated in 2041 for Cluster 5 (MT/day)
28.14
Capacity of Existing Treatment Facility in Cluster 5
21.80
Total future Demand in Cluster 5 - 2041
6.34
Total Compostable Solid Waste (MT)
4.89
Total Dry Waste for Resource Recovery (MT)
1.45
Proposals
Capacity of Micro Composting Center (MT)
5
Capacity of Resource Recovery Unit (MT)
2
Total Capacity of Proposed Treatment Facility
7
Surplus facility available after treating the total projected solid waste for 2041
Organic waste treatment
0.11
Dry waste treatment
0.55
Area Required
Compost yard (Ha)
0.018
Resource Recovery Unit (Ha)
0.05
Total area required (Ha)
0.068
Proposal 3: Localised Treatment Facility
Proposal 3A: Localized Treatment Facility in Karamadai Municipality
Karmadai Municipality is spatially isolated than the other Municipalities in Coimbatore LPA. The Municipality is estimated to generate about 25.40MT of waste in 2041 and the existing capacity is about 15MT, and in order to treat the total demand of 10.39 Mt of solid waste a compost yard of 10 MT capacity and a Resource recovery unit of 10 Mt of waste is proposed at Karamadai Municipality. The following table provides the details of the proposed facility
Table 9.17Details of Localised Treatment Facility – Karamadai Municipality
Content
Quantity
Total Solid Waste Estimated to be generated in 2041 for Karamadi
25.40
Capacity of Existing Treatment Facility
15
Total future Demand - 2041
10.40
Total Compostable Solid Waste (MT)
6.55
Total Dry Waste for Resource Recovery (MT)
3.85
Proposals
Capacity of Compost Yard (MT)
10
Capacity of Resource Recovery Unit (MT)
10
Total Capacity of Proposed Treatment Facility
20
Surplus facility available after treating the total projected solid waste for 2041
Organic waste treatment
3.45
Dry waste treatment
6.15
Area Required
Compost yard (Ha)
0.12
Resource Recovery Unit (Ha)
0.25
Total area required (Ha)
0.37
Map 9.1: Location of Existing Solid Waste Treatment facility in Coimbatore Corporation
Solid Waste Management - Coimbatore Corporation
Table 9.3Integrated Waste Management at Vellalur Landfill
Category
Details
Total area of Vellalur Dump yard
654 acres
Land Used for Waste Management
279.7 acres
Fresh Waste Dumped Area
12.6 acres
Bio-mining Processing Plant
35 acres
Vermicompost Processing Plant
15 acres
MRF & Chicken Waste Processing Plant
0.85 acres
Land area with legacy waste
134 acres
Accumulated Legacy Waste
9,92,673m3
Source: Data collected from Coimbatore City Municipal Corporation, 2025
Bio-mining of legacy waste is currently underway at the Vellalur landfill site as part of the Swachh Bharat Mission. Under Phase I of the project, approximately 7.52 lakh metric tonnes (MT) of legacy waste have been processed, leading to the recovery of around 50 acres of land. Phase II of the bio-mining project is presently in progress. This phase aims to process approximately 9,92,673 cubic meters—or about 7,94,138 MT—of old legacy waste. Upon completion, it is expected to reclaim an additional 84.62 acres of land. The total cost of Phase II is estimated at 58.54 crore, with a project duration of 24 months.
Figure 9.3: Vellalur Land fill – Coimbatore Corporation
Targets 84.6 acres, processing 7,94,138 MT of legacy waste by swach Bharat scheme
Total reclaimed land from Bio Mining
134 acres
Existing Lagoon Area
15 acres
Fresh Waste Dumping Area
12.6 acres
Available Free Land
176.85 acres
Bio-CNG Plant
Proposed 250TPD capacity to process Organic waste generated in Corporation at the cost of Rs. 69.20 crores
Source: Data collected from Coimbatore City Municipal Corporation, 2025
Table 9.6Existing Solid Waste Treatment Facility in Municipalities
Municipality
Composting Method
Processing Capacity (MT)
Total Capacity (MT)
Gudalur
Windrow Method
2
2
Madukkarai
Micro Composting Plant
5
9
Micro Composting Plant
3
Incinerator
1
Karumathampatti
Micro Composting Center
10
17
Resource Recovery Park
5
Incinerator
2
15
Karamadai
Micro compositing Center
8
MRF
5
Incinerator
2
Source: Data collected from Municipalities, 2025
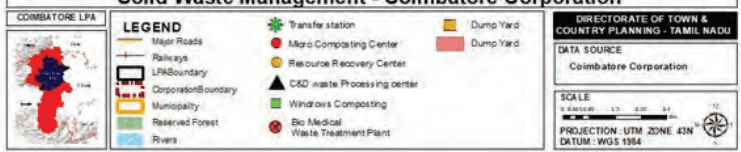
Map 9.2: Location of Existing Solid Waste Treatment Facility in Coimbatore LPA
Idigarai
5.666
2.50
1.00
6
Narasimmanayakkanpalayam
9.425
6.20
1.00
7
Periyanayakkanpalayam
9.744
7.00
1.00
8
Veerapandi No. 4
8.735
5.00
1.00
9
Vedapatti
4.398
3.50
1.00
10
Thondamuthur
4.478
2.80
1.00
11
Pooluvampatti
4.557
3.00
1.00
12
Thenkarai
2.305
2.00
1.00
13
Perur
2.477
2.00
1.00
14
Vellalur
11.972
2.00
-
15
Thirumalaiyampalayam
4.086
3.00
1.00
16
Othakalmandapam
5.433
2.80
1.00
17
Irugur
11.515
7.40
1.00
18
Sulur
11.061
7.00
3.62
19
Otterpalayam / pallapalayam
6.916
3.60
1.00
20
Kannampalayam
8.597
4.70
3.29
21
Mooppiripalayam
4.766
3.10
1.00
Total
136.204
76.5
24.391
Source: Data collected from Town Panchayats, 2025
Cluster V
Tondamuthur (TP)
Cluster V
Pooluvampatti (TP)
Cluster V
Thenkarai (TP)
Cluster V
Perur(TP)
Five major integrated solid waste treatment facilities are proposed to be established within the identified clusters to ensure a comprehensive and efficient Solid Waste Management system. In 2041, the Village Panchayats within the Coimbatore LPA are estimated to generate around 335.27 MT of solid waste. Currently, there are no treatment facilities in these areas. Due to the relatively isolated locations of the Village Panchayats, setting up an integrated treatment system is not feasible. Instead, individual smallscale solid waste treatment units are proposed for each Village Panchayat, considering the lower volume of waste generated and the high transportation costs associated with transferring waste to centralized facilities. The map 10.9 shows the Clusters considered for proposing the integrated Solid waste Treatment facilities in Coimbatore LPA