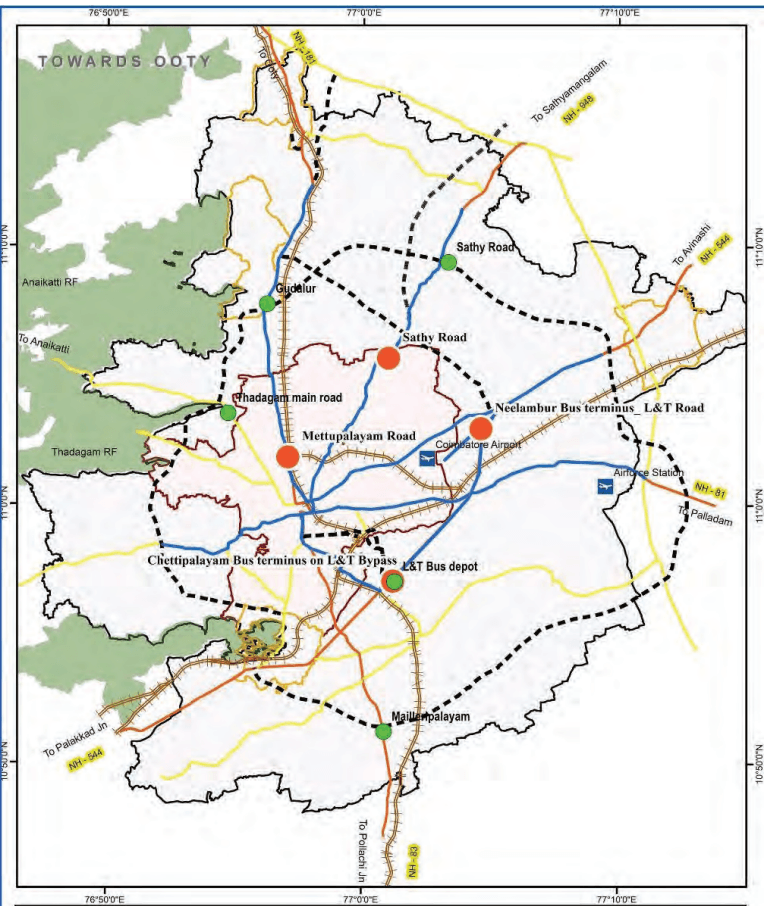
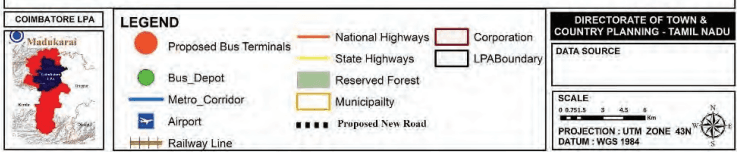
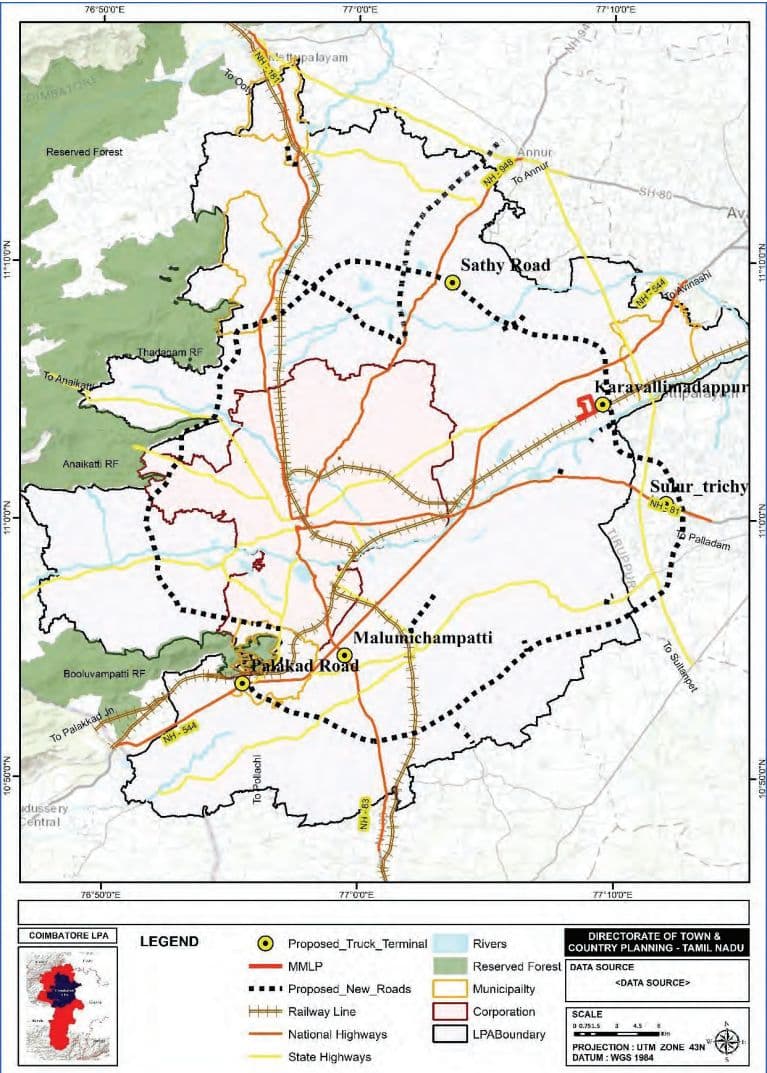
Currently there are 12 depots which serve as operational hubs for the existing bus service. The existing depots are located in the corporation area. By the year 2041, the number of depots will need to increase to support the expanded fleet and services. An additional 5 depots are proposed strategically located considering land availability, to reduce idle running time and improve operational efficiency. Apart from the 5 locations identified, the two proposed bus terminals on L&T bypass road will have depot facilities that will have the capacity to accommodate both town and mofussil buses.
Table 7.19Proposed Bus Depot.
S. No
Proposed Bus Depot Locations
Village
Area (acres)
Phase
1
Sathy Road on proposed Outer Ring Road
Kunnathur, Masagovund-enchettipalayam
10
Phase -1
2
Thadagam Main Road
Somayampalayam
10
Phase -1
3
Chettipalayam along L&T Bypass
Chettipalayam
15
Phase -1
4
Mailleripalayam on proposed Outer Ring Road
Mailleripalayam
5
Phase -2
5
Therukkupalayam on proposed Outer Ring Road
Gudalur
5
Phase -2
Map 7.8: Proposed Bus Terminals and Depots
7.7.3.6Improvement of Existing Railway Stations
Coimbatore serves as a crucial rail transit hub, facilitating intercity and suburban mobility. Coimbatore Junction, the primary railway terminal, experiences significant passenger demand, highlighting the need for infrastructure upgrades and improved accessibility. The other major railway stations are Coimbatore North Station, Podanur Station, Irugur Station for intracity passenger movement.
As per primary survey analysis, 37.3% of users rely on public transport and 18% on intermediate public transport for station access, the rail mode share remains critically low at 0.9%, highlighting gaps in accessibility and limited integration with other transport networks. Enhancing railway station infrastructure and accessibility is essential to decongest the city core.
Passenger Load Redistribution:
Upgrade Irugur, Singanallur, Peelamedu, and Podanur stations to accommodate long-distance trains, reducing dependency on Coimbatore Junction.
Enhance infrastructure at these stations to improve passenger convenience and decongest the city core.
Infrastructure and Facility Enhancements:
Modernize stations with waiting areas, drinking water, sanitation, and security provisions such as CCTV surveillance.
• Improve station illumination and pedestrian safety measures.
Accessibility and Last-Mile Connectivity:
• Strengthen Road infrastructure leading to railway stations by ensuring wider access roads, dedicated IPT bays, and improved public transport connectivity.
Restrict on-street parking near station entrances to streamline vehicular movement.
Parking and Pedestrian Infrastructure:
Implement structured parking solutions to reduce traffic congestion at station access points.
Construct Foot Over Bridges (FOBs) to facilitate safe pedestrian movement across platforms.
Table 7.20Improvement of Existing Railway Station and Phasing
S. No
Improvement of Existing Railway Stations
Phase
1
Coimbatore North Station
Phase-1
2
Podanur Railway Station
3
Peelamedu Railway Station
4
Singanallur Railway Station
5
Irugur Railway Station
6
Madukkarai Railway Station
Phase-2
7
Periyanaickenpalayam Railway Station
8
Thudiyalur Railway Station
Phase-3
9
Sulur Railway Station
10
Narasimhnaickenpalayam Railway Station
7.7.3.7Proposal of Commuter Rail System
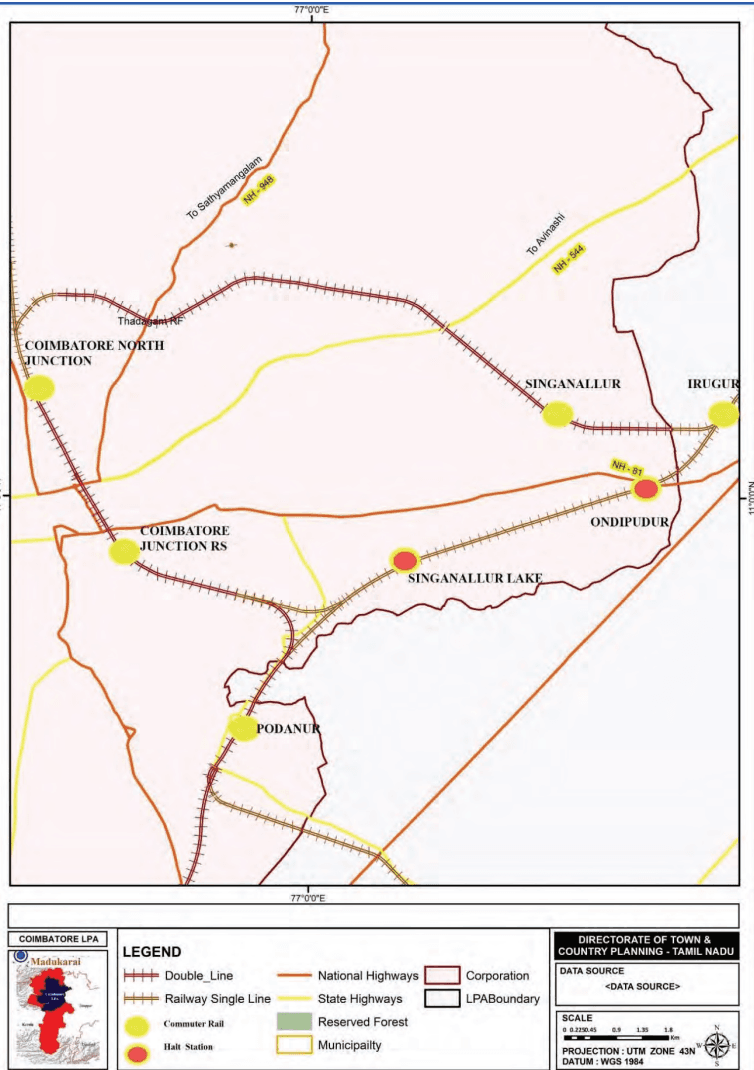
Significant percentage of people commute between Coimbatore and nearby towns such as Mettupalayam, Pollachi, Irugur and other outskirts areas. Most of these commuters travel by road i.e. by buses, para transit modes and their own vehicles. Although Coimbatore is connected with Mettupalayam, Pollachi, Irugur and other outskirts areas by regional rail system, but there are no regular commuter rail services. Considering the future population growth and its traffic interaction with Coimbatore, it is important to augment the rail network by connecting missing link and run suburban services for the frequent commuters. However, the feasibility of using the existing tracks for running commuter rail system needs to be validated further.
It is proposed to double existing rail lines (Irugur–Podanur, Coimbatore North–Mettuplayam, Podanur–Pollachi section) with automatic signalling. include development of two halt stations between Irugur to Podanur section.
Table 7.21Upgradation of rail lines and Phasing
S. No
Upgradation of rail lines for commuter rail services
Quantity
Phase
1
Doubling of Irugur-Podanur Line
8.6km
Phase-1
2
Addition of missing link from Coimbatore Junction towards Irugur
1.2km
3
Automatic signalling for ring section of Coimbatore Railway line (Coimbatore junction-Coimbatore North-Peelamedu-Irugur-Podanur-Coimbatore-Junction)
32.6km
4
Halt stations at Singanallur Lake and Ondipudur
2 nos.
5
Doubling of Coimbatore North-Mettupalayam Line (within LPA)
30.3km
Phase-2
6
Doubling of Podanur-Pollachi line (within LPA)
19.1km
7
Automatic signalling for other rail lines in LPA
96km
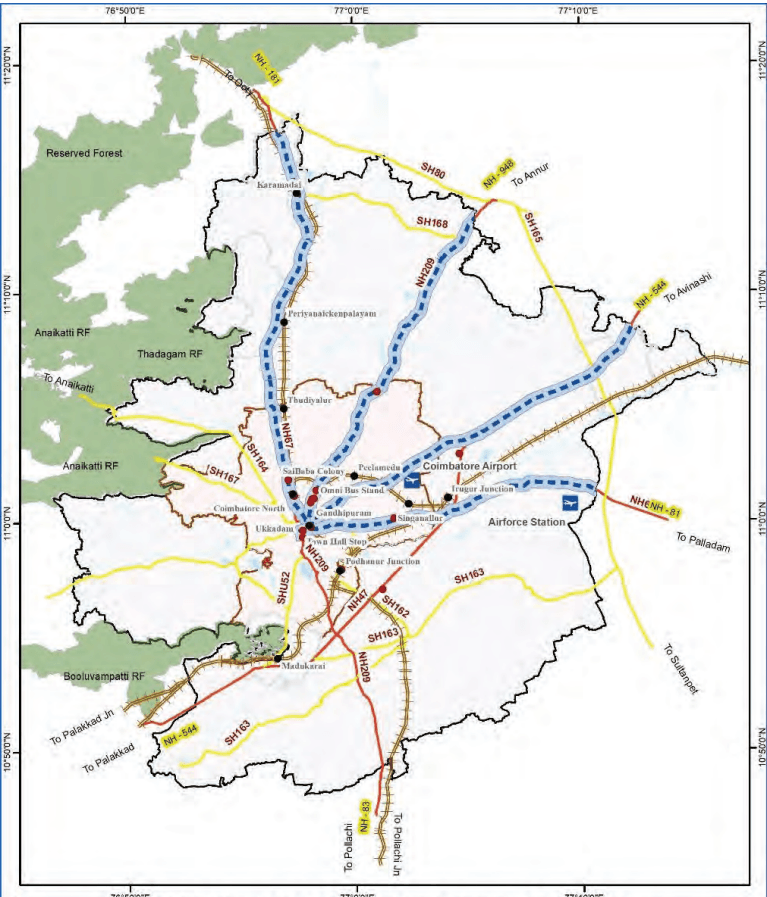
Map 7.9: Commuter Rail System
4Upgradation of Existing Bus Terminals
Town buses at existing terminals at Thudiyalur, Mettupalayam Road and Gandhipuram will continue catering to their respective regions, ensuring minimal disruption to passengers. These Bus Terminals will continue serves as a key transit hub, connecting Coimbatore with various regions and is proposed to be upgraded with infrastructure enhancements as below.
Reorganized bus bays, and designated pedestrian zones to ensure smooth operations.
IPT (Intermediate Public Transport), Feeder bus services and last-mile connectivity solutions will be implemented to support passenger movement from terminals to the city centre.
• Widened footpaths, safe crossings, barrier-free access, and well-lit waiting areas for improved safety and accessibility.
Enhancements within the existing footprint, exploring multilevel structures for parking and passenger facilities.
Adoption of solar lighting, rainwater harvesting, and waste management to enhance environmental sustainability.
Additionally, existing omni bus terminal facilities at Gandhipuram are proposed to be improved to cater to the needs of omnibus operators and passengers until the operations are shifted to the new proposed terminals.
7.7.3.8Development of Regional rail lines
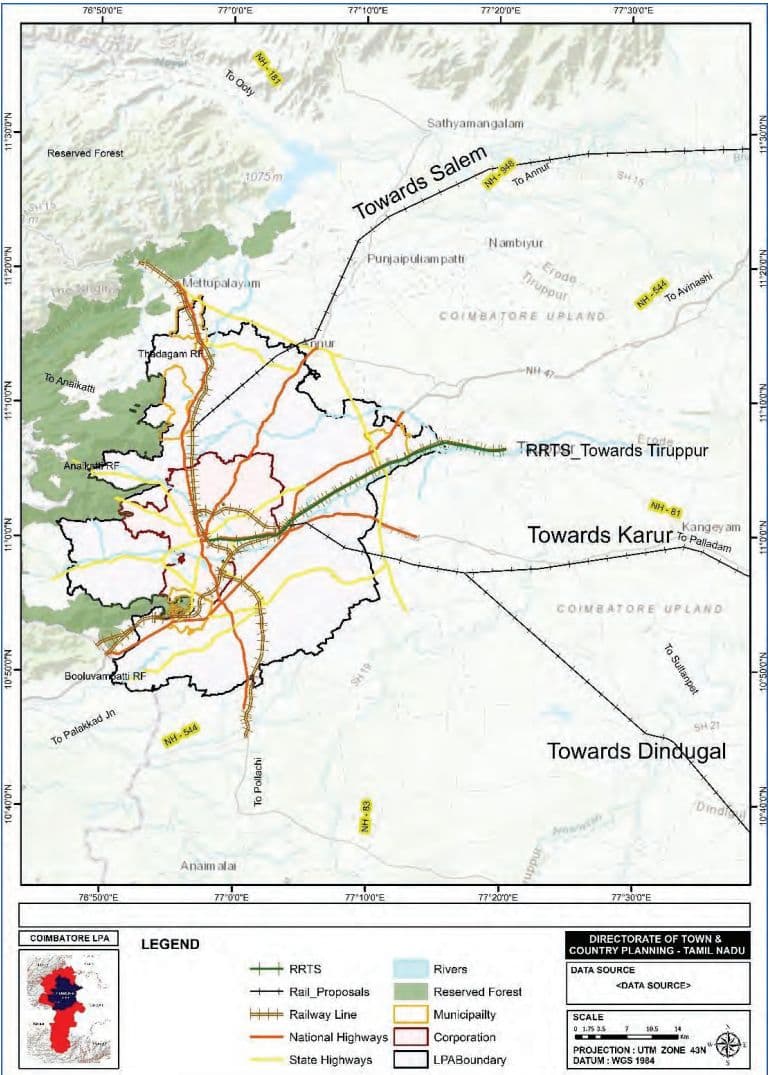
At present, there is a high amount of interaction and development in the belt between Coimbatore-Tiruppur-Erode-Salem which benefits from strong highway and railway connectivity. For more balanced regional growth, and better connectivity to surrounding towns, it is proposed to develop three new railway lines as shown in Map 7.10.
These proposed rail lines will also help decongest the heavily used Coimbatore-Salem rail line by providing alternative routes to different regions of Tamil Nadu.
A Regional Rapid Transit System (RRTS) is also proposed to provide high-quality semi-high-speed connectivity in the region connecting Coimbatore to Salem via Tiruppur and Erode. The feasibility study for the RRTS is being undertaken by Chennai Metro Rail Limited (CMRL).
Map 7.10: Proposed Regional Rail Connectivity
7.7.5Traffic Demand Management (TDM)
TDM is a sustainable strategy that manages travel demand by influencing travel behavior which promotes modal shifts, flexible travel times, and reduced trip lengths to ease congestion, lower emissions, and improve urban mobility.
In core areas of the Coimbatore Corporation area, road widths are limited and development is dense, necessitating better management of travel demand and traffic.
7.7.5.1 Pricing and Incentives
In the first phase, it is proposed to implement parking management in priority NMT clusters (Level 1), followed by parking management in other clusters. Area-level parking management plans are recommended to be prepared to ensure proper design of on-street parking, pricing of onstreet parking, and enforcement.
Table 7.25TDM Measures
S. No
TDM Measure
Phasing
1
Parking Management (priced parking) through area-level parking plans in priority 1 and 2 NMT clusters
Phase 1
2
Parking Management (priced parking) in priority 3 and 4 NMT clusters
Phase 2
7.7.5.2 Infrastructure and Road Space Allocation
The upgradation of NMT infrastructure as part of the NMT improvement plan and management of on-street parking is aimed to reallocate road space from cars to pedestrians, cyclists, and transit users which will improve safety and support active mobility. This will enable a greater mode shift from private to public and non-motorised transport modes.
Further, in congested core city areas of Town Hall, Ukkadam, Gandhipuram and other priority NMT clusters, it is recommended to explore the use of one-way circulations where feasible to improve traffic flow.
7.7.5.3 Organizational Initiatives
Workplace travel plans, to use sustainable modes through carpooling, transit benefits, and cycling programs, reducing car dependency in high-density zones. Trip
reduction strategies like remote work and ride pooling reduce total vehicle trips.
7.7.5.4 Technological Measures
Technologies like Intelligent Transport Systems (ITS) and Smart Signalization enhance real-time traffic management. Traffic Management Centres (TMCs) monitor conditions, detect incidents, and coordinate responses. ITS features include ATMS, ATIS, ETC, and AID, helping optimize traffic flow, improve safety, and support data-driven planning. Smart signals, proposed for Coimbatore’s key junctions, along Corridor level development plans adapt based on realtime traffic volumes to reduce delays.
7.7.4NMT and Pedestrian Infrastructure Development
The NMT Infrastructure Improvement Plan proposes continuous footpaths on both sides of major roads, dedicated cycle lanes wherever possible, and pedestrian priority at crossings and public spaces. These measures aim to enhance safety, accessibility, and promote walking and cycling as sustainable modes of transport in Coimbatore.
The vision for the NMT plan is as follows:
Road network with connected and dedicated pedestrian pathways, up to 100% of arterial and sub-arterial roads in LPA and bus route roads
Increased accessibility to the public transportation network
Road upgrades (road markings & signages, encroachment free, barrier free & inclusive design etc.) on all arterial/ sub-arterial roads as per IRC standards.
7.7.4.1 Approach for NMT Proposals
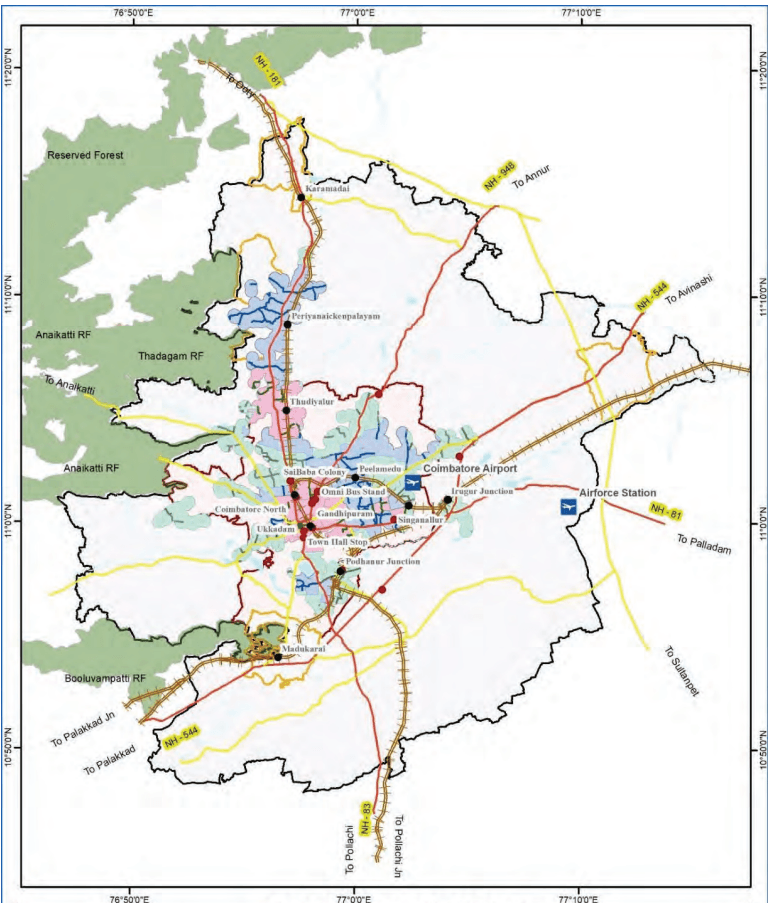
A comprehensive Non-Motorised Transport (NMT) plan has been developed to identify and establish clusters in LPA that will enhance the provision of continuous footpaths, supporting seamless connectivity and complementing the existing public transport network and overall accessibility and network improvements.
This approach covers multiple parameters to ensure optimal pedestrian accessibility and safety. The factors considered include areas with high footfall at existing bus stops, proximity to schools and educational institutions and hospitals, accident data analysis, and the availability and condition of Footpaths. By focusing on these parameters NMT clusters have been identified for the phase-wise improvement of NMT.
Schools and educational institutions were a critical focus, as these are significant generators of pedestrian traffic. A 500-meter buffer around major dense schools was established to ensure safe and continuous footpaths, thereby encouraging walking among students. Heat maps of accident locations and fatalities, were analysed to identify the high-risk areas and these were clubbed as clusters.
The plan prioritizes first- and last-mile connectivity to public transport, linking NMT corridors to key destinations such as schools, markets, offices, and bus terminals. A continuous, gap-free network is essential, along with clear wayfinding systems to improve navigation for both pedestrians and cyclists. Enforcement will be key, with measures to prevent encroachments on NMT lanes and footpaths, rail guards on medians to deter jaywalking, and pedestrian crossings every 1 km on arterial roads.
7.7.4.2 Key NMT Proposals
Continuous footpaths are proposed to be developed along all NH, SH and MDR, covering a network length of 909 km in the local planning area. A total of 127 clusters have been identified for NMT improvement covering a major road network length of 471km within the clusters. As the first priority, it is recommended that footpath network shall be developed on all roads that are categorised as NH and SH in the area. The footpaths shall be designed as per street design guidelines/IRC standards.
Table 7.23Network Length for NMT Improvement
SN
Category
Length (km)
Phasing
1
Arterial Roads (NH, SH)
150.4
Phase 1
2
Other Roads (As part of clusters)
71.5
3
Arterial Roads (NH, SH)
267.9
Phase 2
4
Other Roads (As part of clusters)
190.3
5
Arterial Roads (NH, SH)
20.3
Phase 3
6
Other Roads (As part of clusters)
209
Total Network
909.4
Additionally, cycle lanes are proposed to be included where feasible based on right-of-way availability. The cycle lanes shall be planned to form a network of cycling infrastructure, providing safe conditions for cyclists. Cycle lanes should be planned and designed in accordance with IRC11:2015.
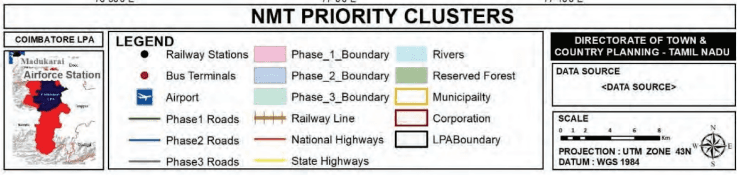
Map 7.11: Map showing NMT cluster
7.7.4.3 Pedestrian and Cycling Infrastructure Components
Footpaths will be developed continuously on both sides of major roads, with a minimum width of 1.8 m (1.5 m on narrow roads), raised with 150 mm unmountable kerbs, and aligned with land availability along mobility corridors and commercial zones. Zebra crossings will be provided at all at-grade junctions, and tabletop crossings will be used where continuity is broken. Footpaths will have clearly defined walking zones, furniture zones (for benches, bins, lights, etc.), and frontage zones near buildings. Materials will be non-slip and even, ensuring a uniform gradient.
Pedestrian crossings will include raised tabletop designs, zebra markings, and refuge islands at wide roads to improve visibility and safety. For safety and accessibility, all curbs will include ramps, tactile paving for the visually impaired, audible signals, and adequate lighting. Public comfort will be enhanced with shade-providing trees, seating areas, and basic amenities like drinking water and toilets where possible.
Cycle Tracks will be segregated and safe, with dedicated space and priority at intersections. They will be integrated with bicycle-sharing systems and secure parking to promote daily cycling. Cycle tracks will be segregated with curbs, bollards, or green buffers, and designed with minimum widths of 2 m (one-way) and 3 m (two-way). They will be given priority at junctions and integrated into key commuting routes. Bike parking will be located at transit points, schools, parks, and commercial areas, with provisions for covered and secure stands. Shared NMT corridors will be encouraged in low-speed (<30 km/h) streets using signage and traffic calming.
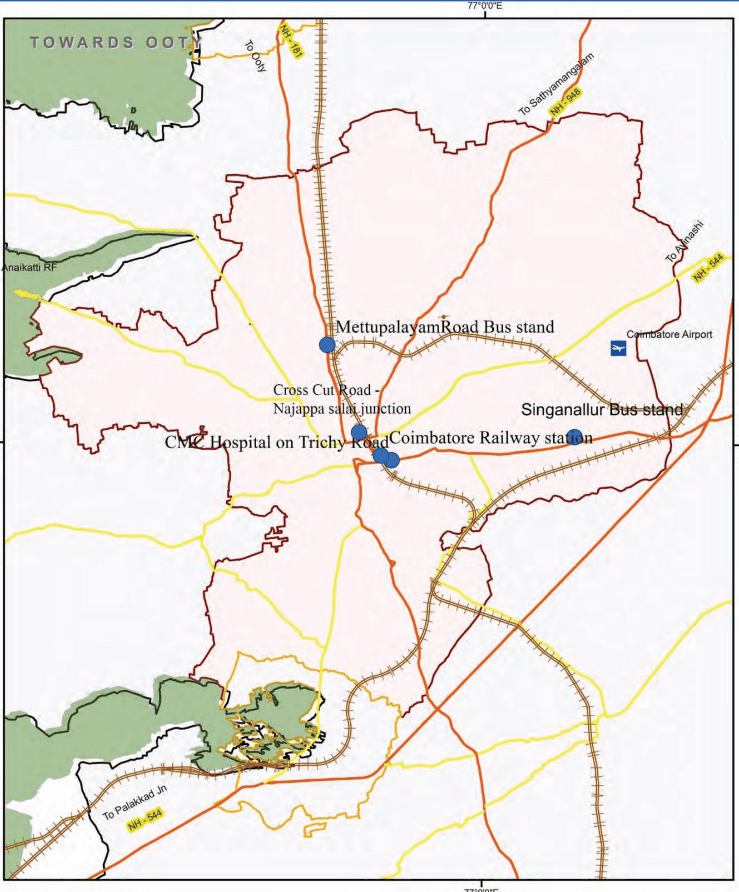
7.7.4.4 Proposed Pedestrian Grade-Separators
It has been observed that at few locations conflicts between pedestrians and vehicles are very frequent, due to heavy pedestrian and vehicular movement in the busy street of the city. There is a need for effective pedestrian crossing facilities at selected locations to ensure safety of pedestrians. The proposed Pedestrian Crossing Facilities in the study area is presented in Table 7.24.
Table 7.24Proposed Pedestrian Grade-Separators
SN
Location
Phasing
1
Cross-Cut Road - Dr. Nanjappa Road junction
Phase I
2
CMC Hospital on Trichy Road
3
Coimbatore Railway Station
4
Singanallur Bus Stand (Trichy Road)
5
Mettupalayam Road Bus Stand (Near Sai Baba colony)
Map 7.12: Proposed Pedestrian Grade Separators
7.7.6Parking Policy and Infrastructure Development
Parking in Coimbatore is strategically approached as a demand management tool rather than a default right, recognizing that unregulated parking contributes to congestion, inefficient land use, and obstruction of Non-Motorized Transport (NMT) infrastructure. On-street parking is permitted only in designated and marked areas, with strict prohibition on parking over footpaths and cycle tracks. Parallel parking is preferred due to its minimal impact on pedestrian movement, while angled or perpendicular parking is allowed only where space permits without affecting NMT. Smart meters and digital systems are encouraged for real-time monitoring and pricing. Off-street parking is promoted through multilevel, underground, and shared facilities, discouraging surface parking in dense zones. New developments must follow parking maximums to avoid oversupply and encourage public transit use.
Policy measures include progressive pricing (higher fees for longer durations or peak hours), adoption of smart parking systems (sensors, apps, cameras), and shared parking to optimize space in mixed-use developments. Revenue from parking is intended to be reinvested in NMT and transit improvements, with strict enforcement against illegal parking. Area level plans will be prepared for managing on street parking.
7.7.6.1 Proposed Multi-Level Parking Facilities
(Radio Frequency Identification (RFID) - based multi-level parking systems are widely adopted in smart cities,
particularly at transit and commercial hubs, to regulate access and optimize parking allocation. The system minimizes congestion, enhances revenue through dynamic pricing based on demand, and reinforces regulations via integrated ticketing.
Table 7.26Proposed Multi-Level Parking Facilities
SN
Locations
Phase 1
1
Cross Cut Road near Lakshmi Complex (Gandhipuram)
2
Town Hall, Opposite to Konniyamman Temple
3
Raja Street / Big Bazar Street - Thiyagi Kumaran Market
4
Old Passport Office premise opposite to Thandumariamman Temple-1
5
Race Course
6
KG Cinemas
7
Diwan Bahadur Road
Phase 2
5
Gandhipuram bus stand
6
Ukkadam bus stand
7
Ramanathapuram
7.7.7Freight and Logistics Planning
Freight traffic within Coimbatore is restricted in the Central Business District (CBD), particularly along key arterial roads. Currently, goods movement is concentrated in locations such as Malumichampatty, Pooluvampatti, Karumathampatti, Kovilpalayam, Narasimhanaickenpalayam, Madukkarai, Sulur, and Sangampalayam. However, the lack of dedicated freight infrastructure has led to on-road parking of goods vehicles, creating safety hazards and traffic congestion.
7.7.7.1 Proposed Truck Terminals and Logistic Hubs
To enhance goods movement and logistics efficiency within the study area, five freight terminals are proposed on
the city outskirts, strategically positioned along key radial corridors and proposed ring road. These terminals aim to streamline freight operations, reduce congestion within the urban core, and improve overall supply chain efficiency. Currently, there is a lack of planned and designated Multimodal Logistics Hubs or Freight Hubs within or outside the Coimbatore study area.
Table 7.27Proposed Truck Terminal Locations and Phasing
S. No
Proposed Truck Terminal
Village
Area (acres)
Phase
1
Sulur on Trichy Rd
Kannampalayam
5.6
Phase 1
2
Palakkad Road
Madukkarai (TP)
3
Near proposed MMLP in Kaniyur
Karavali-madapur
4
Sathy road
Masakavundanchettipalayam
5.85
Phase 2
5
Malumichampatti
Malumichampatti
11.9
To enhance freight efficiency and urban mobility, the following strategic measures are proposed:
Development of freight terminals near ring roads to facilitate organized goods movement.
Promotion of small and medium-sized commercial vehicles with modern emission controls in central urban areas.
Tamil Nadu Logistics Policy and Integrated Logistics Plan – 2023 proposals have been identified and studied for understanding the supply and planning for efficient freight management in the study area. A 226-acre Multimodal Logistics Park (MMLP) is to be set up near Kaniyur, Karavalimadapur, covering the infrastructure for rail and road freight and offering warehousing, private freight terminals, distribution, and consolidation. This park will serve as a hub for freight aggregation, distribution, storage, and valueadded services like packaging, labelling, and customs clearance. However, it is recommended that a minimum of 500 acres of land shall be acquired for the development of MMLP so that cargo handling operations of Peelamedu (which is currently handling 1.03 MT annually) can also be shifted to the proposed MMLP locations to decongest the freight movement in the core city area.
Map 7.13: Proposed Truck Terminals and MMLP
7.8Sustainable And Green Mobility Initiatives
7.8.1 Electric Vehicles
Vehicle Classification by Fuel type data is listed as follows from the Vaahan Parivan:
Table 7.28Vehicle Classification based of Fuel Type
S. No
Fuel
Total Vehicle Class
2025
2024
2023
2022
2021
1
CNG ONLY
411
1413
1186
548
76
2
Petrol/Diesel
27565
89256
90769
89834
74787
3
Electric
3036
9470
7032
3943
1133
4
Electric Hybrid
744
2127
1966
1217
987
Source: Vaahan Parivan.
Coimbatore is experiencing a surge in electric vehicle (EV) registrations—from 1133 (BOV and pure EV) in 2020 to 9470 (BOV and pure EV) in 2024. This shift signals increasing market acceptance and aligns with global efforts to decarbonize transport. This trend necessitates integrating a robust EV strategy into the city’s Master Plan.
7.8.1.1 Electrification Focus.
Electrifying public transport is critical, especially with buses accounting for 21% of the city’s modal share. Similarly, two-wheelers dominate with a 37% modal share, offering immense potential for electric adoption. Emphasis should be placed on converting ride-sharing services, last-mile connectivity modes, and delivery fleets to electric or hybrid alternatives, thereby reducing emissions and enhancing transport efficiency.
7.8.1.2 Infrastructure Development
To support EV growth, Coimbatore must rapidly expand its charging infrastructure. This includes fastcharging stations along arterial roads, battery-swapping stations in industrial and high-usage zones, and charging points in residential areas. Smart grid integration is essential to manage energy demand and avoid grid overload. Publicprivate partnerships (PPPs) should be leveraged to ensure scalable, cost-effective deployment of these facilities.
7.8.1.3 Role of Hybrids
Hybrid vehicles—Petrol/Hybrid, CNG, and Ethanol blends—serve as a practical transition while EV infrastructure matures. The Master Plan should offer tax incentives for hybrid vehicles and expand alternative fuel refueling stations. Fleet operators, particularly those in ride-hailing and auto-rickshaw segments (4.2% modal share), should be encouraged to transition to hybrid and electric models.
7.8.1.4 Policy Framework
Effective policy support is key to accelerating EV adoption. This includes subsidies and tax breaks for EV buyers and fleet operators, scrappage incentives for diesel vehicles, and mandatory EV use in sectors like delivery, government fleets, and public transport. Zoning and building codes should require EV-ready infrastructure in new developments, including residential complexes and commercial centers.
7.8.1.5 Sustainable Integration
Future-proofing Coimbatore’s EV transition involves integrating renewable energy, particularly solar, into the EV charging network. Establishing local EV manufacturing and battery recycling hubs will not only support sustainability but also generate employment and boost the local economy. Additionally, incentivizing research and innovation in battery tech and smart charging systems will further strengthen the city’s EV ecosystem.
7.8.2Transit–Oriented Development (TOD)
7.8.2.1 Proposal for Transit-Oriented Development (TOD) Strategies in Coimbatore
A Transit-Oriented Development (TOD) strategy is proposed to promote compact, walkable, and high-density urban development around key transit corridors. This initiative aims to enhance accessibility, reduce dependency on private vehicles, and encourage sustainable urban mobility.
7.8.2.2 Identified TOD Corridors
Three major corridors have been identified for TOD implementation:
Sathyamangalam Road Corridor – Serviced by the proposed Metro Line, ensuring improved urban connectivity.
Avinashi Road Corridor – Another major arterial route along the Metro network, facilitating highdensity development.
Mettupalayam Road Corridor – Aligned with the proposed metro and existing rail corridor offering significant potential for transit-oriented growth.
Trichy Road Corridor – Aligned with the proposed metro corridor
L & T Bye pass road Corridor – Greenfield, high potential as growth corridor. Have adequate RoW and mass transit corridor can be incorporated which triggers development.
Considering the presence of both the mass transir systems, these corridors are well-positioned to become high-potential TOD zones.
Map 7.14: Proposed Transit Oriented Development (TOD) Corridors
PROPOSED TOD CORRIDOR ZONING AREA MAP
7.9 Cost Estimation For Mobility Proposals
Cost estimation plays a crucial role in transportation planning, ensuring the viability and systematic implementation of proposed mobility solutions within the master plan. As part of the Comprehensive Mobility Plan (CMP), cost estimation has been undertaken for various transportation proposals, including enhancements to the public transport system, non-motorized transport (NMT) facilities, terminals, and road infrastructure. These proposals have been structured into short-term (2–5 years), medium-term (5–10 years), and longterm (beyond 10 years) implementation phases to effectively address the projected travel demand. To ensure accuracy and reliability, broad cost estimates have been prepared based on prevailing Public Works Department (PWD) rates and insights from previous studies conducted in Tamil Nadu cities.
7.9.1Road Network Development Plan
Table 7.29Cost Estimation for projects under Road Network Development Plan.
S. No
Proposals
Unit
Quantity
Cost (Rs. In Cr)
Phase
Total
Phase
Total
I
II
III
I
II
III
a
Road Widening (Existing 2/4 Lanes to 4/6 Lanes)
Per Km
95.2
50.8
146
619
330
949.0
b
Road Widening (Existing 2 Lanes to 6 Lanes)
Per Km
5.4
27.2
32.6
70
354
423.8
c
New Road Links (4 lane)
Per Km
10.6
2.8
13.4
138
36
174.2
d
New Road Links (6 lane)
Per Km
17
17
306
306.0
e
Ring Road (6 Lane divided C/W)
Per Km
114
115
2052
2052.0
f
Minor Link Roads (2 lane) - Scheme Roads and DDP Roads
Per Km
36.4
36.4
237
237
g
Grade Separator (Flyover/ Underpass)
Per Km
4
2
6
400
200
600.0
h
Rail Over Bridges (4 Lane Carriageway)
Per Location
2
2
120
120.0
7.9.2Public Transport Improvement Plan
Table 7.30Cost Estimation for Public Transport Proposals.
S. No
Proposals
Unit
Quantity
Cost (Rs. In Cr)
Phase
Total
Phase
Total
I
II
III
I
II
III
a
MRTS
Per Km
45.8
39
45.5
130.3
11450
9750
11375
32575
b
Electric Standard Buses (12 M)
Per Bus
900
1000
1000
2600
1350
1500
1500
4350
c
Bus Terminal Improvement
Per Location
3
-
-
3
15
0
0
15
d
New Bus Terminals
Per Location
2
1
-
3
150
60
0
210
e
Railway Station Improvements
Per Location
5
2
3
10
70
20
30
120
f
New Depot
Per Location
3
2
-
5
105
30
0
135
g
Railway line (Addition of missing link)
Per Km
1.2
-
-
1.2
48
-
-
48
g
Railway line doubling (for commuter rail)
Per km
8.6
49.4
-
58
344
1976
-
2320
h
Automatic signalling (for commuter rail)
Per km
32.6
96
-
128.6
97.8
288
-
385.8
i
New halt railway station
Per Location
2
-
-
2
50
-
-
50
7.9.3 Traffic & Parking Management Measures
Table 7.31Cost Estimation for projects under Traffic & Parking Management Measures
S. No
Proposals
Unit
Quantity
Cost (Rs. In Cr)
Phase
Total
Phase
Total
I
II
III
I
II
III
a
Junction Improvement Plan
Per Location
29
-
-
29
58
-
-
58
b
Rectification of Accident-Prone Locations
Per Location
7
7
-
14
105
105
0
210
c
Automatic Multilevel Parking
ECS
4500
4000
0
8500
180
160
0
340
d
ITS
Per Location
65
35
0
100
6.5
3.5
0
10
7.9.4 NMT Improvement Measures
Table 7.32Cost Estimation for projects under NMT Improvement Measures
Table 7.33Cost Estimation for projects under Freight Management Plan.
S. No
Proposals
Unit
Quantity
Cost (Rs. In Cr)
Phase
Total
Phase
Total
I
II
III
I
II
III
a
Truck Terminal
Per Acre
15
10
0
25
30
20
0
50
7.10 Institutional Recommendation
8.2.1Existing Source and Quantity
There are around 11 Water supply schemes managed by TWAD board in the LPA, of which six major water supply schemes cater to the predominant needs of Coimbatore LPA. viz,
Athikadavu-Annur-Avinashi Wayside habitation CWSS
Bhavani/Pillur Scheme
CWSS to 249 Habitations
Coimbatore Water Supply Augumentation Scheme [Pillur I/II/III; KVV & Aliyar]
Siruvani-Thondamuthur CWS
Thiruppur 708 Scheme
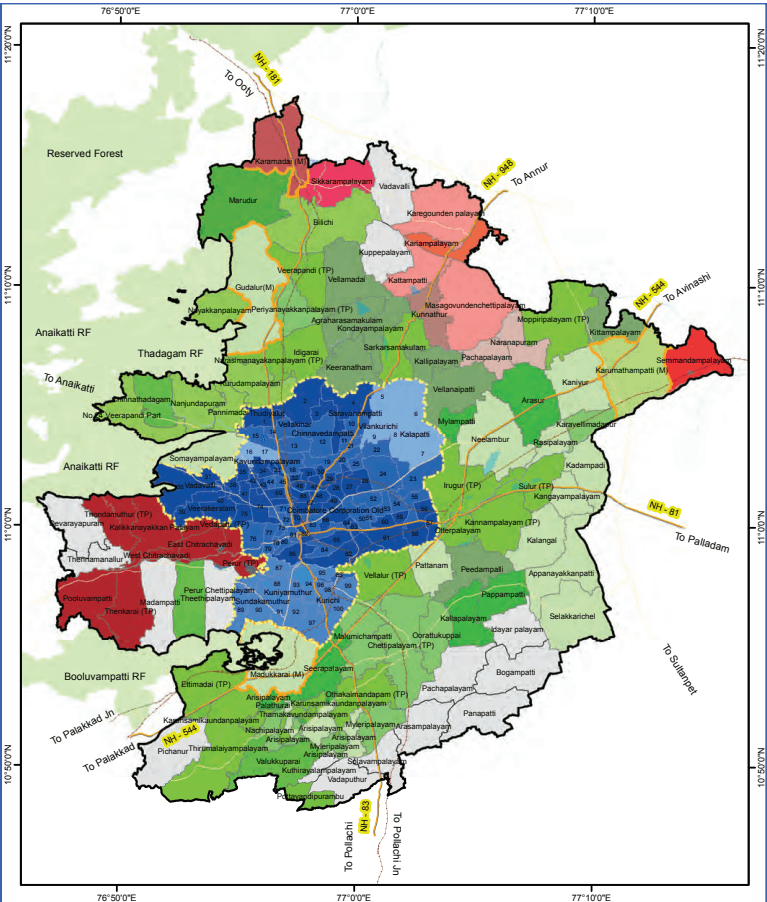
The provided Map 8.1, illustrates the spatial distribution of water supply schemes serving the administrative units within the Local Planning Area (LPA). Three primary water sources support these schemes:
Siruvani Dam: This source predominantly supplies water to the corporation. Water supply schemes drawing from the Siruvani Dam are visually represented as blue in the map.
Pillur Reservoir: The remainder of the LPA relies predominantly on the Pillur reservoir for its water supply. Schemes utilizing this source are indicated in green.
Bhavani River: Water supply schemes originally constructed for the supply of water to Tiruppur, now extends to wayside
Map 8.1: Water Supply Schemes – LPA
WATER SUPPLY SCHEMES IN LPA
habitations within the LPA, such as the Tiruppur 708 scheme. Villages situated along the western and northern portions of the LPA receive their water from this source, as depicted in red.
It is observed that revenue villages situated predominantly in the south-eastern part of the LPA, specifically within the Sultanpet and Kinathukadavu blocks, lack consistent water supply from established Water Supply (WS) schemes. Similarly, the villages of Devarayapuram and Thenamanallur, located along the western boundary of the LPA, and Vadavalli and Kuppelayam, situated in the northern part of the LPA, also experience irregular water supply from TWAD Board, as indicated in grey.
7.10.1Key Insights and Recommendations for the Master Plan
Mechanism for integrated transport system development
The Urban Development Authority (UDA) for Coimbatore LPA would coordinate the work of implementing agencies on the Master Plan. The National Urban Transport Policy recommends setting up of Unified Metropolitan Transport Authority (UMTA) in million-plus cities. As this may take time to set up, the UDA is recommended to avail expertise in Transport Planning, and CUMTA may give overall advisory support in Transport Planning aspects.
Inclusion of footpath development as part of the project cost of all new roads, road widening, and along MRTS corridors
It is proposed that metro implementation may integrate the development of pedestrian infrastructure within a 500-meter radius of each metro station as part of the metro rail construction activities. Synchronizing these developments with metro construction will not only facilitate smooth last-mile connectivity but also significantly improve safe and inclusive access, especially for women, children, senior citizens, and persons with disabilities—ultimately leading to increased metro ridership.
Water Infrastructure
8.1 Overview
The Coimbatore Local Planning Area (LPA) currently possesses a robust foundation in providing essential water supply and sanitation infrastructure, achieving commendable coverage across its jurisdiction. Building upon this strength, this chapter envisions a future where these critical services transcend mere accessibility to become deeply sustainable and resilient, thereby fostering Sustainable Urbanization through Sustainable Water Management.
The 2030 Agenda for Sustainable Development explicitly recognizes the critical role of water and sanitation through Sustainable Development Goal 6: “Ensure availability and sustainable management of water and sanitation for all. Furthermore, considering that access to potable water and effective sanitation are fundamental determinants of community living standards, as highlighted by the NITI Aayog’s Multidimensional Poverty Index, this section delineates a strategic trajectory towards ensuring a watersecure LPA.
While the existing infrastructure provides widespread coverage, the plan attempts to bolster water sources and achieve greater self-sufficiency. This necessitates embracing cutting-edge technologies for the intelligent reuse of treated wastewater and stormwater. Furthermore, acknowledging the increasing threats posed by climate variability, the plan underscores proactive measures for groundwater augmentation. By diligently focusing on replenishing this vital resource, the plan aims to build resilience against potential rainfall deficits and safeguard the long-term water security of the region.
This chapter intends to achieve the vision of Sustainable Urbanization through Sustainable Water Management, with the overarching mission of Sustainable water management at Source and Usage. This mission is driven by the fundamental requirements of ensuring uninterrupted access to potable water for domestic consumption, a reliable supply of non-potable water for industrial applications, and satisfying irrigation demands utilizing surface water resources.
The emphasis on sustainable practices is rendered critical by prevailing vulnerabilities, notably, a substantial reliance on monsoon-dependent runoff from the Western Ghats, as the LPA has an average rainfall deficit of 33% compared to the state average, water resources shared
8.2 Water Supply – Baseline Study
by multiple regions, the over-extraction of a significant proportion of groundwater reserves and the limited availability of surface water bodies (constituting a mere 4% of total land area).
Recognizing these factors, this chapter will meticulously delve into the specific strategies and pathways that will translate the vision into a tangible reality. It will meticulously identify the “whats” – the precise interventions and infrastructure upgrades required – and, crucially, the “hows” – the innovative approaches, technologies, and collaborative frameworks that will bring these goals to fruition. By focusing on these key areas, the LPA aims to secure a sustainable and resilient water future for 2041 and beyond.
8.2.1.1Coimbatore City Municipal Corporation
There are six sources of supply of drinking water to Coimbatore City: Siruvani, Pillur [I,II & III], KVV and Aliyar. Siruvani and Pillur are the major schemes and CCMC is maintaining the distribution of water supply. The entire supply of water from Siruvani is by nature of gravity whereas pumping is being done in the Pillur scheme. Other Schemes aid in water supply improvement in the distribution system to extended areas that include Kurichi, Kuniyamuthur, Thudiyalur, Vellakinar, Vilankurichi, Chinnavedampatti, Saravanampatti and Kalapatty which are presently added areas to the CCMC.
The two major water supply schemes that cater to the majority of the water supply requirements of the LPA are briefed below,
A. Siruvani Drinking Water Scheme
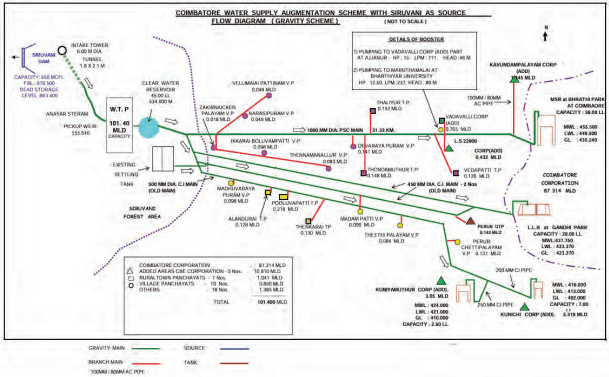
The Coimbatore Water Supply augmentation Project envisaged the construction of a dam and other connected works across the Siruvani River in the Kerala Territory through a tunnel of 1.6km long to let the water into the Anayar stream in Tamil Nadu and was implemented in the year 1982 at an estimated cost of Rs. 1,616 lakhs. From there, the water is conveyed through the Head works to Adivaram for treatment. The treated water is conveyed through the 1000mm PSC conveying main and terminates in a Master Service Reservoir at Bharathi Park in Coimbatore City. From the Master Service Reservoir water is distributed to the zonal service reservoirs located at various places, added areas and surrounding areas of the Coimbatore City through the distribution mains
and the conveying mains. From the conveying main, wayside villages of 7 rural village panchayats, 5 urban panchayats and 10 village panchayats are benefited by this scheme. The designed capacity of the scheme is 101.4 MLD.
Flow diagram of the Coimbatore Water Supply Augmentation Scheme, which utilizes the Siruvani Dam as its primary water source is provided below. The scheme comprises several key components: The Intake Tower facilitates the extraction of water from the Siruvani Dam, which is then conveyed by a Tunnel to the Clear Water Reservoir for storage. From the reservoir, water is processed at the Water Treatment Plant (WTP) to ensure potability, and subsequently distributed to the designated areas through a network of Gravity Mains and Branch Mains. Storage facilities, or Tanks, are located at various points within the system to manage water distribution.
Figure 8.1: Siruvani Water Supply Augmentation Scheme Flow Diagram
B. Pillur Drinking Water Scheme
Pillur Dam was constructed on the Bhavani River, a tributary of Cauvery. The Dam is located in the downstream of the confluence point of its main tributary Kundha River which originates in the Nilgiris hills of Western Ghats. The total storage capacity of Piloor Dam is 1566 Mcft and FRL is 426.72 m and Dead Storage level is 356.60 m. The minimum inflow into the Dam is 600 cusecs.
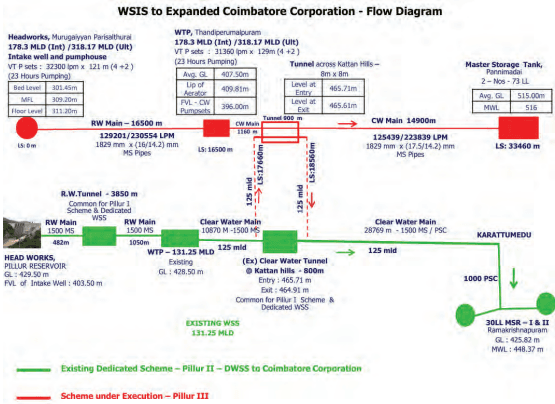
Raw water is pumped in Nellimarathur by 4x400 H.P pump sets through a tunnel of 3.85 km length and the water is treated to a full-scale water treatment plant at Valliangadu. Clear water is pumped by 4x400H.P pump sets through 1500 mm dia pipeline to a tunnel of 800m length across Kattan hills, from there the water is conveyed through the pipelines of diameter ranging from 500 mm to 1500 mm and 400 mm to the Coimbatore Corporation and Palladam and provisions have been made to distribute the water in various places. Flow diagram of the scheme is depicted below.
Figure 8.2: Flow Diagram – WSIS to Coimbatore Corporation
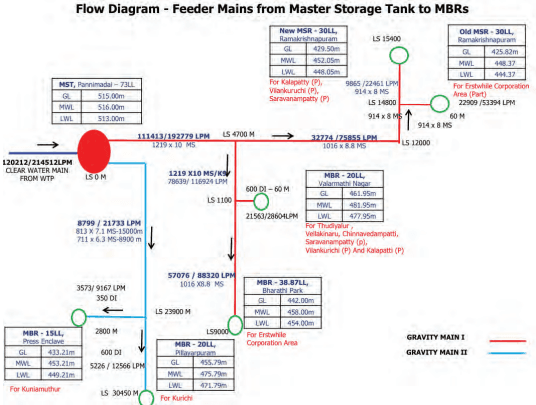
Figure 8.3: Flow Diagram of Feeder Mains
The following Table 8.1 presents the design quantities for six water supply schemes, the current withdrawal for municipal corporation supply, and the remaining available quantity that can be safely utilized for future supply augmentation. The current per capita water supply to the corporation is 129 LPCD against the supply standard of 135 LPCD as per CPHEEO.
Table 8.1Water Supply Schemes in LPA
Scheme Name
Siruvani
Pillur I
Pillur II
Pillur III
KVV
Aliyar
Total
Design Quantity [MLD]
98.12
22.00
125.00
173.03
22.00
7.60
447.75
Withdrawal Quantity [MLD]
60.49
18.23
102.34
87.71
19.68
6.94
295.39
Available supply for future tapping [MLD]
37.63
3.77
22.66
85.32
2.32
0.66
152.36
C. Ground Water Sources
There are 436 open wells / bore wells in operation to supplement to the non-potable water requirement and 250 bore wells / open wells are maintained by private operation and the rest are being operated by the Engineering Department, Coimbatore Corporation.
8.2.1.2Municipalities
The primary water supply for the four municipalities is provided by two major schemes: Athikadavu Combined Water Supply Scheme (CWSS) and the Pillur Schemes. The principal source of raw water is the Pillur Reservoir/Dam, with a Water Treatment Plant located at Vellanaikadu possessing an operational capacity of 125 Million Liters per Day (MLD).
Three of the four municipalities have exceeded the service level benchmark of 90 liters per capita per day (LPCD). Karamadai municipality exhibits the highest potable water supply at 106 LPCD. Conversely, the recently upgraded Karumathampatti municipality demonstrates the lowest supply, recorded at 75 LPCD.
The Table 8.2 delineate the water supply sources and their current supply, coverage and LPCD supplied for each of the four municipalities.
Table 8.2Water Supply Schemes and Quantity Supplied in Municipality
MUNICIPALITY
MADUKARAI
KARUMATHAMPATTI
GUDALUR
KARAMADAI
Scheme
Pillur Athikadavu
Pillur Water Supply Scheme
Pillur Athikadavu
Pillur/ Bhavani River
Sources of Water Supply
Pillur Reservoir
Pillur Reservoir
Pillur Reservoir
Bhavani River
Coverage (%)
100%
100%
100%
100%
Quantity Supplied (in MLD)
3.8
3.3
5.2
4.99
Potable Water supply (LPCD)
99
75
90
106
Source: Municipality
8.2.1.3Town Panchayats
All 21 Town Panchayats have 100% Water Supply coverage with an average per capita supply of 91 LPCD surpassing the service level benchmark of 70 LPCD. Major water supply schemes that cater to the Town panchayats are, Pillur and Siruvani schemes. Table 8.3 depicts the sources and quantity of Water Supply, water Distribution Systems and RWH facilities in the Town panchayats.
Table 8.3Water Supply Schemes and Quantity Supplied in Town Panchayat
S. No
Town Panchayat Name
Sources of Water Supply
Water distribution System
Water distribution System
Potable Water supply (LPCD)
Water harvesting system facilities
S. No
Town Panchayat Name
Sources of Water Supply
Coverage(%)
Quantity (in MLD)
Potable Water supply (LPCD)
Water harvesting system facilities
1
Chettipalayam
Pillur CWSS I & II and Local Sources
100%
1.357
96
4
2
Dhaliyur
Siruvani CWSS & Thondamuthur CWSS and Local Sources
100%
1.281
89
3
3
Ettimadai
Pillur CWSS I & II and Local Sources
100%
1.277
89
1
4
Idigarai
Pillur CWSS I & II and Local Sources
100%
1.72
91
Nil
5
Irugur
Pillur CWSS I & II and Local Sources
100%
3.787
99
Nil
6
Kannampalayam
Pillur CWSS I & II and Local Sources
100%
2.694
94
Nil
7
Moppiripalayam
Athikadavu - Avinashi - Annur CWSS and Local Sources
100%
1.55
98
4
8
Narasimma-naickenpalayam
Pillur CWSS I & II and Local Sources
100%
2.775
88
Nil
9
Veerapandi
Pillur CWSS I & II and Local Sources
100%
2.537
87
3
10
Othakalmandapam
Pillur CWSS I & II and Local Sources
100%
1.694
94
4
S. No
Town Panchayat Name
Sources of Water Supply
Water distribution System
Water distribution System
Potable Water supply (LPCD)
Water harvesting system facilities
S. No
Town Panchayat Name
Sources of Water Supply
Coverage(%)
Quantity (in MLD)
Potable Water supply (LPCD)
Water harvesting system facilities
11
Pallapalayam
Pillur CWSS I & II and Local Sources
100%
2.278
99
1
12
Periya-naickenpalayam
Pillur CWSS I & II and Local Sources
100%
2.713
84
Nil
13
Perur
Siruvani CWSS & Thondamuthur CWSS and Local Sources
100%
0.788
95
Nil
14
Pooluvapatti
Siruvani CWSS & Thondamuthur CWSS and Local Sources
100%
1.249
82
Nil
15
Sarkarsamakulam
Pillur CWSS I & II and Local Sources
100%
2.138
89
3
16
Sulur
Pillur CWSS I & II and Local Sources
100%
3.595
98
2
17
Thenkarai
Siruvani CWSS & Thondamuthur CWSS and Local Sources
100%
0.733
95
Nil
18
Thirumalayam-palayam
Pillur CWSS I & II and Local Sources
100%
1.126
83
Nil
19
Thondamuthur
Siruvani CWSS & Thondamuthur CWSS and Local Sources
100%
1.246
83
Nil
20
Vedapatti
Siruvani CWSS & Thondamuthur CWSS and Local Sources
100%
1.269
87
Nil
21
Vellalore
Pillur CWSS I & II and Local Sources
100%
3.624
91
8
Source: Town Panchayat
Source: Tamil Nadu Water Supply and Drainage Board