10.9.5 Block Costing for Proposed substation - Coimbatore LPA.... 506
xi
List of Abbreviations
AC
Air Conditioned
AG
Aspirational Growth
AHP
Affordable Housing in Partnership
AID
Automatic Incident Detection
API
Application Programming Interface
ATIS
Automatic terminal information service
ATMP
(Assembly, Testing, Marking & Packaging
ATMS
Advanced traffic management system
BAU
Business as Usual
BFSI
Banking, Financial Services, and Insurance
BIS
Bureau of Indian Standards
BOV
Battery Operated Vehicles
BPO
Business process outsourcing
BWSSB
Bangalore Water Supply and Sewerage Board
CAGR
Compounded Annual Growth Rate
CASC
Coimbatore Auto Sports Club (
CBD
Central Business District
CBIC
Chennai-Bengaluru Industrial Corridor
CBIC
Chennai-Bengaluru Industrial Corridor
CBMIC
Chennai Bengaluru-Mumbai Industrial Corridor
CBSE
Central Board of Secondary Education
CCMC
Coimbatore City Municipal Corporation
CCTV
Closed-circuit television
CETPs
Common effluent treatment plants
CHC
Community Health Center
CHIL SEZ
Coimbatore Hi-tech Infrastructure Private Limited Special Economic Zone
CIBI
Coimbatore Innovation and Business Incubator
CII
Confederation of Indian Industry
CIT
Coimbatore Institute of Technology
CKIC
Chennai - Kanniyakumari Industrial Corridor
CLPA
Composite Local Planning Area
CMP
Comprehensive Mobility Plan
CNG
Compressed Natural Gas
CODISSIA
Coimbatore District Small Industries Association
xxvi
CPCB Central Pollution Control Board CPHEEO Central Public Health and Environmental Engineering Organisation CPS Community Parks CUMTA Chennai Unified Metropolitan Transport Authority CWSN Children With Special Needs CWSS Combined Water Supply Schemes DAY-NULM Deen Dayal Antyodaya Yojana - National Urban Livelihoods Mission DEWATS Decentralised Wastewater Treatment System DGPS Differential Global Positioning System DHH District Headquarter Hospital DMA District Metering Areas DPSUs Defence Public Sector Undertakings DRDO Defence Research and Development Organisation DSDC District Skill Development Centre DTCP Directorate of Town & Country Planning ECBC Energy Conservation Building Code ELCOT Electronics Corporation of Tamil Nadu ESDM Electronics Hardware Manufacturing ESDM Electronics System Development and Maintenance ESI Employees State Insurance ESR Elevated Storage Reservoirs ESZ Eco-Sensitive Zones ETA Estimated Time of Arrival ETC Estimated Time of Completion ETP Effluent Treatment Plant EWS Economically Weaker Section FAR Floor Area Ratio FHTC Functional Household Tap Connections FMSCI Federation of Motor Sports Clubs of India FRL Full Reservoir Level FSI Floor Space Index FSTP Faecal Sludge Treatment Plant GCCs Global Capability Centres GCP Ground control point GDDP Gross District Domestic Product GDP Gross Domestic Product GER Grass Enrollment Ratio GI Geographic Indication
xxvii
GIS Geographical Information System GoTN Government of Tamil Nadu GQ Golden Quadrilateral GSDP Gross State Domestic Product GSI Geological Survey of India GSR Ground Service Reservoirs GVA Gross Value Addition H&UD Housing & Urban Development HACA Hill Area Conservation Authority HDI Human Development Index HGT High Growth Trajectory HIG Higher Income Group HSC Health Sub-Center HVAC Heating, ventilation, and air conditioning ICCC Integrated Command and Control Centre ICD Inland container depots ICTT International Container Transshipment Terminal IIS Indian Institute of Science IISER Indian Institute of Science Education and Research IIT Indian Institute of Technology ILPs Integrated Logistics Parks IMD Indian Meteorological Department IPHS Indian Public Health Standards IPT Intermediate Public Transit IRC Indian Road Congress ISRO Indian Space Research Organization IT Information Technology ITeS Information Technology Enabled Services ITI Indian Training Institute ITS Intelligent Transport System JJM Jal Jeevan Mission JNNURM Jawaharlal Nehru National Urban Renewal Mission KLD Kiloliters per Day L&T Larsen & Toubro Limited LIG Lower Income Group LPA Local Planning Area LPCD Liters per capita per day LPO Legal Process Outsourcing
xxviii
MBBR Moving Bed Biofilm Reactor MICE Meetings, Incentives, Conferences, and Exhibitions MIG Middle Income Group MLD Million Litres per Day MMDA Madras Metropolitan Development Authority MMLP Multimodal Logistics Park MPI Multidimensional Poverty Index MRTS Mass Rapid Transit System MSL Mean Sea Level MSME Micro, Small and Medium Enterprises MVA Megavolt-Amperes NBFCs Non-Banking Financial Companies NCT National Capital Teritory NDMA National Disaster Management Authority NDMC New Delhi Municipal Council NH National Highway NID National Institute of Design NIFT National Institute of Fashion Technology NIRF National Institutional Ranking Framework NMT Non- Motorized Transport NMV Non -Motorized Vehicles NPV Net Present Value NRSC National Remote Sensing Center NRW Non-Revenue Water NSSO National Sample Survey Office NULM National Urban Livelihood Mission OEMs Original Equiment Manufacturers OHT Over Head Tanks ORS Open Route Service OSM Open Street Map OSR Open Space Reservation PDS Public distribution system PHC Primary Health Center PHPDT Peak Hour Peak Direction Traffic PMAY Pradhan Mantri Awas Yojana PPP Public-Private Partnership PSU Public Sector Unit PSU Public Sector Unit
xxix
PwD Person with Disabilities R&D Research & Development RAY Rajiv Awas Yojana RFID Radio Frequency Identification RoB Rail over Bridge RoW Right of Way RRTS Regional Rapid Transit System RTO Regional Transport Office SaaS Software-as-a-Service SACON Sálim Ali Centre for Ornithology and Natural History SAFE Site Adjacent Factory Employee SBR Sequential Batch Reactor SCADA Supervisory control and data acquisition SDGs Sustainable Development Goals SEZ Special Economic Zone SH State Highway SHG Self-Help Groups SIDCO Small Industries Development Corporation SIPCOT State Industries Promotion Corporation of Tamil Nadu SME Small and Medium Enterprises SRTM Shuttle Radar Topography Mission STEM Science, Technology, Engineering, and Math STP Sewage Treatment Plant STPI Software Technology Park of India STR student-Teacher Ratio SUH Shelter for Urban Homeless T&CP Town & Country Planning TANGEDCO Tamil Nadu Generation and Distribution Corporation Limited TANTRANSCO Tamil Nadu Transmission Corporation Limited TDM Traffic Demand Management TIDCO Tamil Nadu Industrial Development Corporation TIDEL Tamil Nadu Industrial Development Corporation and Electronics Corporation of Tamil Nadu TIFR Tata Institute of Fundamental Research TMC Traffic Management Centers TNAU Tamil Nadu Agricultural University TNCDBR Tamil Nadu Combined Development Building Rules TNDIC Tamil Nadu Defence Industrial Corridor TNEB Tamil Nadu Electricity Board
TNGECL Tamil Nadu Green Energy Corporation Limited TNHB Tamil Nadu housing board TNPCB Tamil Nadu Pollution Control Board TNPDCL Tamil Nadu Power Distribution Corporation Limited TNPGCL Tamil Nadu Power Generation Corporation Limited TNSRLM Tamil Nadu State Rural Livelihood Mission TNSSGF Tamil Nadu Startup Seed Grant Fund TNSTC Tamil Nadu State Transport Corporation TNUHDB Tamil Nadu Urban Habitat Development Board TNULM Tamil Nadu Urban Livelihood Mission TOD Transit Oriented Development TP Town Panchayats TWAD Tamil Nadu Water Supply and Drainage Board UASB Upflow Anaerobic Sludge Blanket UDA Urban Development Authority UGPHC Up Graded Primary Health Centre UGSS Under Ground Sewerage Schemes ULB Urban Local Bodies UMTA Unified Metropolitan Transport Authority UNESCO United Nations Educational, Scientific and Cultural Organization UPHC Upper Primary Health Center URDPFI Urban and Regional Development Plans Formulation & Implementation URPs University Research Parks USGS United States Geological Survey WTP Water Treatment Plant
1.1 Background
A master plan is a comprehensive and strategic document that guides future growth and development by integrating built environments, economic conditions, social settings, and surrounding landscapes to ensure organized and sustainable urban expansion. Serving as a decisionmaking blueprint, it outlines a clear vision, goals, and a structured development approach. This plan is widely applied to address key aspects such as land use, transportation, infrastructure, and environmental sustainability to promote balanced and integrated growth. By establishing long-term objectives and implementation strategies, master plans enable the execution of essential policies, projects, and initiatives while remaining adaptable to evolving needs.
1.2Purpose of the Master Plans
The Tamil Nadu Town and Country Planning Act, 1971 provides a comprehensive framework for the systematic development and utilization of both rural and urban land across the state. This legislative framework facilitates the preparation and implementation of Master Plans to ensure planned growth and sustainable development.
The Master Plan encompasses various aspects of land use planning, infrastructure development, environmental conservation, and socio-economic advancement. The master plan may provide any or all of the following requirements:
• To determine how land in the planning area is used.
To allocate or reserve land for residential, commercial, industrial, and agricultural purposes, as well as for parks, playgrounds, and open spaces.
• To allocate or reserve land for public buildings, institutions, and civic amenities.
To make provisions for national highways, arterial roads, ring roads, major streets, railways, airports, canals, and other transportation links.
To outline traffic and transportation patterns, including road improvements and circulation systems.
To reserve for future development, expansion, and new housing projects.
To address improvements for poorly designed areas, outdated developments, slums, and population relocation wherever necessary.
Further to the above, the implementation of various other acts and regulations requires the master plan to provide for the following:
To ensure the provision of essential amenities, services, and utilities.
To make detailed development plans for specific zones, including housing, shopping centres, industries, civic facilities, and educational and cultural institutions.
• To regulate architectural features, building heights, number of floors, setbacks, open spaces, and land use.
To define the stages for implementing the Master Plan, and any other necessary matters, as required to be included.
To incorporate provisions for disaster management, including flood mitigation, cyclone-resistant infrastructure, earthquake-prone zone regulations, and emergency evacuation routes.
To allocate and protect water resources, including rivers, lakes, groundwater recharge zones, and watershed areas, ensuring sustainable usage and prevent pollution.
To include provisions for critical social infrastructure such as hospitals, community centres, and welfare institutions to cater to the needs of the population.
To address the development and maintenance of physical infrastructure, including water supply and sewage systems, stormwater drainage, solid waste management, and power supply networks.
The Urban and Regional Development Plans Formulation & Implementation (URDPFI) 2015 guidelines, formulated by the Town & Country Planning Organisation, Government of India provides guidelines for preparation of Master Plan inter-alia indicate:
The Master Plan (Development Plan) shall aim to provide detailed strategies and physical proposals to implement policies from the Perspective Plan and Regional Plan, based on economic and social needs, public aspirations, available resources, and priorities.
• To ensure affordable housing provisions and slum rehabilitation, as equitable access to shelter ensures inclusive urban growth.
1.3 Need for Master Plan
The Master Plan also identifies areas that need preservation, conservation, and development, particularly those with ecological value, natural scenery, and significant landscapes.
• It includes the protection of historical, architectural, and scientifically important structures, as well as environmentally sensitive areas.
The Master Plan will be prepared using Geographic Information System (GIS)-based mapping and spatial analysis to ensure accurate land-use planning, infrastructure management, and data-driven decision-making. The typical timeframe for these plans is 20-30 years, with phased planning in 5-year intervals for periodic reviews.
Coimbatore, known as the “Manchester of South India,” has a strong industrial legacy, particularly in textiles, and has evolved into a major hub for manufacturing, IT, and education. The city is also enriched with natural resources, including the Western Ghats, protected forests, and interconnected lakes, which are vital to its ecosystem. However, with rapid urbanization, industrial growth, and ecological sensitivity, a vision for stretgic development is essential
The existing Coimbatore Master Plan, approved in 1994, was formulated with a proposed land use plan for 2011. Since its horizon period is attained and the LPA encompassing the various Urban Local bodies such as Coimbatore Corporation and other municipalities, has undergone significant urban expansion, there is a need to update the master plan. The revised plan must regulate and facilitate growth while ensuring environmental sustainability and public welfare. Additionally, the planning area was expanded from 1,286.80 sq. km to 1,531.57 sq. km as per the G.O. (Ms) No. 188, H&UD Department, dated 25.10.2022, addressing the increasing developmental demands.
With the upcoming establishment of an Urban Development Authority (UDA) for Coimbatore, a comprehensive master plan will be crucial in guiding future development, implementing strategic policies, and fostering a balanced urban ecosystem. The new master plan aims to promote sustainable growth, inclusive development, and an enhanced quality of life for its residents while integrating ecological conservation and modern infrastructure.
1.4 Master Plan for Coimbatore LPA
The Coimbatore Local Planning Area i.e. the city and its influence area considered for planning purpose was first delineated in 1974 comprising the Coimbatore Municipality and 45 Revenue villages of Palladam Taluk of area 593.45 sq.km. However, by a subsequent notification in 1980 the Coimbatore planning area or the Local planning area was revised to cover a larger area comprising the Coimbatore Corporation, Madukkarai Township, 31 Town Panchayats and 55 Revenue villages and was notified by G.O.(Ms.) No.503 H&UD Dept. dated 17.04.1980. The expanded area was 1287 sq.km. Separately, Kurichi, located adjacent to Coimbatore Local Planning Area was identified for development as a New Town and the area comprising Kurichi, Malumichampatti and Seerapalayam of 47.97sq.km was declared as Kurichi New Town planning area in G.O.(Ms.) No.494 H&UD Dept. dated 19.06.1983. More than a decade later the first Master Plan for Coimbatore as well as the Kurichi New Town Development plan were prepared and approved in 1994 and 1995 respectively. DTCP has prepared and approved 60 Detailed Development Plans during the period from 1974 to 2012 for different areas within the LPA. Historically, 11 Town Planning Schemes were prepared and approved from 1933 to 1972.
The Second Master Plan was initiated with an expanded jurisdiction, incorporating additional villages in Coimbatore District under Section 10(1) of the Act, as per G.O. (Ms) No. 41, H&UD Department, dated 26.02.2014. This extended the planning area to include 1 Corporation, 4 Municipalities, 21 Town Panchayats, and 66 revenue villages. The Coimbatore Local Planning Area (LPA) was officially declared under Section 10(4) of the T&CP Act, 1971, through G.O. (Ms) No. 188, H&UD Department, dated 25.10.2022, expanding its jurisdiction to 1,531.57 sq. km, covering eight taluks of Coimbatore District viz., Coimbatore North, Coimbatore South, Annur, Sulur, Kinathukadavu, Madukkarai, Perur, and Mettupalayam. Summary of the administrative boundary of Coimbatore LPA is detailed in Table 1.1.
1.7 Master Plan Preparation of 2021 – 2041
1.5 Urban Development Authority (UDA)
1.6 Hill Area Conservation Authority (HACA)
Table 1.1Administrative Summary of Coimbatore Local Planning Area
S. Administrative
No. of.
Area
No Category
Local Bodies
(in Sq. Km)
1. Corporation
1
257.81
2. Municipalities
4
97.56
3. Town panchayats
21
314.93
4. Revenue Villages
66
861.27
Overall LPA
92
1,531.57
The Coimbatore Urban Development Authority (UDA) was established with the jurisdiction of the same LPA boundary as per G.O. (Ms) No. 197, H&UD Department, dated 11.11.2022. This enables the seamless integration of planning and development functions. The UDA is expected to utilize the Master Plan as its primary tool for guiding sustainable urban growth, optimizing land utilization, and implementing strategic infrastructure development while addressing critical aspects such as transportation networks, environmental sustainability, and equitable distribution of civic amenities across the entire UDA area.
The Tamil Nadu Government established the Hill Area Conservation Authority (HACA) to protect ecologically sensitive hill areas and promote sustainable development. As per GO MS.No.44 (02.04.1990), unchecked activities like farming, tourism, and infrastructure in the Western Ghats have caused severe environmental concerns. While these developments benefit society, they strain fragile hill ecosystems. The Government recognized that hill areas need special policies, different from the plains, to prevent irreversible damage. HACA regulates development to ensure balance growth and conservation.
Since 17 villages in the Coimbatore LPA (Local Planning Area) fall under HACA, their ecological sensitivity is considered during the Master Plan preparation process to ensure sustainable development.
The Directorate of Town & Country Planning (DTCP), Government of Tamil Nadu, has undertaken the preparation of the Master Plan for Coimbatore Local Planning Area
(LPA) as part of its state wide urban planning initiative. The Directorate, Coimbatore Region, has directly overseen all technical studies, surveys, and stakeholder consultations in accordance with the Tamil Nadu Town and Country Planning Act, 1971, and relevant urban development guidelines. The planning process includes comprehensive land-use assessments, infrastructure evaluations, transportation studies, and environmental considerations, supported by GIS-based spatial analysis and ground verification. Stakeholder discussions and inter-departmental coordination ensure inclusive and sustainable planning. DTCP plays a crucial role in Coimbatore’s urban development by consolidating data, preparing draft proposals, and contributing to the finalization of the Master Plan that guides the city’s structured growth.
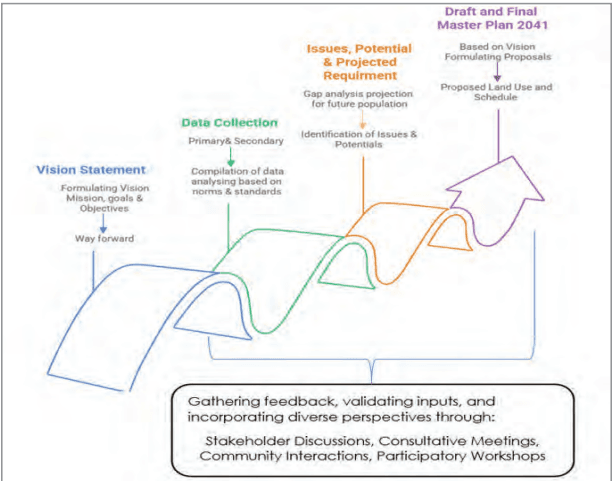
Figure 1.1: Methodology
1.7.1Existing Land Use Preparation
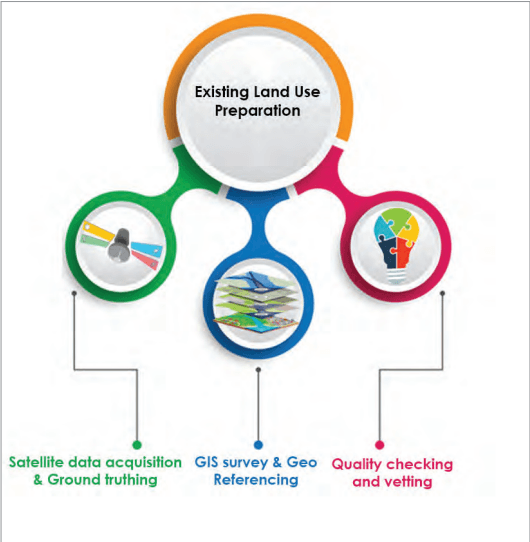
The Existing Land Use Map was prepared by DTCP using high-resolution satellite imagery from National Remote Sensing Center (NRSC). Cadastral frameworks were developed using village maps with survey numbers from the Survey and Land Records department. DGPS surveys collected GCPs for georeferencing scanned paper maps, and survey boundaries were digitized as GIS polygons with village names and survey numbers. The process included the following:
Satellite data acquisition & Ground truthing – The land use mapping process utilized satellite imagery sourced from NRSC, ISRO.
GIS Survey & Geo-Referencing – Cadastral maps were prepared using village survey records, with DGPS surveys collecting GCPs for georeferencing. Boundaries were digitized as GIS polygons, including village names and survey numbers. Ward maps for Coimbatore LPA were geo-referenced with town survey numbers captured in the database.
Quality Check & Base Map Preparation – The existing land use classification was quality-checked by overlaying TNEB electricity connection details on the GIS map. This cross-verification process confirmed occupancy patterns and validated actual land use against recorded data before finalization.
Figure 1.2: Existing Land Use Preparation
1.7.2Vision
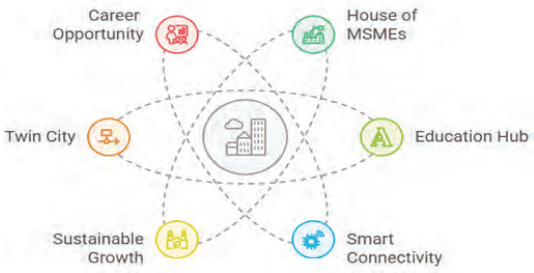
“To establish Coimbatore as a dynamic, interconnected regional hub that fosters technological innovation, industrial excellence, and seamless transportation, significantly enhancing the quality of life for all its residents.”
Coimbatore would evolve as a balanced, futureready city that is economically strong, socially inclusive, environmentally conscious, and well-connected. Coimbatore will become an even better place to live, work, and grow, offering opportunities for all.
Figure 1.3: Visioning Exercise
Core Principles:
The core principles that would guide achieving this vision include the following.
Interconnectedness: Emphasizing Coimbatore’s role as a central point of connection for technology, industry, and transportation.
Sustainability: Prioritizing environmental protection and sustainable development.
Innovation: Fostering a culture of technological advancement and economic growth.
Inclusivity: Ensuring that all citizens benefit from the city’s development.
Key Pillars of the Vision
Economic Growth & Industrial Excellence
Promote and expand MSMEs as a core engine of local economic activity
Support innovation and entrepreneurship through dedicated zones and incubators
Educational Leadership
Strengthen Coimbatore’s position as a hub for quality education
Attract and retain talent by fostering partnerships between industry and academia
Livelihood & Inclusive Opportunities
Generate diverse employment opportunities
Ensure equitable access to resources and benefits for all citizens
• Connectivity & Regional Integration
Improve transport infrastructure and public transit systems
Enhance connectivity with neighboring hubs such as Tiruppur, Erode, and the surrounding areas
Strengthen Coimbatore’s role as a central node in the regional economy
Environmental Sustainability
Prioritize green spaces, clean air, and sustainable urban practices
Protect natural resources while managing urban expansion responsibly
1.7.3Data Collection for Coimbatore Master Plan 2041
Preparation of this GIS-based master plan involved extensive secondary data collection from multiple reliable sources to ensure accuracy and comprehensiveness. Key datasets were gathered from various government departments, including spatial and land use records from the TNUHDB, TNHB, and TANGEDCO; infrastructure details from TWAD, Highways, TNEB, and environmental data from the TNPCB, and Forest Department. Additionally, critical inputs were obtained from stakeholder consultations with industry associations like CODISSIA, academic institutions, and urban development agencies. This robust data collection framework provided a strong foundation for spatial analysis, scenario modeling, and evidence-based policy formulation, ensuring the plan’s effectiveness in addressing Coimbatore’s future urban development needs.
1.7.4Identification of Gaps and Demands
Gap and demand identification is a crucial step in master plan preparation, ensuring urban development aligns with both current needs and future growth. This process involves a comprehensive assessment of existing infrastructure, land use patterns, economic activities, environmental conditions, and social amenities to pinpoint deficiencies in service delivery and urban functionality. Key focus areas include housing shortages, transportation inefficiencies, lack of public spaces, industrial expansion requirements, and gaps in healthcare and education infrastructure. By analysing these factors alongside projected population growth, economic trends, and policy goals, the need for necessary interventions—from infrastructure upgrades to new development initiatives have been evolved.
The analytical phase was anchored in key statelevel and national policy frameworks to ensure alignment with Nation’s and Tamil Nadu’s long-term developmental objectives. Foremost among these were the Vision for a 1 Trillion Dollar Economy, the Tamil Nadu State Tourism Policy, the Tamil Nadu Housing and Habitat Development Policy, National framework for safe use of treated water 2022, Solid waste management rules 2016 and the Green Tamil Nadu Mission. These state-specific directives provided a strategic foundation and direction, guiding the Master Plan toward regionally grounded and forward-looking outcomes. In addition to State policies, the analytical phase also employed a projection based methodology based on established national frameworks and standards. Key reference guidelines included the Urban and Regional Development Plans Formulation and Implementation (URDPFI), directives from the National Institution for Transforming India (NITI Aayog), Indian Public Health Standards (IPHS), and recommendations from the National Disaster Management Authority (NDMA). In addition, demographic and infrastructure growth estimates were derived using the Compound Annual Growth Rate (CAGR) and benchmarks provided by the Central Public Health and Environmental Engineering Organization (CPHEEO). This approach enabled comprehensive scenario modeling and supported the formulation of evidence-based recommendations.
For the Coimbatore Master Plan 2041, this assessment plays a pivotal role in shaping land-use allocations, zoning regulations, and investment priorities. The findings ensure that the plan enhances urban efficiency, sustainability, and resilience while addressing critical gaps. Stakeholder consultations—including industry bodies, civic groups, and urban experts—further refine strategies, fostering balanced and inclusive growth. Through this data-driven approach, the master plan not only bridges existing service gaps but also anticipates future challenges, positioning Coimbatore as a well-planned, livable, and economically vibrant city.
1.7.5Stakeholder Engagement
Stakeholder engagement constituted a major component of the planning process. The initial phase involved consultations with the general public and representatives of local bodies to factor community-level priorities and concerns into the planning framework. This participatory approach ensured alignment with local needs and expectations. Meetings were conducted with a diverse range of industry associations such as the Coimbatore District Small Industries Association (CODISSIA), CII, Local area Market Association, Lorry Owners Association, Tamil Nadu Passenger Welfare Associations, Industry Association, Resident Welfare Association (RWA), academic institutions, agriculture interest groups, and other departments.
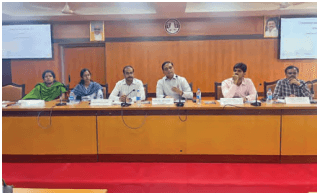
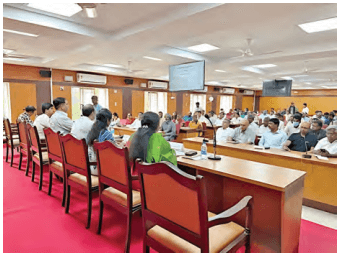
A series of stakeholder meetings were held to refine strategic approaches, ensuring balanced and inclusive growth while addressing the needs of diverse community groups. The first meeting took place on 22.10.2021, (Figure 1.4) chaired by the Principal Secretary, Housing and Urban Development Department, at the District Collectorate Meeting Hall with the line departments and the general public.
Figure 1.4: Stakeholders Discussion
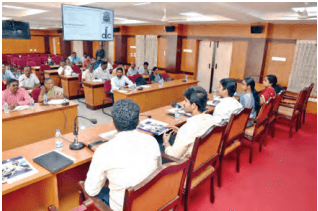
The second meeting was held on 01.12.2022, again chaired by the Principal Secretary, H&UDD, at the District Collectorate Meeting Hall with the line departments and the general public. A dedicated line department meeting was conducted on 29.03.2023, (Figure 1.5) chaired by the District Collector, at the District Collectorate Meeting Hall.
Figure 1.5: Stakeholders meeting with line departments
A website was also developed to get the objections and suggestions of the general public on the consented Master Plan. Then Hon’ble Minister for Youth Welfare and Sports Development inaugurated the website on 11.02.2024. (Figure 1.6). Subsequently, a stakeholders’ meeting on the consented Master Plan was conducted on 08.03.2024, at the District Collectorate Meeting Hall.
Figure 1.6: O&S Inauguration
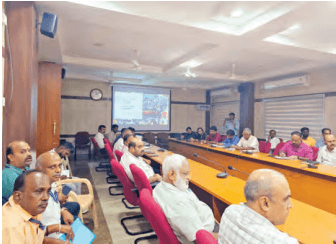
In particular, stakeholder consultations focused on the mobility sector were conducted by the Chennai Unified Metropolitan Transport Authority (CUMTA) on 08.04.2025, (Figure 1.7) at the District Collectorate Meeting Hall, to identify traffic and transportation issues and formulate proposals. Finally, a Detailed Development Plan meeting was held from
02.05.2025 to 03.05.2025, at the Corporation Office Meeting Hall. The objections and suggestions received through online and offline, were scrutinized and duly incorporated into the Final Master Plan, further enhancing transparency and public involvement in the planning process.
Figure 1.7: Stakeholders meeting with line departments and CUMTA
1.7.6Planning Proposals
The master plan’s proposals aim to address existing gaps and support sustainable urban growth. First, it studies current issues—like land use, infrastructure, transport, and environment—to find what’s lacking. Then, it suggests solutions: better zoning, more housing and commercial spaces, improved transport, and smart city projects, including eco-friendly initiatives on renewable energy and waste management.
For Coimbatore Master Plan 2041, the focus is on making the city a strong manufacturing and IT hub, upgrading transport, and improving public facilities—all while protecting the environment. These proposals ensure balanced growth, making Coimbatore a resilient, inclusive, and economically strong city for the future.
1.7.7Report Structure
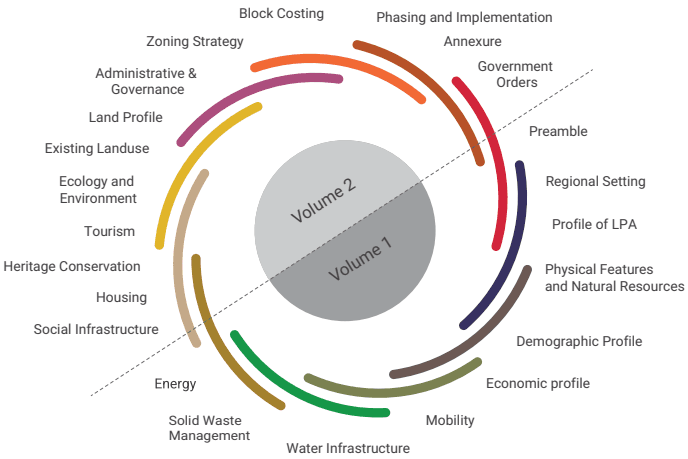
The Second Master Plan 2041 is organised in five volumes and a set of existing and proposed land use plans. The main report is covered in volumes I & II. The schedule, giving the details of land use proposed in each of the survey numbers of the LPA is given in volume III, IV and V. The chapterisation of the main report is given below:
Figure 1.8: Report Structure
REGIONAL SETTING
2.1 Overview
The area of Coimbatore LPA constitutes around 32.54 % of Coimbatore district and accommodates around 74% of the population of the district. It accommodates most of the economic activities as well as critical infrastructure of the district. Coimbatore District, a key economic hub in western Tamil Nadu, spans approximately 4,723 Sq.km and is strategically positioned at 11.0168° N latitude and 76.9558° E longitude.
Administratively, the district is bounded by Nilgiris District to the north, Erode District to the northeast, Tiruppur District to the east, and Dindigul District to the southeast. To the west, it shares its boundary with Palakkad and Idukki districts of Kerala. Geographically, Coimbatore district’s landscape is majorly shaped by the Western Ghats, which form its western and northern boundaries. The Palghat Gap, a natural mountain pass, plays a vital role in connecting Coimbatore with Kerala, fostering trade and cultural ties between the two states. Within this diverse landscape, the terrain ranges from dry plains in the east to lush, forested regions in the west.
At its heart lies Coimbatore City (Kovai), the Kongunadu region’s largest urban center and Tamil Nadu’s second-largest city. Coimbatore - a tier-II hub drives innovation in textiles, manufacturing, IT, healthcare, and education, while its industrial legacy endures through its dominance in pump and motor production, supplying nearly half of India’s demand.
The district’s urban fabric extends to key towns like Pollachi and Mettupalayam, supported by the Coimbatore Local Planning Area’s structured network of municipalities, town panchayats, and villages. This blend of strategic geography, economic dynamism, and planned development cements Coimbatore’s role as a vital regional hub, bridging landscapes, industries, and communities across southern India.
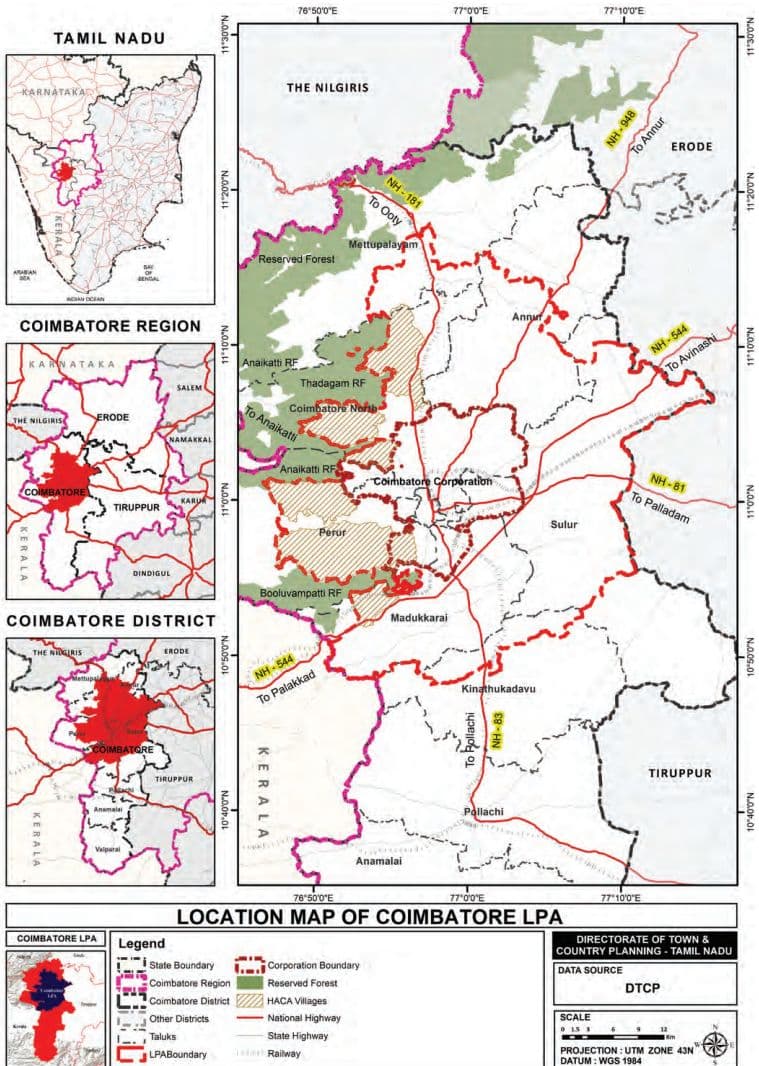
Map 2.1: Location Map of Coimbatore LPA
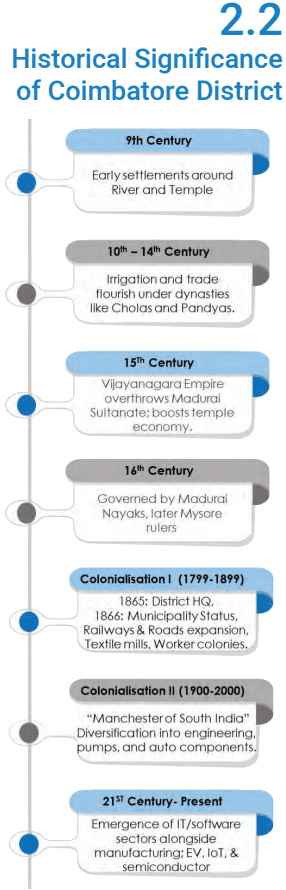
2.2Historical Significance of Coimbatore District
9th Century
Early settlements around River and Temple
10th – 14th Century
Irrigation and trade flourish under dynasties like Cholas and Pandyas.
"Manchesterof South India" Diversification into engineering, pumps, and auto components.
21ST Century- Present
Emergence of IT/software sectors alongside manufacturing; EV, loT, & semiconductor
Figure 2.1: Historical Timeline
2.2.1Historical Background
Coimbatore, originally part of the historical Kongu region, has a history dating back to the Sangam Age. Over the centuries, the region was ruled by powerful dynasties, including the Rashtrakutas, Cholas, Chalukyas, Pandyas, and Hoysalas, and later, the Vijayanagara Empire overthrew the Madurai Sultanate. Each of these rulers contributed to its growth by improving irrigation, trade, and the temple-based economy. The Madurai Nayaks governed the region before it came under Mysore rule, followed by Hyder Ali and Tipu Sultan.
Early settlements: The region’s earliest urban foundations trace back to the 9th century with established religious and agrarian communities around strategic water sources such as the Noyyal River. Temples like the Patteeswarar Temple in Perur and the Marudhamalai Temple on a Western Ghat hillock served as socio-cultural nuclei, fostering small, dispersed settlements.
However, a major shift occurred in 1799 when the British East India Company took control of Coimbatore after Tipu Sultan’s defeat in the Anglo-Mysore Wars, integrating it into the Madras Presidency.
Colonial Influence: The colonial era (post-1799) marked a pivotal shift when the British, transformed Coimbatore into a military transit hub. Colonial interventions introduced structured planning, notably in Podanur, where the first planned housing for railway employees emerged in 1799. In 1865, Coimbatore was established as the district headquarters, marking the beginning of its transformation into a major urban center. A year later, in 1866, it gained municipality status. Roads were built, and railway networks spurred linear growth along corridors like Lawley Road.
Industrial Growth and Spatial Transformation: Post-1880s industrialization has reshaped spatial dynamics- textile mills like CS&W Stanes (1887) and Laxmi Mills (1910) anchored
worker colonies, densifying areas such as Sukrawarpetta and Race Course.
By the 1930s, Coimbatore regions morphology transitioned from fragmented agrarian settlements to a cohesive industrial-administrative hub, with clusters around mills, railways, and colonial elite spaces like the Cosmopolitan Club (1914). This phased growth underscores the interplay of cultural heritage, colonial infrastructure, and industrial capitalism in shaping the city’s urban identity.
Industrial diversification and economic expansion: Following India’s independence in 1947, Coimbatore witnessed industrial diversification beyond textiles. Between the 1950s and 1970s, the city experienced the rise of small and medium-scale industries, particularly in engineering, pumps, motors, and auto components. By the 1980s and 1990s, rapid urbanization facilitated advancements in education, healthcare, and commerce. The early 20th century marked the emergence of Coimbatore as a prominent textile hub, fuelling industrial growth and economic expansion in Coimbatore. The 21st century saw further diversification, with information technology (IT) and software industries gaining prominence alongside the well-established manufacturing and textile sectors.
Thus, Coimbatore district’s transformation from an ancient trading centre to a modern industrial city reflects its resilience and sustained economic progress.
2.2.2Administrative Background and Chronological Change
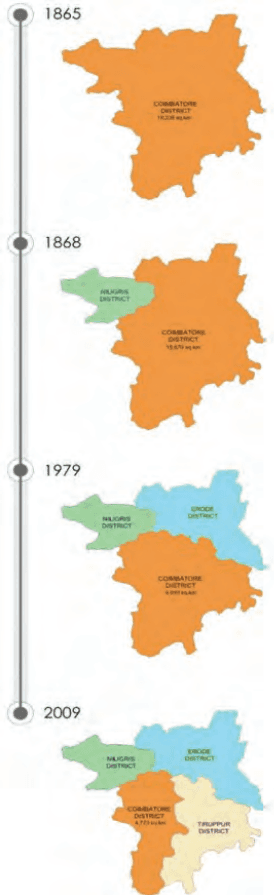
Coimbatore district’s journey from a sprawling agrarian territory to a compact economic dynamo is a testament to strategic administrative foresight. Originally encompassing 18,235 sq. km—a vast swath that included present-day Erode, Nilgiris, and Tiruppur—the district’s boundaries were reshaped over time to align with evolving economic priorities and governance needs.
Strategic Bifurcations of Coimbatore District:
1868 – Nilgiris Bifurcation: Carved out to conserve the ecologically fragile Western Ghats and promote tourism, this bifurcation allowed Coimbatore to shed its resourceextraction role and focus on industrialization.
Figure 2.2: Chronological Change
1979 – Erode’s Formation: As an agrarian stronghold (turmeric, dairy, handlooms), Erode’s creation strengthened cross-district supply chains, feeding Coimbatore’s textile mills with raw materials.
2009 – Tiruppur’s Emergence: India’s knitwear capital absorbed textile manufacturing, freeing Coimbatore to pivot to advanced sectors like engineering, IT, and education.
These administrative realignments reduced Coimbatore district footprint by 74% (to 4,732 sq. km), transforming it from a diffused agrarian-territorial entity into a concentrated urban-industrial hub. Yet, this spatial compression did not diminish its regional economic influence. Instead, it amplified synergies with neighbouring districts. Coimbatore along with the Nilgiris, Erode and Tiruppur evolved as specialized nodes in industries, eco-tourism, agriculture and textiles, creating an interconnected ecosystem where each district complimenting strength of one another.
2.2.3Evolution of Settlement Pattern in Coimbatore District
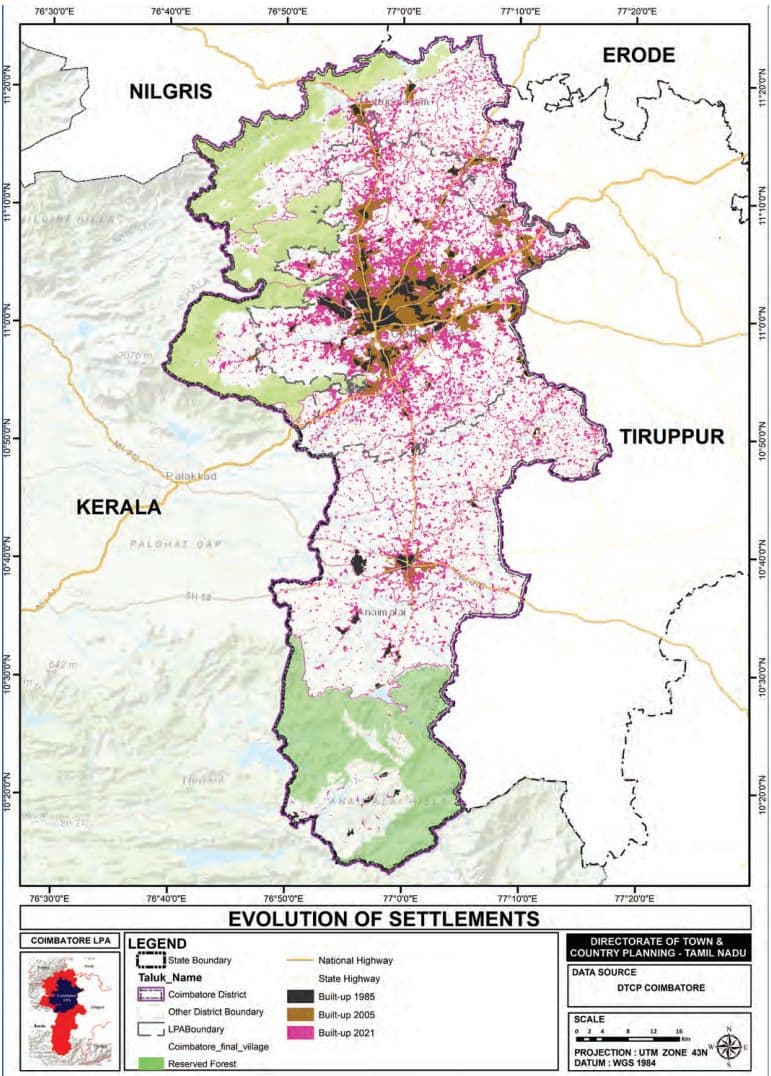
The transformation of settlements in Coimbatore District, Map 2.2 illustrates a significant shift in the urban landscape from 1985 to 2021. The district has evolved from a monocentric city into a polycentric urban region characterized by multiple nodes.
1980s – Monocentric Urban Fabric: Urbanization clustered around Coimbatore City’s colonial-industrial core, predominantly within current Coimbatore South Taluk and with sparse development elsewhere. The Noyyal River and Western Ghats constrained urban sprawl, while emerging industries dotted around Sukrawarpetta and Peelamedu.
• 2000s – Radial Urban Expansion: Growth exploded along major highways (Avinashi Road and Sathyamangalam Road), creating ribbon developments. Peelamedu and
Saravanampatti emerged as education-tech hubs, while Podanur and Sulur areas industrialized.
2020s – Polycentric Urban Fabric: Infill development merged northern and southern zones into a continuous urban fabric. The dispersed growth along Avinashi Road and Sathyamangalam Road transitioned into a more continuous urban fabric. Specialized nodes that have emerged include-
North: IT parks
South: Auto clusters and logistics hubs.
West: Wellness tourism near Western Ghats and universities (e.g., Tamil Nadu Agricultural University).
East: Industries and Institutions
Thus, the settlement transformation has been shaped by industrial growth, infrastructural expansion, and the constraints imposed by natural features such as the Noyyal River and the Western Ghats.
Map 2.2: Evolution of Settlements
2.3 Natural Setting of Coimbatore
The Coimbatore region’s diverse physiography— ranging from the undulating hills in the west to the gentle eastern plains—shapes its climate, sustains rich biodiversity, and supports agriculture as well as human settlements. This dynamic interplay of terrain, weather systems, and natural resources makes Coimbatore a region of both environmental significance and scenic grandeur.
Physiographical Setting: The region’s terrain transitions dramatically from the rugged peaks of the Western Ghats in the west—home to Doddabetta Peak (2,637 MSL)—to the fertile plains in the east, with elevations ranging between 300–2,000 MSL. This varied topography supports distinct soil types, including red loamy soils and black cotton soils in the plains and lateritic soils in hilly zones. Coimbatore’s moderate tropical climate, with summer temperatures averaging 30.1°C and winter lows around 18°C, is influenced by monsoon systems, and yields an annual average of 700 mm rainfall.
Ecological Richness: Forest and Eco-sensitive areas: The western border of Coimbatore is dominated by lush forests, approximately covering 28.48% of the district, including protected areas like the Anamalai Tiger Reserve and Indira Gandhi Wildlife Sanctuary. These forests harbor endangered species such as Nilgiri Tahr, Elephants and Liontailed Macaques and is a UNESCO World Heritage-listed site. While urban expansion poses a threat, HACA regulations and Eco-Sensitive Zones (ESZ) protections help mitigate unsustainable development, preserving Coimbatore’s critical ecosystems.
Water Resources and River Basins: Coimbatore’s hydrology is sustained by three major river basins—Bhavani, Noyyal, and Amaravathi—along with reservoirs like Siruvani Dam and urban lakes such as Singanallur and Sulur. Wetlands like Ukkadam and Valankulam enhance groundwater recharge and biodiversity.
Thus, Coimbatore’s natural setting is a mosaic of ecological wealth and physiographic complexity. Balancing urban growth with the conservation of its forests, wildlife corridors, and water systems remains pivotal to ensuring the region’s environmental resilience and sustainable development.
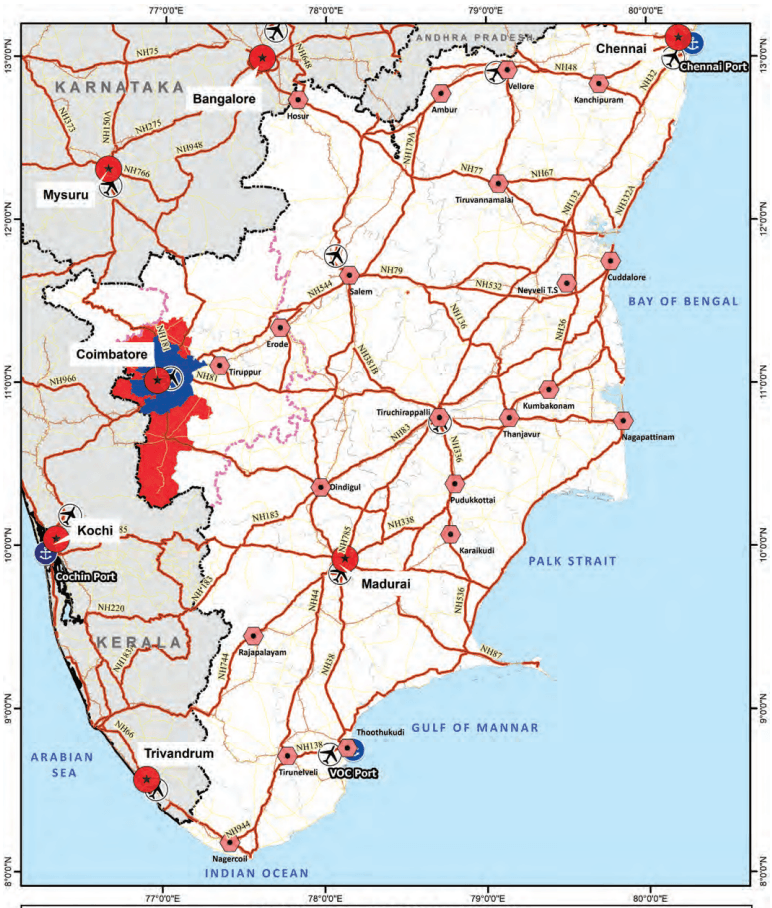
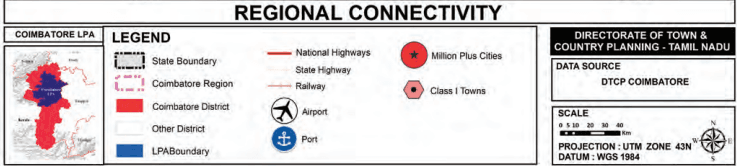
Map 2.3: Regional Connectivity
2.4 Connectivity and Regional Linkages
Coimbatore serves as a pivotal node in South India’s road network, bridging the state with Kerala, Karnataka, and Andhra Pradesh. Its well-established transport network, consisting of road, rail, air, and logistics infrastructure, strengthens regional trade, commerce, and mobility.
2.4.1Road Connectivity
Regional Integration & Pan India Linkages
Coimbatore’s significance lies in its being at the crossroads of key economic corridors. NH 83 connects the city to Pollachi (45 km) and Madurai (211 km) integrating western Tamil Nadu with the agriculturally rich southern regions. This corridor further facilitates the movement of goods, from Coimbatore’s industrial hubs to the port city of Thoothukudi. To the North, NH 181 ties Coimbatore to Udhagamandalam (Ooty, 85 km) and Mysore (199 km), fostering tourism and cross-border trade with Karnataka. To the West, NH 544 connects Coimbatore to Palakkad (52 km).
Coimbatore’s road connectivity extends beyond regional linkages, integrating seamlessly into India’s Golden Quadrilateral (GQ) network—the country’s most critical highway system connecting Delhi, Mumbai, Chennai, and Kolkata.
The NH 544, the city’s vital north-south corridor, merges with NH 44 (part of the GQ), creating a pan-India arterial route that links Coimbatore to major economic hubs like Hyderabad and Delhi. For Kerala-bound traffic, this highway extends toward Kochi and Thiruvananthapuram enabling cross border movements. Additionally, the highway offers direct connectivity to Salem and Chennai (506 km), enhancing access to Tamil Nadu’s capital and its eastern Ports.
The NH 948 connects Coimbatore to Bengaluru (363 km) and links further to Mumbai via NH 48, which is another critical component of the Golden Quadrilateral. This strategic alignment positions Coimbatore with the Chennai-Bengaluru-Mumbai Industrial Corridor (CBMIC), offering the industries in and around the Coimbatore city, a greater access to national and international markets.
As a result, the Coimbatore region emerges as a critical stopover for goods transported between southern and western/northern markets, enhancing its role in national
supply chains. This robust infrastructure of National Highways (NH) and State Highways (SH) not only enhances intra-state mobility but also strengthens interstate and pan-India economic and social linkages.
2.4.2Rail Connectivity
Coimbatore is located on the Chennai–Coimbatore– Kochi trunk route, a vital part of the Southern Railway’s broad-gauge network. The Palghat Gap in the Western Ghats enhances this connectivity by enabling seamless rail movement between Tamil Nadu and Kerala. This corridor links Coimbatore with Chennai’s port and industrial hubs, extends towards Bengaluru, and integrates into the Bengaluru–Mumbai Rail Corridor while also aligning with Salem, Erode and Tiruppur. Westward, it connects to Kochi and the International Container Transshipment Terminal (ICTT) at Vallarpadam.
Coimbatore Junction serves as the primary rail hub, while Podanur Junction and its freight yard handle industrial cargo bound for ports like Chennai, Kochi, and Thoothukudi. Suburban stations such as Coimbatore North, Peelamedu, Irugur, and Sulur Road, further strengthen local mobility and regional freight movement, reinforcing Coimbatore’s role as a major rail node in South India.
2.4.3Air Connectivity
Coimbatore International Airport (CJB), situated on the Avinashi Road, serves as a crucial aviation hub, facilitating both passenger travel and cargo movement. The airport plays a vital role in enhancing business, tourism, and trade, significantly contributing to the economic growth of the region.
International Connectivity: Coimbatore International Airport maintains global trade and travel links with major international destinations such as Singapore, Sharjah, Jeddah, and other cities in Saudi Arabia.And also connected to key locations in Europe, the USA and other major Southeast Asian countries through stop over linkages.
Domestic Connectivity: The airport provides seamless connectivity to major Indian cities, including Mumbai, Delhi, Indore, Kolkata, Bengaluru, Chennai, Hyderabad, Ahmedabad, and Pune, ensuring efficient movement of passengers and goods.
Identified as a special node to play a major role in the States’ vision to emerge as a One Trillion Dollor Economy by 2030, Coimbatore airport is envisaged for expansion in passenger as well as cargo handling capacities. This would strengthen its global connectivity further and enhance its commercial role significantly.
2.4.4 Water Transport Connectivity
Although Coimbatore District lacks direct water transport, it relies on nearby seaports for trade and exports. Cochin Port (approximately 200 km away) handles machinery, textiles, and engineering goods, while Tuticorin Port (approximately 350 km away) supports bulk cargo transport. Mangalore Port (approximately 400 km away) also facilitates exports from the city’s manufacturing sector. Logistics hubs, including dry ports and inland container depots, ensure efficient cargo movement to these ports.
2.4.5Cargo and Logistics
Coimbatore region owes its economic dynamism to a robust logistics ecosystem strategically integrated with national and regional connectivity corridors. Coimbatore’s industrial expertise in textiles, automotive, and electronics is anchored by an efficient logistics network comprising key highways such as NH 544, NH 948 and NH 181 where it hosts concentrated logistics parks and warehouses, enabling seamless cargo movement.
Complementing this, rail freight alleviates road congestion for bulk transport, while Coimbatore International Airport accelerates high-value exports like precision machinery, textiles, medical equipment, and perishables.
This logistical efficiency is further amplified by Coimbatore’s role in South India’s transformative regional corridors, positioning it as a critical node in the industrial and defence landscape. The Tamil Nadu Defence Industrial Corridor (TNDIC) leverages the district’s engineering expertise to bolster aerospace and defence manufacturing alongside Chennai and Hosur. The extension of Chennai–Bengaluru Industrial Corridor (CBIC) to Kochi via Coimbatore would enhance cross-state trade, linking Tamil Nadu’s industrial heartland to Karnataka and Kerala’s economic centres. The Chennai – Kanniyakumari Industrial Corridor (CKIC) in the vicinity would integrate Coimbatore
2.5 Coimbatore District Profile
with southern Tamil Nadu’s industrial nodes, fostering regional supply chain synergies.
Together, these linkages solidify Coimbatore’s stature as a logistics gateway, driving industrialization, reducing operational costs, and embedding the district into global value chains.
2.5.1Administrative Boundaries and Jurisdiction
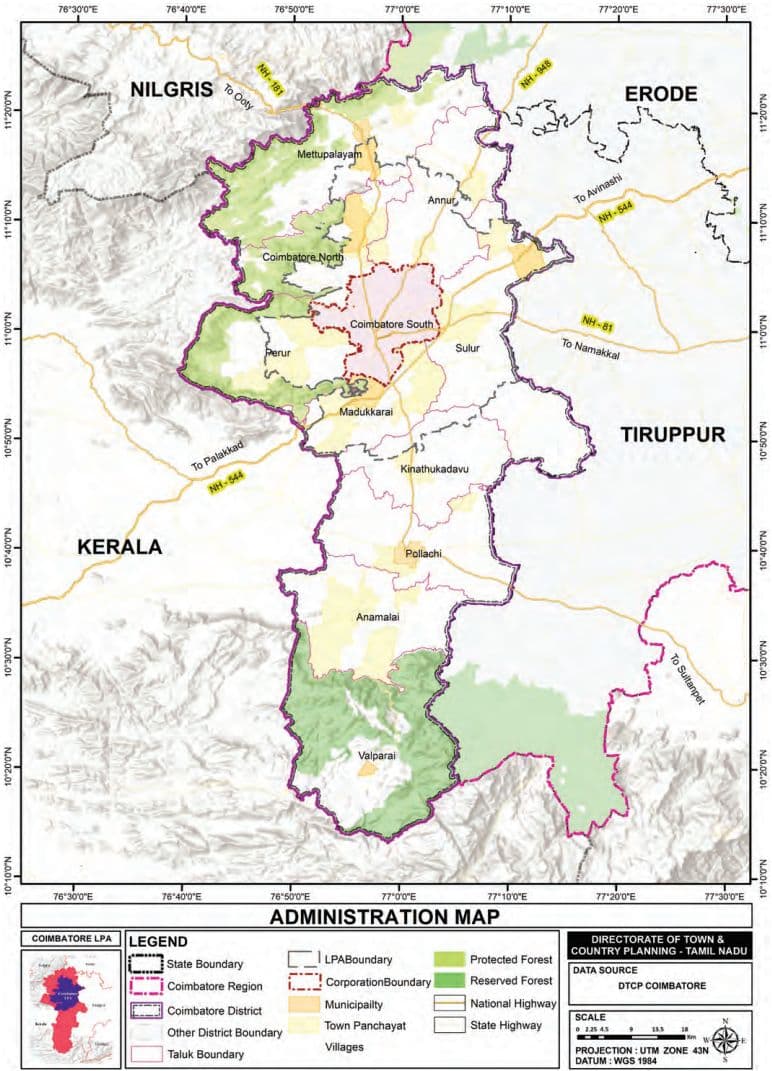
Coimbatore district is structured with an effective governance and service system across its urban and rural areas. The district is divided into three revenue divisions, which are further subdivided into eleven taluks in total.
Coimbatore North Revenue Division includes the taluks of Coimbatore North, Annur, and Mettupalayam.
Coimbatore South Revenue Division covers Coimbatore South, Perur, Madukkarai, and Sulur taluks.
Pollachi Revenue Division encompasses the taluks of Pollachi, Kinathukkadavu, Anaimalai, and Valparai.
Urban governance: The Coimbatore is the headquaters of Coimbatore district and Coimbatore City Municipal Corporation is the main body overseeing the city’s administration. In addition, Seven Municipalities in the Coimbatore district manage key towns within the district, viz. Mettupalayam, Karamadai, Gudalur, Karumathampatti, Pollachi, Valparai and Madukkarai.
These administrative divisions ensure smooth functioning of both urban and rural areas, catering to the diverse needs of Coimbatore’s population.
2.5.2Urban and Rural Profile
Over 75.73% of the Coimbatore district’s population resides in urban areas—a figure starkly higher than Tamil Nadu’s average (48.4%) and India’s National average (31.2%). This urbanization surge is anchored in urban hubs like Coimbatore City (a municipal corporation), Mettupalayam, Karamadai, and Madukkarai wherein high population density coexists with advanced infrastructure.
Map 2 4: Administration Map of Coimbatore District
Sub-Regions like Pollachi (renowned for coconut groves and banana cultivation), Anaimalai (spice plantations and dairy farming), and Kinathukadavu (agriculture and livestock) exemplify rural agrarian prosperity.
Coimbatore’s urban and rural profiles are not a binary but a continuum. While urban zones leverage industrialization to attract migration and investment, rural areas supply essential agricultural produce and raw materials—such as cotton for textiles or milk for dairy cooperatives—creating a significant level of interdependency and complementarity.
2.5.3Economic significance of Coimbatore
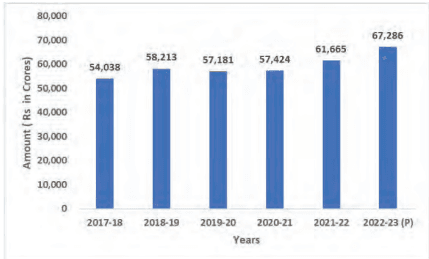
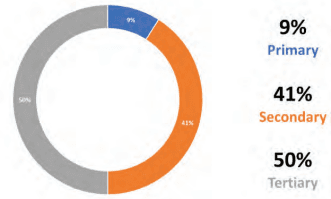
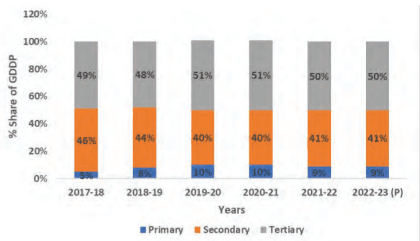
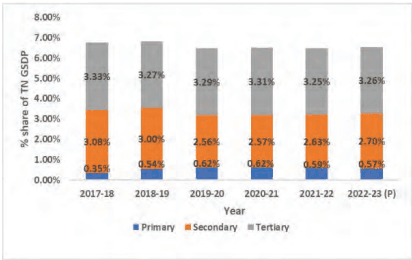
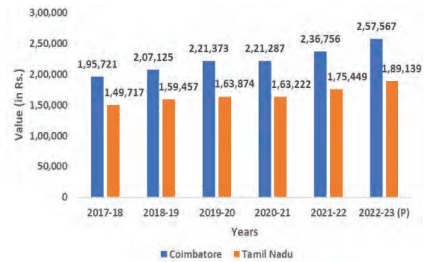
Coimbatore District holds considerable economic and regional significance in Tamil Nadu’s development landscape. Contributing 6.53% to the state’s GDDP (2022–23), it serves as a major driver of industrial, agricultural, and service sector activity in the western region. The district has a strong industrial base—particularly in textiles, machinery, and auto components—accounting for 34% of Tamil Nadu’s machinery Gross Value Addition (GVA). With increasing vibrancy in emerging sectors such as electronics, EVs, and IoT-based manufacturing, Coimbatore demonstrates a significant potential for advanced industrial diversification.
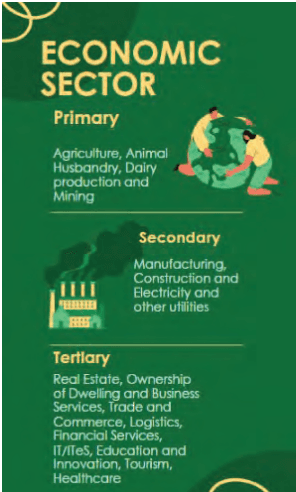
In the agricultural sector, it leads in coconut production (67% of the state share) and contributes 5% to the state’s milk output, indicating its role in rural livelihood support and agri-processing opportunities. The tertiary sector is steadily growing, supported by IT corridors, global capability centres, and tourism, particularly eco- and wellness tourism. Regionally, Coimbatore functions as a key economic hub for western Tamil Nadu, with infrastructure developments further enhancing its connectivity and growth potential.
Thus, by harmonizing its SME-driven manufacturing, agro-processing leadership, and tech-enabled services, the district presents a compelling blend of natural endowments and human enterprise, clearly reflecting the state’s ambition for rapid, sustained growth and balanced regional development.
3.1 Introduction
3.2 Administrative Setup
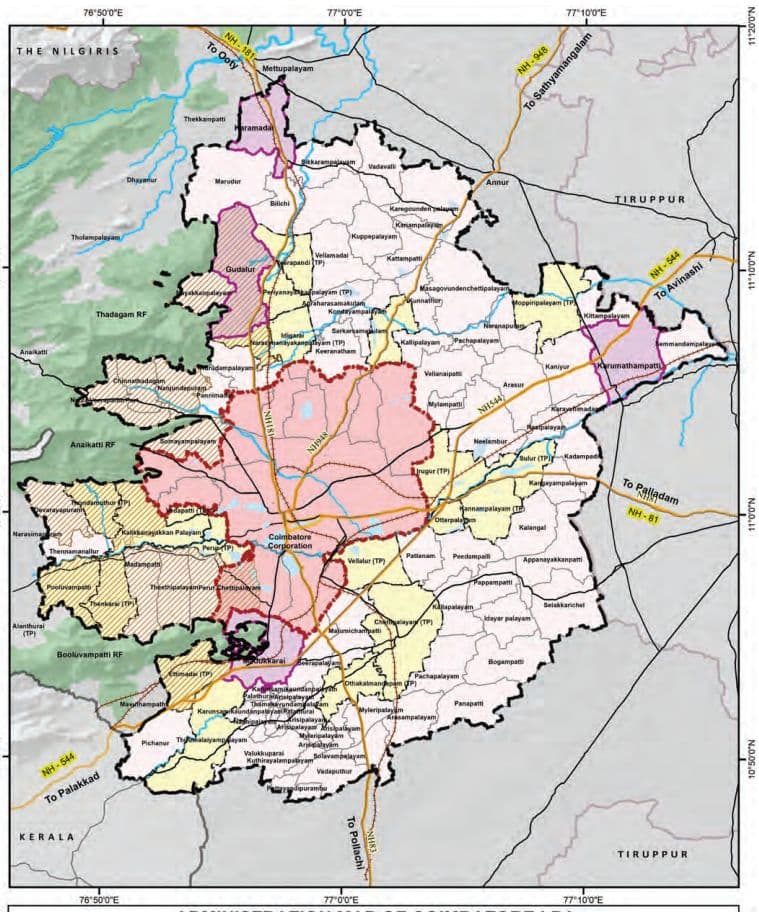
The Coimbatore Local Planning Area (LPA), henceforth referred to as the “Planning Area,” encompasses Coimbatore City Municipal Corporation and extends to include 4 municipalities, 21 town panchayats, and 66 revenue villages in its jurisdiction.
The LPA is geographically bounded by Mettupalayam Municipality and Annur Taluk to the north, Annur Taluk and Tiruppur District to the east, parts of Mettupalayam Taluk and Perur Taluk to the west, and Madukkarai Taluk and Kinathukadavu Taluk to the south. The delineation of the LPA is intended to regulate urban expansion, facilitate industrial growth, and enable environmental conservation.
The statutory framework governing the Coimbatore Local Planning Area (LPA) has evolved over time. The first master plan for the Coimbatore Local Planning Area spans over 1,286.80 sq. km, encompassing 42 revenue villages in Coimbatore Taluk and 10 revenue villages in Palladam Taluk, with a horizon period until 2011. It received government consent through G.O.Ms.No.963, Housing and Urban Development Department, dated 14.07.1987, under Section 24(2) of the Act. The Government formally approved the master plan vide G.O.Ms.No.661, Housing and Urban Development Department, dated 12.08.1994, under Section 28 of the Act.
Following the bifurcation of Tiruppur District from Coimbatore District in 2009, four villages were transferred to Tiruppur District. However, until the extended Coimbatore Local Planning Area (CLPA) was formally notified in 2014, these villages were considered within the Coimbatore LPA for planning purposes despite their administrative reclassification under Tiruppur District.
A notification for expansion of the Coimbatore LPA and for the preparation of a second master plan was issued vide G.O.Ms.No.41, Housing and Urban Development Department, dated 26.02.2014, under Section 10(1)(b) of the Tamil Nadu Town and Country Planning Act, 1971. The extension of the planning area was confirmed under Section 10(4) of the Tamil Nadu Town and Country Planning Act, 1971, through G.O.Ms.No.188, Housing and Urban Development Department, dated 25.10.2022. Accordingly,
the Coimbatore Composite Local Planning Area (CLPA) currently extends to 1531.57 Sq. km, encompassing the Coimbatore City Municipal Corporation, 4 municipalities, 21 town panchayats, along with 66 adjoining revenue villages.
The constituent administrative units of the Coimbatore Local Planning Area (LPA), including the area distribution across various administrative jurisdictions, are given in Table 3.1 and Table 3.2.
Table 3.1Administrative units and Extent of Coimbatore LPA
S. No
Administrative Category
No. of. Local Bodies
Area (in Sq. Km)
1.
Corporation
1
257.81
2.
Municipalities
4
97.56
3.
Town panchayats
21
314.93
4.
Revenue Villages
66
861.27
Total
92
1,531.57
The Coimbatore Composite Local Planning Area (CLPA) has been delineated strategically to ensure structured urban expansion, to facilitate planned infrastructure development, optimal resource utilization, enhance connectivity, and facilitate environmental sustainability.
Inclusion of settlements in LPA is influenced by their proximity to major highways such as NH 544, NH 181, etc., supporting accessibility and regional integration. Highdensity urban centers like Peelamedu, Singanallur, and their surroundings have been incorporated to accommodate infrastructure demands, while peri-urban areas such as Sulur, Vadavalli, and Thondamuthur have been incorporated to enable management of transitional growth. Economic corridors such as Avinashi Road (for IT and commercial activities), Mettupalayam Road (for manufacturing), and Sulur (for industrial expansion) played a significant role in the delineation.
By integrating urban and rural settlements, the expanded LPA facilitates a coordinated growth model that mitigates urban sprawl, strengthens regional connectivity, and enhances economic opportunities.
Table 3.2Constituent Administrative Units
S. No
Administrative Units
Area (in Sq. Km)
I
Corporation
Coimbatore City Municipal Corporation
257.81
II
Municipalities
1
Gudalur
29.91
2
Karumathampatti
26.88
3
Madukarai
21.47
4
Karamadai
19.30
Sub Total
Sub Total
97.56
III
Town Panchayats
1
Tirumalaiyampalayam
30.63
2
Chettipalayam (TP)
34.28
1. Chettipalayam
2. Oorathukuppai
3
Moppiripalayam
21.83
4
Thalaiyur (TP)
21.55
1. Kalikanayakanpalayam
2. Chitrachavadi east
3. Chitrachavadi west
5
Irugur
20.69
6
Ettimadai
16.44
7
Pooluvampatti
16.44
8
Vellalur
16.18
9
Kannampalayam
15.97
10
Ottakalmandapam
13.83
11
Thondamuthur
13.39
12
Thenkarai
12.76
13
Sarkar Samakulam
12.64
14
Veerapandi No: 4
12.35
15
Idigarai
11.39
16
Sulur
10.96
17
Periyanayakkanpalayam
9.38
18
Narasimanayakanpalayam
6.37
19
Vedapatti
6.14
20
Perur
6.11
21
Pallapalayam (Otterpalayam Village)
5.60
Sub Total
Sub Total
314.93
S. No
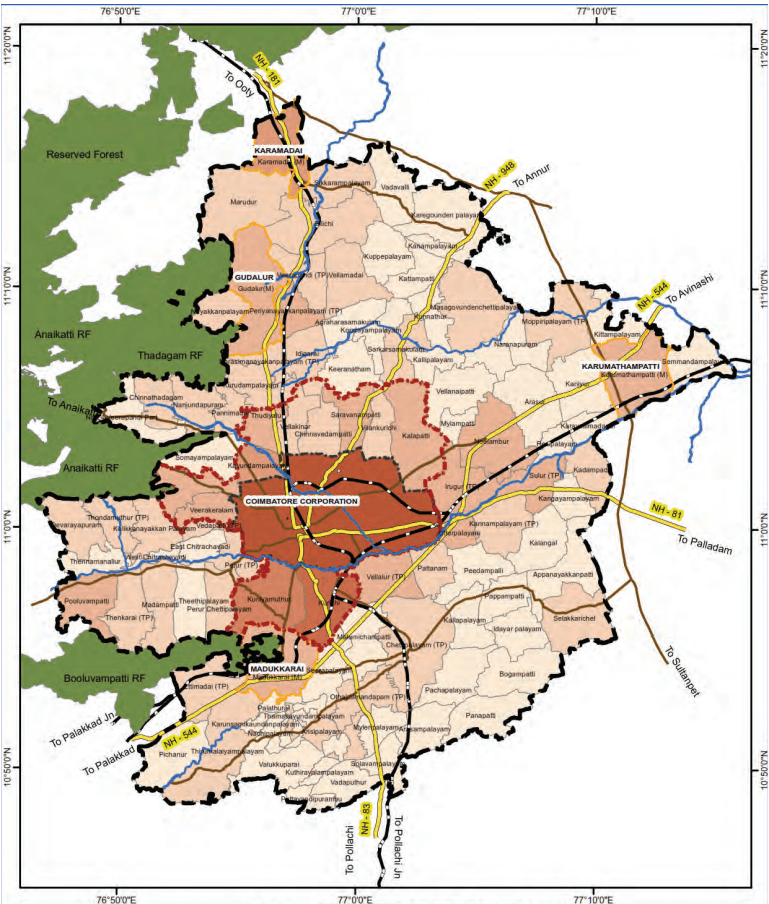
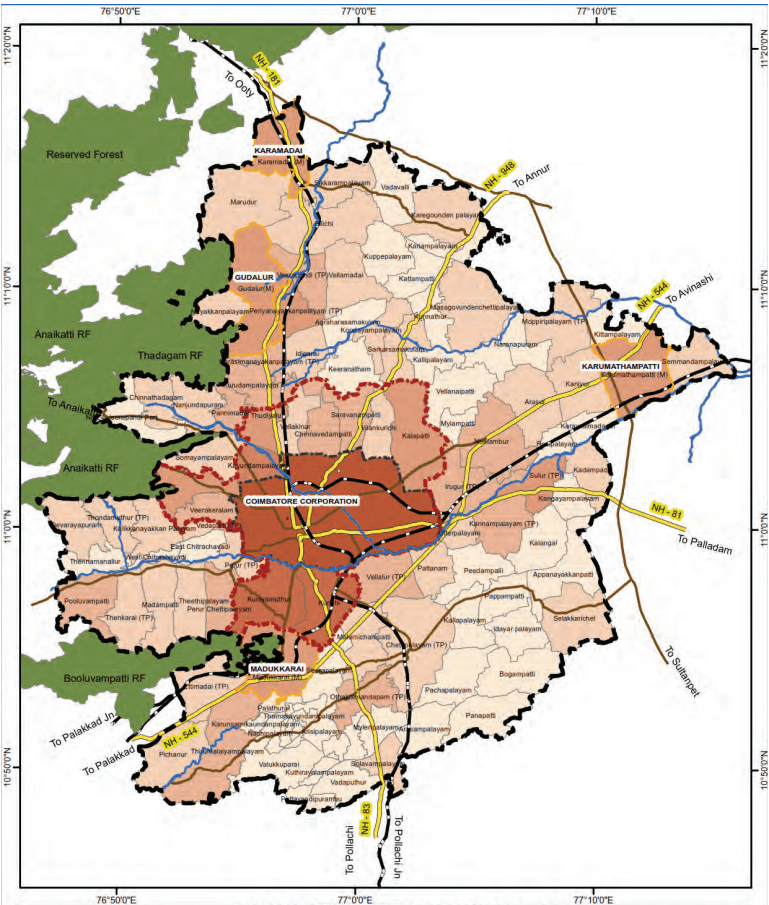
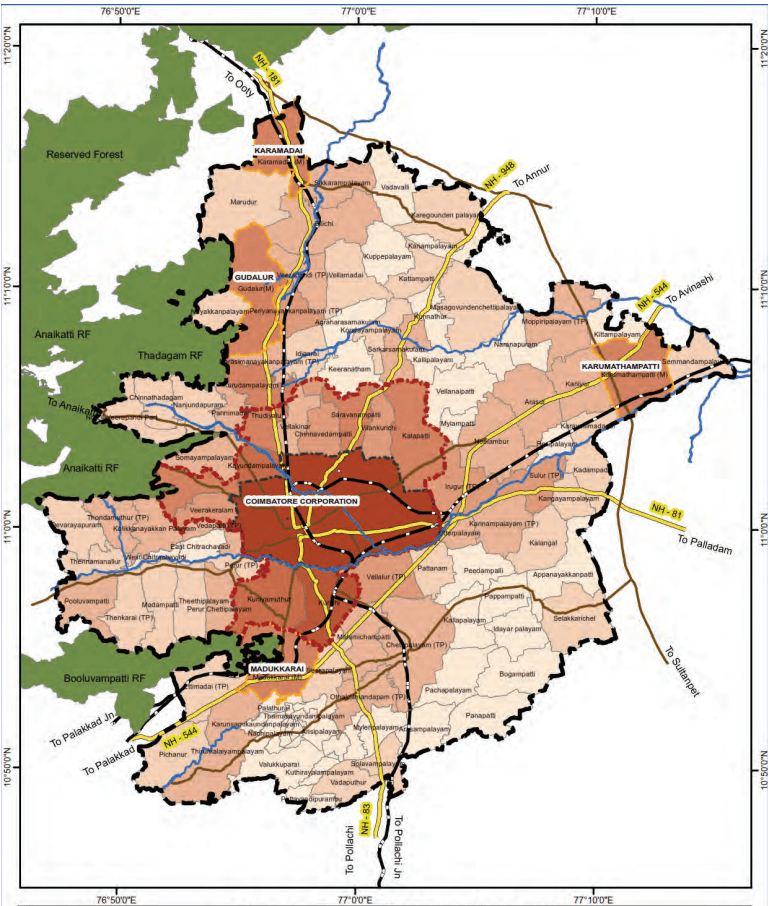
Map 3.1 : Administration Map of Coimbatore LPA
ADMINISTRATION MAP OF COIMBATORE LPA
3.3 Coimbatore City Municipal Corporation
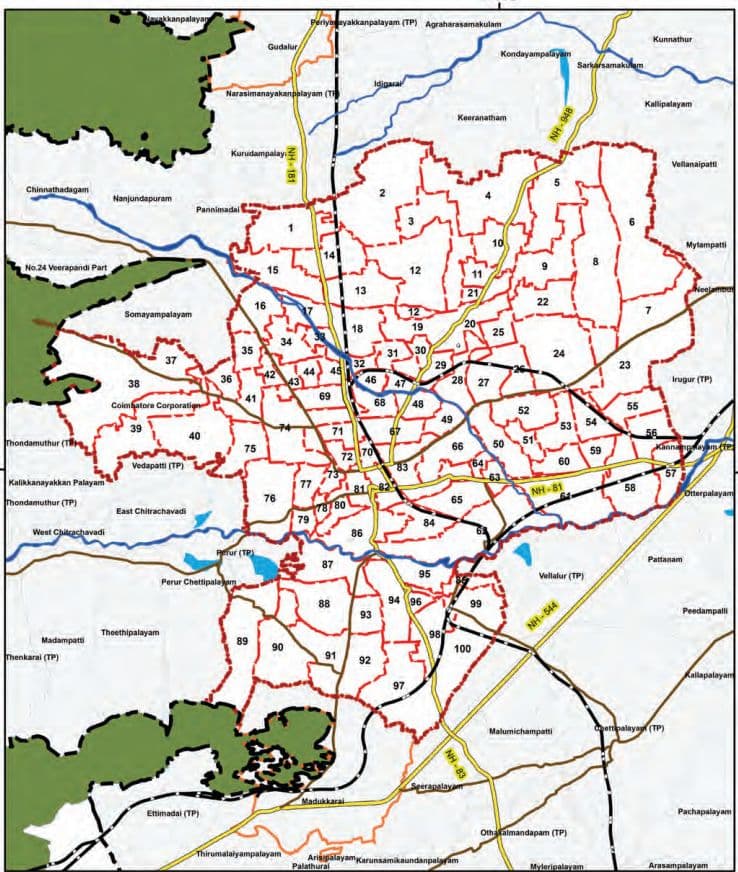
The Coimbatore City Municipal Corporation (CCMC) forms the core of the local planning area and is the governing authority responsible for managing city’s civic administration. Covering an area of 257.04 sq. km, it is the second-largest municipal corporation in the state after Chennai. With a longstanding history of urban governance, CCMC has progressively developed into one of Tamil Nadu’s key municipal bodies. It plays a crucial role in the city’s growth by managing essential services such as water supply, waste disposal, road infrastructure, and public health, contributing significantly to Coimbatore’s development.
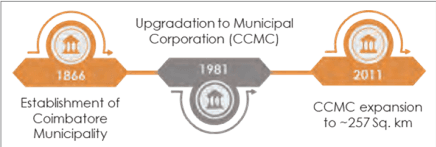
Historical Timeline: Initially established as a municipality in 1866, Coimbatore witnessed steady growth due to its thriving textile industry. As the city’s population and infrastructure demands expanded, the municipality was upgraded to a municipal corporation on December 1, 1981.
In 2011, the Coimbatore City Municipal Corporation (CCMC) expanded its jurisdiction through the annexation of Kuniyamuthur, Kurichi, and Kavundampalayam municipalities, along with seven town panchayats— Saravanampatti, Kalapatti, Vadavalli, Thudiyalur, Veerakeralam, Chinnavedampatti, and Vellakinar—and the Vilankurichi village, as a result of this expansion, the area of the corporation increased from 105 km² with 72 wards to 257.04 km² with 100 wards, as per G.O. M.S. No.140 dated 15.09.2011.
Figure 3.1: Historical Timeline of CCMC
Currently, CCMC is divided into five zones -North, South, East, West, and Central, with each consisting of 20 electoral wards. The zone-wise area distribution is detailed in Table 3.3.
In the expanded area, 11 villages: Chinnavedampatti (TP), Goundampalayam (TP), Kalapatti (TP), Kuniyamuthur (TP), Kurichi (TP), Saravanampatti (TP), Thudiyalur (TP),
Vadavalli (TP), Veerakeralam (TP), Vellakinar (TP), and Vilankurichi (CT) have not yet been reorganized into revenue wards and continue to be classified as revenue villages.
With a focus on infrastructure modernization, sustainability, and smart city initiatives, CCMC continues to drive the city’s development, positioning Coimbatore as a key economic and industrial hub in Tamil Nadu.
Table 3.3Zone wise area details of Coimbatore Corporation
S. No.
Zones
Area (in Sq.km)
1
North Zone
61.01
2
East Zone
68.54
3
South Zone
51.15
4
West Zone
45.39
5
Central Zone
30.95
Total
257.04
Source: Coimbatore City Municipal Corporation
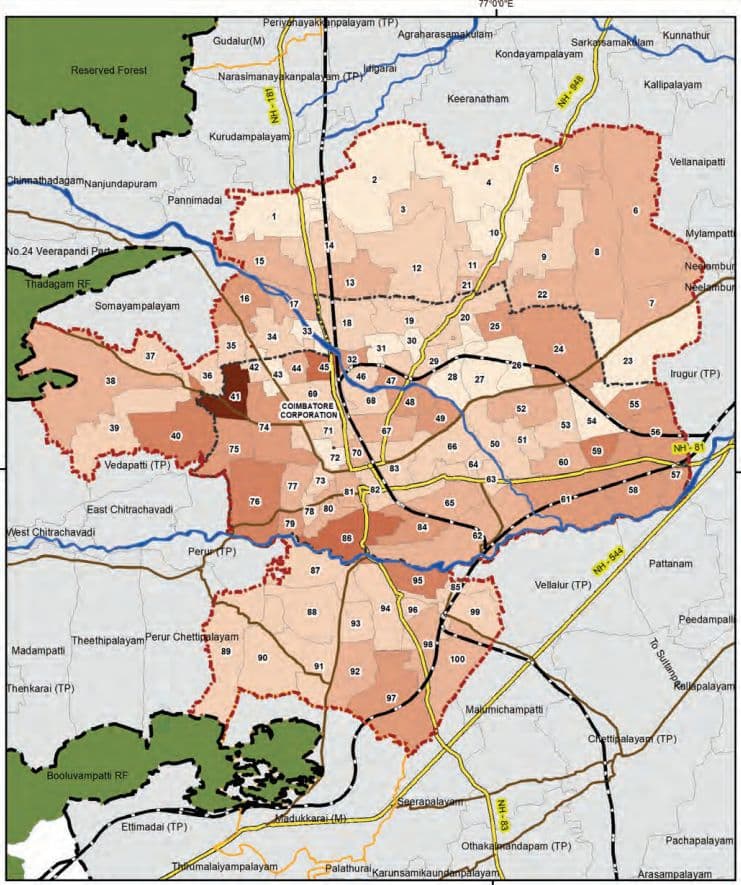
Map 3.2: Administration Map of Coimbatore Corporation
ADMINISTRATION OF COIMBATORE CORPORATION
DIRECTORATE OF TOWN & COUNTRY PLANNING - TAMIL NADU
DATA SOURCE DTCP COIMBATORE
SCALE 0 0.45 0.9 1.8 2.7 3.6 Km PROJECTION : UTM ZONE 43N DATUM : WGS 1984
3.4 Municipalities
The towns of Gudalur, Karumathampatti, Madukkarai, and Karamadai fall within the jurisdiction of the Coimbatore Local Planning Area (LPA). As per Government Order No. 67, issued by the Department of Municipal Administration and Water Supply on 11.09.2021, these towns were administratively upgraded to various grades of Municipalities, based on their respective population, infrastructure, and urban development parameters.
3.4.1Gudalur Municipality
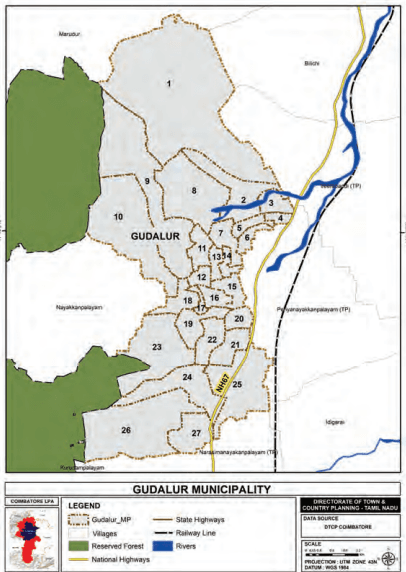
Gudalur Municipality, located approximately 20 km north of Coimbatore along the foothills of the Western Ghats, was upgraded from a Selection Grade Town Panchayat to a Municipality.
Map 3.3: Administration Map of Gudalur Municipality
Gudalur municipality currently comprises 27 wards, reflecting an administrative expansion aligned with the town’s urban growth.
Originally constituted as a Village Panchayat in 1949, Gudalur has undergone multiple phases of administrative progression—upgraded to a Second Grade Town Panchayat in 1966, a First Grade Town Panchayat in 1970, and subsequently to a Selection Grade Town Panchayat in 1982—marking its steady transformation into a prominent urban settlement.
Historically rooted in agriculture with key crops like coconut, arecanut, and plantains, Gudalur has gradually diversified into small-scale industries and commerce. Its rich cultural heritage is reflected in local temples and community institutions. Strategically located along National Highway 181 (Coimbatore–Ooty), the municipality benefits from strong regional connectivity.
3.4.2Karumathampatti Municipality
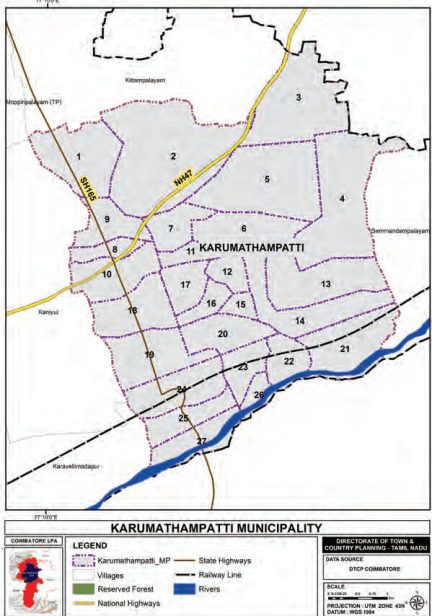
Karumathampatti Municipality, located approximately 25 km east of Coimbatore near the junction of National Highway 544 and the Karumathampatti–Annur Road, was upgraded from a Town Panchayat to a Second grade Municipality with 27 wards.
Historically, Karumathampatti has long functioned as a local trade hub, serving surrounding hamlets and villages. Located in Sulur Taluk between Coimbatore and Tiruppur, it holds economic and cultural significance.
Economically, the town has a mixed base, historically supported by agriculture and currently dominated by power looms, textile sizing units, and small-scale mills. It continues to function as a key commercial hub for nearby rural settlements, while benefiting from its proximity to major urban and industrial centers.
Map 3.4: Administration Map of Karumathampatti Municipality
3.4.3Madukarai Municipality
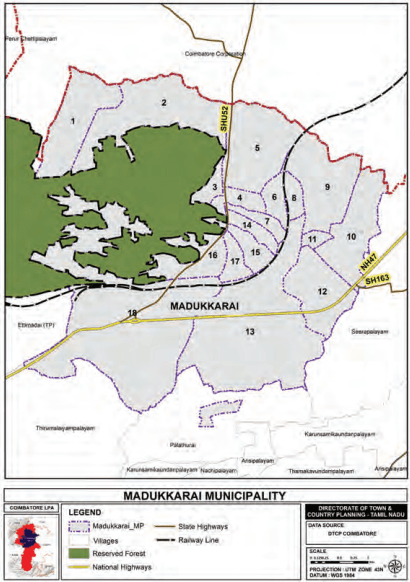
Madukkarai Municipality, situated approximately 13 kilometres west of Coimbatore city, lies along the Tamil Nadu–Kerala border near the Walayar checkpoint. It was elevated from a Special Grade Town Panchayat to a Second Grade Municipality. The municipality currently comprises 27 wards (as depicted in the Map 3.5, it comprises 18 wards when it was a Town Panchayat before it’s current upgradation).
Map 3.5: Administration Map of Madukkarai Municipality
Historically part of the Kongu Nadu region, Madukkarai gained significance due to its limestone quarries, which led to the establishment of Madukkarai Cement Works in the 1960s, marking a key phase in the town’s industrial development.
Positioned along National Highway 544 (Coimbatore– Palghat), Madukkarai benefits from its location on the key transit corridor facilitating interstate trade.
3.4.4Karamadai Municipality
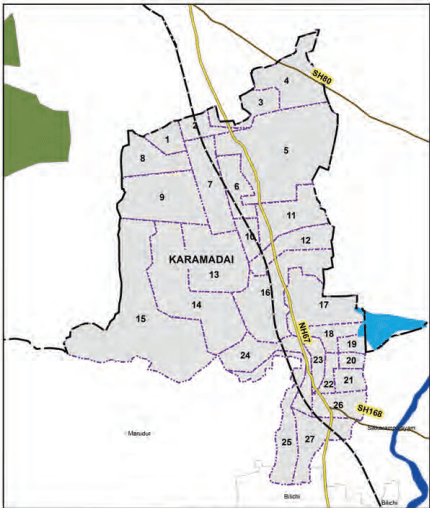
Karamadai Municipality, located 25 km north of Coimbatore,was upgraded from a Town Panchayat to a Municipality. The municipality now comprises 27 wards, an increase against the 18 wards recorded in the 2011 Census.
Historically inhabited by tribal settlements, Karamadai has evolved into a religious and economic center. The Ranganathaswamy Temple and Nanjundeswarar Temple are significant landmarks, contributing to the town’s cultural heritage. Situated along National Highway 67 (Coimbatore– Ooty), Karamadai is well-connected to neighboring areas.
Traditionally reliant on agriculture, with major crops including tapioca, sugarcane, and banana plantations, the local economy has recently diversified into tourism and allied sectors. The presence of the former industrial giant - Sri Ramakrishna Steel Industries played a major role in the town’s industrial prominence.
Map 3.6: Administration Map of Karamadai Municipality
PHYSICAL FEATURES AND NATURAL RESOURCES
4.1 Introduction
The physical features of any region set the backdrop for the developmental potential and an understanding of these enable integration of the environmental components in evolving urban development and growth strategies for the region. A variety of aspects such as soil type, composition of rocks and minerals, types of landforms, topography, climatic aspects, disaster vulnerability, water resources and details of the biodiversity constitute the environmental character of any region. This section delves deep into such aspects to gain an understanding to evolve appropriate growth strategies for the city through effective integration of potential with envisaged initiatives.
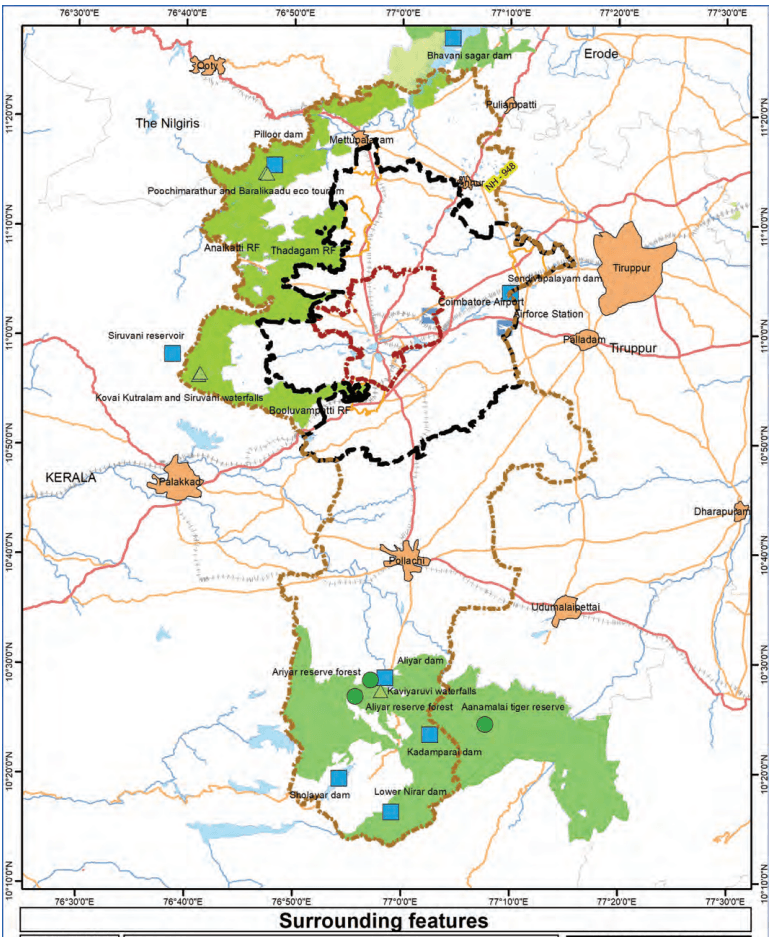
Coimbatore is situated at the foothills of the Western ghats near the Nilgiris. Coimbatore’s climate and biodiversity are significantly influenced by its geographic location. This city is characterized by a diverse range of natural features such as forests, waterfalls, dams and eco-tourism facilities. The major reservoirs include Bhavani sagar dam, Pillur dam, Siruvani reservoir and waterfalls, Sendivapalayam dam, Aliyar dam, Sholayar dam and Lower Nirar dam. Poochimarathur and Baralikaadu eco-tourism facilities are located in Thadagam and Anaikatti reserve forests located on the western side of the Coimbatore LPA and the Ariyar reserve forest and Anamalai tiger reserve are situated towards the southern end of the Coimbatore district. Additionally, Nilgiris Biosphere, a biosphere reserve recognized by UNESCO, is located approximately at a distance of 20-25 km towards the north-eastern side of the Coimbatore LPA. The Noyyal river, with check damns like the Orathuppalayam dam, aids in water management, while major urban lakes such as Valankulam, Periyakulam and Singanallur contribute to water retention and ecological balance.
The presence of such a diverse range of natural features in and around the city highlights the importance of integration of environmental conservation as an important component of the growth strategies.
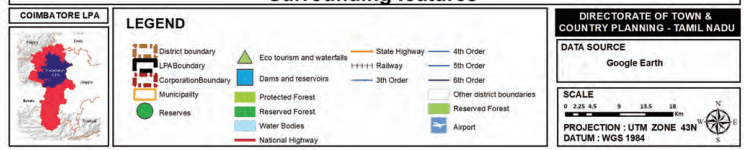
Map 4.1: Natural Features Surrounding Coimbatore LPA
4.2 Topography
Topographic studies focus on the representation of the surface features within the selected area. The components included in the topographic studies focus on the elevation and slope of the selected area. This study provides insights into the details required for the alignment of infrastructure planning with the natural features of the region.
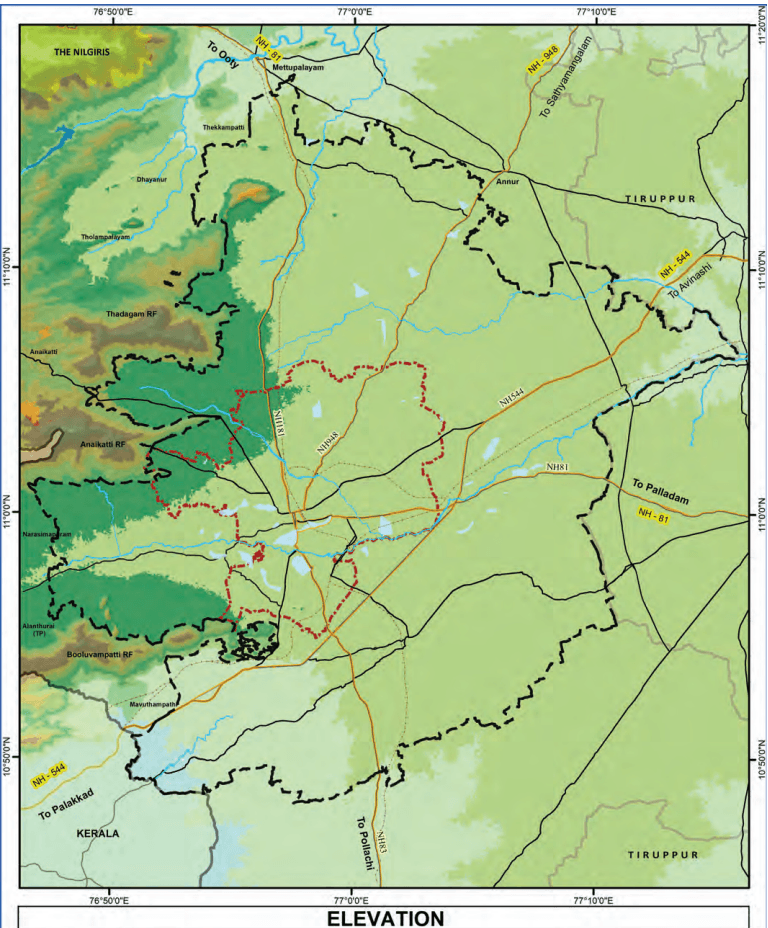
The LPA elevation map (Map 4.2) depicts elevation variations within the CLPA using data from the United States Geological Survey (USGS) - Shuttle Radar Topography Mission (SRTM). Elevation ranges are color-coded to highlight lowlying eastern and southern areas (201m), midlands including Coimbatore Municipal Corporation (401m), and high-range mountainous regions in the west (up to 1980m).
The elevation surface levels show a diverse variation in terms of the height from the mean sea level (MSL) ranging from 85m to 1980m. A major portion of the region falls in the range of 201m to 600m. The surface elevation levels are observed to be relatively high towards the north western and southern parts of the city (Map 4.2).
Map 4.2: Elevation Map
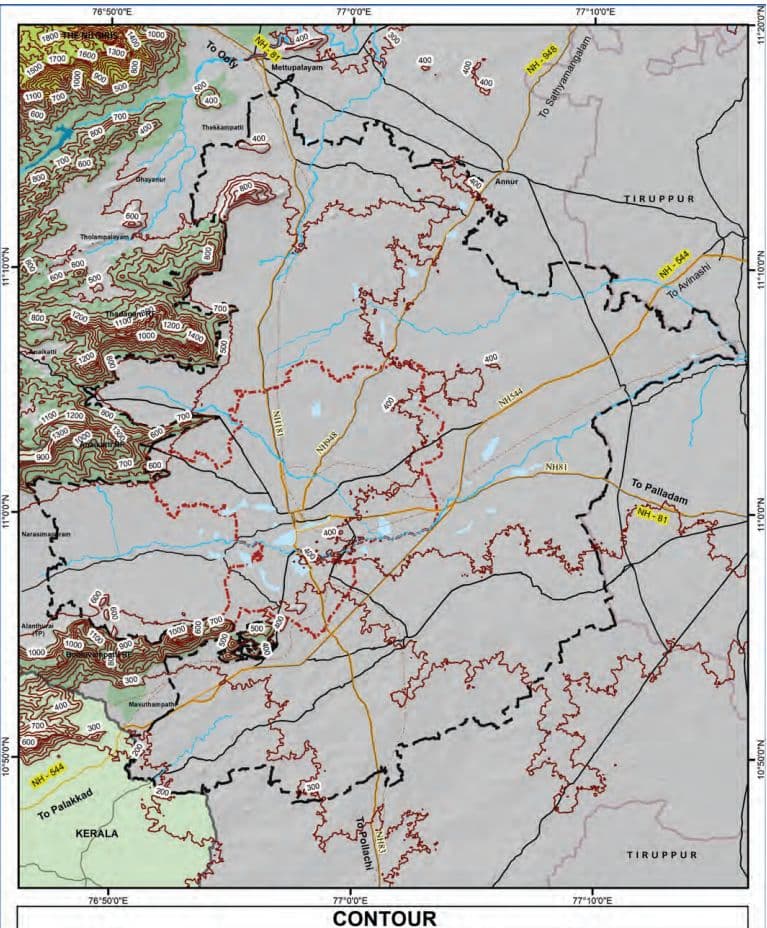
Map 4.3: Contour Map
4.3 Soil type
The contour features reveal prevalent slopes toward the west and southwest of the LPA, forming the base region of the Western Ghats. In contrast, the majority of the area within the LPA, including the CCMC, is relatively flat, making it suitable for development activities with minimal terrain alteration.
The slope direction is primarily observed towards south-west and west directions of the region. The predominant area consists of relatively flat terrain while a steep surface is observed towards northwest and southern directions at the Western Ghats region.
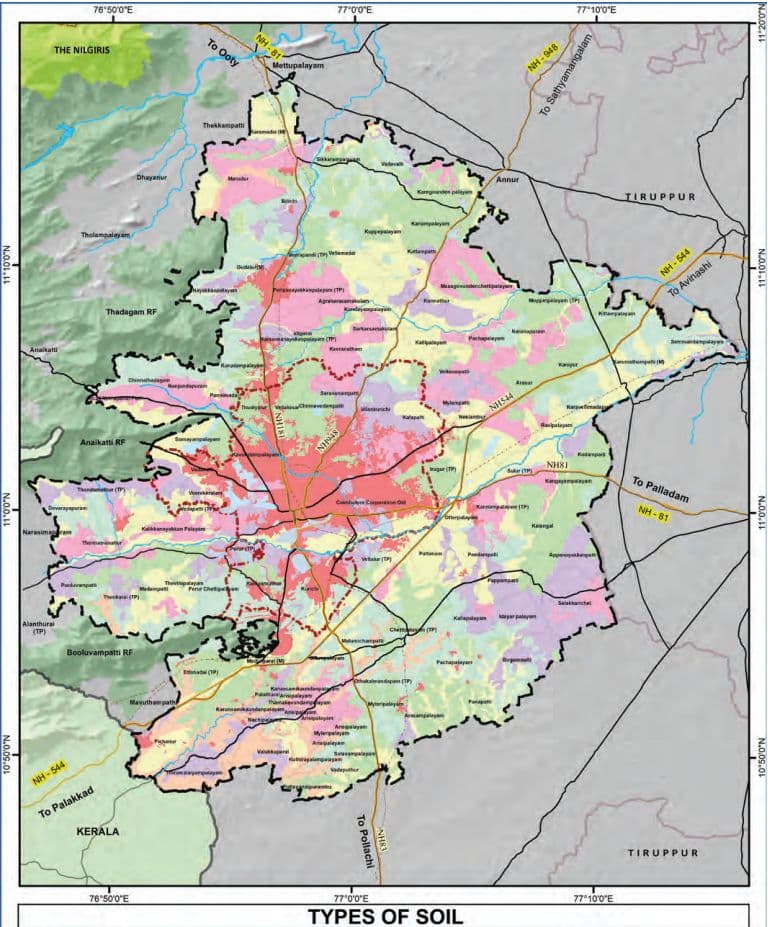
Based on the texture and proportion of minerals, soil types found within the Coimbatore LPA have been classified. The various soil types found are clay, clay loam, loamy sand, sand, sandy clay, sandy clay loam and sandy loam. The distribution of soil types within the Coimbatore LPA region is shown in Map 4.4.
The clay and clay loamy soils are primarily prevalent in the south-east with scattered patches in the central, northern parts and on the west in the foothills area of the LPA while. The sandy clay soil is noticed in the north east and eastern parts of the LPA while sandy loam soil is more prevalent in the southern part of the LPA.
The soil type map (Map 4.4) showcases the distribution of soil types within the CLPA, influencing agricultural potential and urban development suitability.
A diversity of soil types exists, reflecting the region’s geology, topography, and climate.
Table 4.1Major Soil Types within Coimbatore LPA
Soil Type
Description
Characteristics & Significance
Red Soil
Predominantly found in the central and eastern parts of the LPA
Low in nitrogen, humus, and phosphorus but rich in iron oxide giving it the red color. Generally well-drained. Suitable for crops like groundnut, cotton, and millets with irrigation. Presents stable foundation conditions for construction.
Black Soil
Occurs in patches, usually in the northern and south-western parts.
High clay content, good water retention capacity, but can become sticky when wet. Rich in iron, lime, calcium, and magnesium carbonates but low in nitrogen and phosphorus. Ideal for cotton, sugarcane, and oilseeds. Can pose challenges for construction due to its swelling and shrinking properties.
Alluvial Soil
Found along the riverbeds of Noyyal River and its tributaries.
Fertile soils enriched with sediments deposited by the river. Rich in potash and phosphoric acid, making them suitable for a variety of crops like paddy, vegetables, and fruits. These soils are prone to flooding during monsoon seasons and are therefore unsuitable for heavy construction without proper flood control measures.
Lateritic Soils
Primarily found in elevated regions, especially towards the western border near the Ghats.
Formed under high rainfall conditions, these soils are rich in iron and aluminium oxides. Low in fertility due to leaching of essential nutrients. Typically, not suitable for intensive agriculture. Offers stable ground for construction, but excavation can be challenging.
Table 4.2Soil Composition Percentages in Coimbatore LPA
Soil Type
Approx. Coverage in LPA (%)
Characteristics & Implications
Soil Texture
Red Soil
~45-50%
Well-drained, iron-rich; suitable for crops like groundnut and cotton; stable base for buildings
Sandy loam to loam (light texture)
Black Soil
~15-20%
High clay content, excellent moisture retention; supports cotton and sugarcane; needs engineering for heavy structures
Clayey (heavy texture)
Alluvial Soil
~10-15%
Fertile and found near riverbeds (e.g., Noyyal); productive for paddy and vegetables; requires flood protection
Silty loam (medium texture)
Lateritic Soil
~10-15%
Found in western hill slopes; porous, low fertility; good for foundations but hard to dig
Loamy to gravelly (moderate texture)
Others (Mixed/ Urban Fill)
~5-10%
Anthropogenic fill or mixed soil in urbanized areas; varies in quality and compaction
Variable / artificial fill (mixed texture)
Source: Geological Survey of India, Tamil Nadu Soil Survey
Note: These percentages are inferred from spatial distribution maps and regional soil surveys conducted by the Tamil Nadu Agricultural Department and Geological Survey of India.
Map 4.4: Soil textures and types within Coimbatore LPA
4.4 Geology
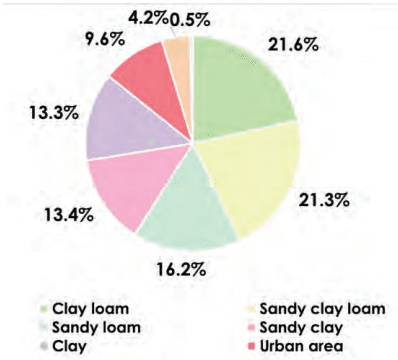
The area extent of the soil type is as follows:
Figure 4.1: Percent of soil type within the total Coimbatore LPA area
The predominant soil types are clay loam (21.6%) and sandy clay loam (21.3%). Clay loam soil is suitable for crops requiring consistent water supply due to its ability to retain moisture for longer periods while sandy clay loam is suitable for crops requiring consistent but not excessive water due to high percolation characteristics (GSI, 2020; Ministry of Agriculture & Farmers Welfare, 2016).
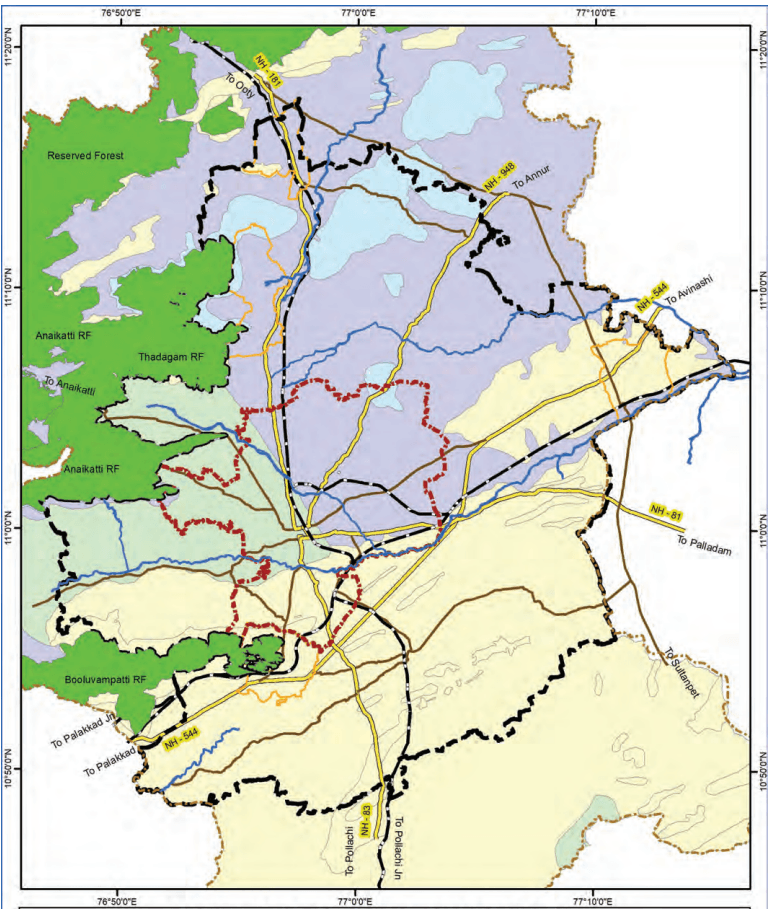
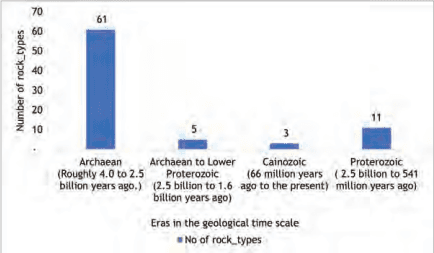
Geological studies focus on the analysis of formation, composition, distribution of earth’s surface features including the rock types and minerals. The rocks and minerals in the region within and surrounding Coimbatore LPA span across various geological time periods such as Archaean (4.0 to 2.5 billion years ago), Archaean to Lower Proterozoic (2.5 billion to 1.6 billion years ago), Proterozoic periods (2.5 billion to 541 million years ago) and Cainozoic (66 million years ago to the present). The predominant bed rock within the region belongs to the Archaean and Proterozoic periods thereby suggesting the presence of ancient rock formation within the area.
Map 4.5: Details of the deposition of rock layers (strata)
Figure 4.2: Stratigraphy – sequence of rock layers
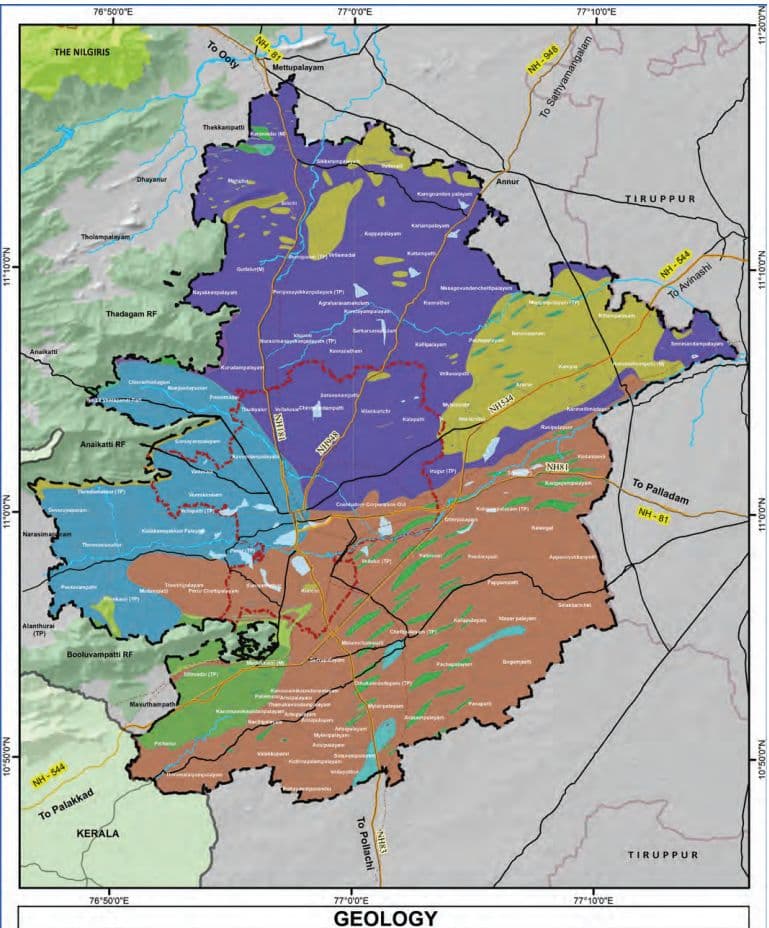
The geology map (Map 4.6) illustrates the geological composition of the CLPA, derived from Geological Survey of India (GSI) data. The map highlights different rock formations, soil types, and underlying geological structures, crucial for understanding groundwater recharge zones and seismic risk assessment. It depicts the underlying geological formations within the Coimbatore LPA derived from Geological Survey of India (GSI) data. Dominant lithology includes gneissic complexes, charnockites, and sedimentary formations. The map highlight’s fault lines and fracture zones that influence seismic vulnerability and groundwater flow patterns.
The geology of the Coimbatore LPA is primarily characterized by ancient crystalline rocks of the Archean age, predominantly consisting of gneissic complexes and charnockites. These formations are part of the larger Peninsular Gneissic Complex, a stable cratonic block with a history spanning billions of years.
The region exhibits several structural features, including fault lines and fracture zones. These are significant from a seismic perspective and also influence groundwater movement. Prominent lineaments trending NE-SW and NW-SE are observed.
Map 4.6: Geological Features
Table 4.3Major Geological Units within Coimbatore LPA
Geological Unit
Description
Environmental Significance
Gneissic Complexes
Ancient metamorphic rocks with banded textures; composed of quartz, feldspar, and mica
High structural stability; forms the foundation for most of the region; moderate groundwater potential
Charnockites
Metamorphic rocks rich in orthopyroxene; greenish in colour
Resistant to weathering; poor groundwater potential; influences soil composition
Sedimentary Deposits
Sandstones, siltstones, and alluvial deposits along river courses like the Noyyal
High groundwater potential; prone to erosion and flooding; supports agriculture
Fault Lines/ Fractures
Zones of structural weakness; potential for seismic activity; conduits for groundwater flow
Requires careful construction practices; potential for groundwater contamination; influences drainage patterns
4.5Geomorphology
The geomorphology of the Coimbatore LPA is characterized by a diversity of landforms, reflecting the region’s geological history and ongoing geomorphic processes.
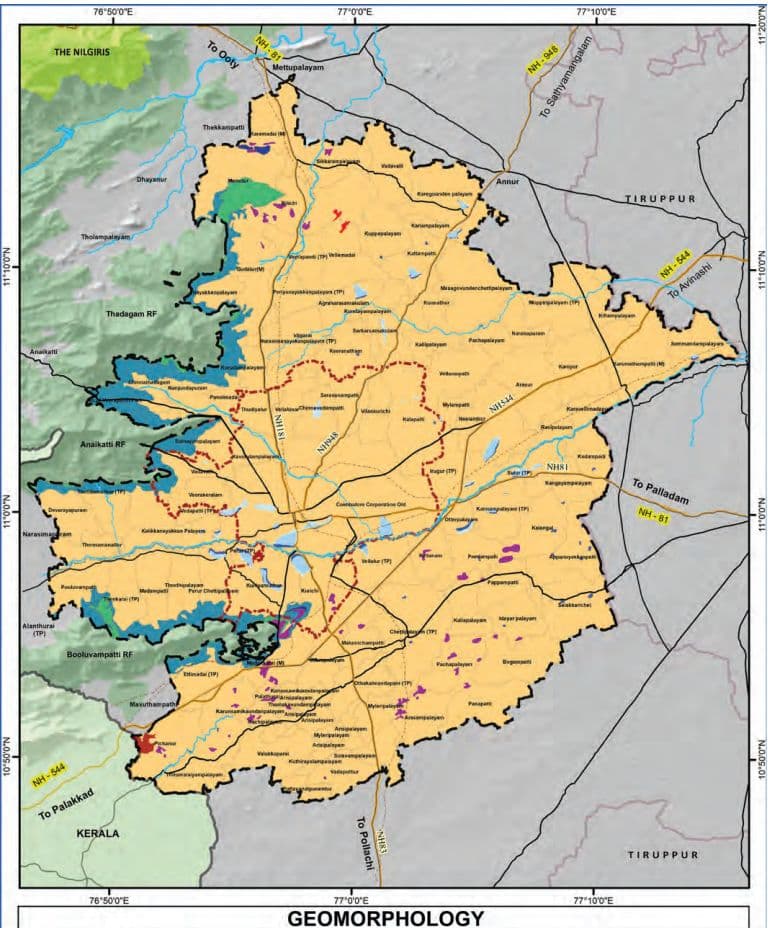
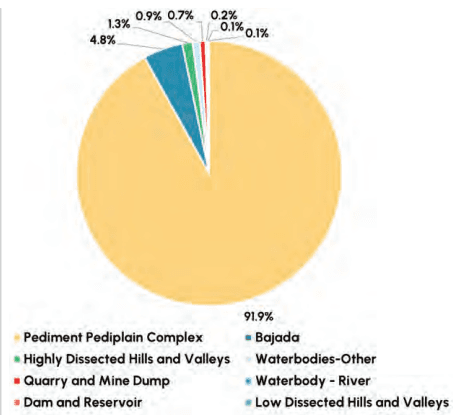
Geomorphological studies focus on the study of the landforms and surface features of the region such as mountains, valleys, plains etc. The types of landforms found in the region within and surrounding the Coimbatore LPA includes Bajada (large, flat, or gently sloping area formed by the accumulation of sediment), dam and reservoir, hills and valleys, plateaus, quarry and mining, water bodies and pediment- pediplain complex (Map 4.7).
The geomorphological map (Figure 1.6) highlights a landscape shaped by diverse landforms, including bajadas, dissected structural hills and valleys, pediment Pedi plain complexes, and significant reserved forest stretches. Bajadas and Pedi plains dominate the central and eastern regions, providing relatively flat terrain suitable for urban expansion and infrastructure development.
Map 4.7: Geomorphology Map
Figure 4.3: Distribution of the land forms within the LPA boundary
Table 4.4Major Geomorphological Units within Coimbatore LPA
Geo-morphological Unit
Description
Characteristics & Significance
Bajadas
Gently sloping depositional plains formed by the coalescing of alluvial fans at the base of hills.
Common in the central and eastern parts of the LPA. Offer relatively flat terrain suitable for urban expansion and infrastructure development. Susceptible to sheet erosion during heavy rainfall.
Dissected Hills/ Valleys
Highly eroded and dissected hill ranges, predominantly found along the western and south-western borders of the LPA.
Part of the foothills of the Western Ghats, including the Thadagam, Anaikatti, and Booluvampatti Reserved Forests. Vital for biodiversity conservation, groundwater recharge, and climate regulation. Prone to landslides and soil erosion due to steep slopes and deforestation.
Pediment Pedi plain Complexes
Extensive gently sloping or nearly level erosional surfaces formed by the coalescence of pediments.
Located in the central and eastern parts of the LPA. Often covered with a thin veneer of soil and alluvium. Suitable for agriculture and urban development. Requires careful planning to avoid soil degradation and water logging.
Reserved Forests
Legally protected areas managed by the Forest Department, GoTN.
Located along the western and northern edges of the LPA. Crucial for biodiversity conservation, carbon sequestration, and watershed protection. Supports a wide range of flora and fauna, including endangered species. Requires strict enforcement to prevent deforestation, encroachment, and poaching.
4.6Climatology
Coimbatore has a tropical wet and dry climate (According to Koppen Classification), which is characterized by distinct dry and wet seasons. The city’s climate is influenced by its geographical location, situated at the foothills of the Western Ghats and approximately 1,500 feet (460 meters) above mean sea level, which helps in maintaining a more temperate climate compared to other plains of Tamil Nadu. Despite its moderate climate, Coimbatore faces occasional climatic challenges such as heavy rainfall leading to localised flooding in certain locations, and fluctuations in temperature. The components of analysis focus on the temperature, rainfall, humidity, wind speed and seismic vulnerability.
4.6.1 Temperature
The city falls under the category of tropical wet climate characterised by high temperatures and precipitation throughout the year. The maximum and minimum temperatures range from 4 1 ° C and above 1 8 ° C respectively. Temperatures start dipping from August until the end of the winter season.
An increase of 0 . 0 1 4 ° C per decade during the period of 1981-2022 has been deciphered based on an analysis of annual average air temperature as obtained from the Indian Meteorological Department (IMD).
Source: Coimbatore Climate Resilient City Action Plan: Towards a Net Zero Future, by ICLEl Local Governments for Sustainability, South Asia
Figure 4.4: Average air temperature trend in Coimbatore
4.6.2 Rainfall
The region benefits from the south-west monsoon from June to August and the North-east monsoon which typically spans from October to early December. The total average annual rainfall ranges from 614 to 647mm. The annual rainfall has decreased by 9.8% around the regions south of the Cauvery basin, one of them being the Coimbatore LPA. A trend analysis of the annual rainfall is carried out based on the IMD data for the years 1981-2022 is as follows:
Source: Coimbatore Climate Resilient City Action Plan: Towards a Net Zero Future, by ICLEl Local Governments for Sustainability, South Asia
Figure 4.5: Average Annual Rainfall Trend in Coimbatore
A marginal decline in the annual rainfall has been observed during the period 1981-2022. The annual rainfall recorded in Coimbatore has decreased from 1,025 mm in 1981 to 1,022.49 mm in 2022. The average rainy day is 37.57 per year.
The distribution of rainfall during 2023-24 indicates a higher amount of rainfall recorded towards the western side of the region and a gradual decrease in the rainfall amount while moving eastward. The Western Ghats towards the western side of the region play a pivotal role in variation of the micro climatic conditions across the region.
Coimbatore LPA experiences moderate annual rainfall, mainly influenced by both southwest and northeast monsoons. Rainfall distribution varies across the region, with the western foothills receiving higher precipitation due to their proximity to the Western Ghats, while the eastern areas are comparatively drier. This rainfall pattern shapes local water availability and supports the region’s agricultural and ecological needs.
Table 4.5Annual Rainfall Analysis
Zone / Region
Average Annual Rainfall
Seasonality
Key Observations
Planning Implications
Western Ghats & Foothills (Anaikatti, Booluvampatti, Thondamuthur)
>1200 mm
Predominantly SW monsoon
Highest rainfall zone in LPA due to orographic effect
Designate as recharge zones, enhance conservation; regulate construction on slopes
Central Urban Zone (Townhall, R.S. Puram, Gandhipuram, Singanallur)
850 -1000 mm
Bimodal - SW & NE monsoons
Moderate rainfall; high runoff due to impervious surfaces
Promote permeable surfaces, green infrastructure, and rainwater harvesting
Eastern and SE Dry Belt (Sulur, Irugur, Kinathukadavu)
Integrate wastewater reuse, implement strict water budgeting in planning permissions
Northern Peri-Urban Areas (Somanur, Annur, Chinniyampalayam)
850 -1000 mm
NE monsoon dominant
Consistent rain fed cultivation possible
Prioritize rooftop harvesting and low-tech recharge pits in settlements
Valley Wetlands Zone (Kurichi, Vellalore, Perur tanks system)
900 -1100 mm
SW + NE balanced
Seasonal wetlands benefit from rainfall synergy
Integrate into storm water and aquifer recharge plans; conserve tank cascades
Source: Indian Meteorological Department (IMD), Central Ground Water Board (CGWB)
Average Annual Rainfall across LPA: ~940 mm
Dual monsoon pattern: SW (June–Sept) & NE (Oct–Dec)
Climate trends show increased variability and intensity, with more frequent short-duration, high-intensity events.
Urban flooding and waterlogging risks are rising in lowlying and poorly drained wards
4.6.3 Humidity
Humidity levels in the city range from 40% to 70% throughout the year. Favourable wind movement contributes to maintaining good air quality, making Coimbatore one of the least polluted cities in Tamil Nadu
Map 4.8: Annual Rainfall Map
ANNUAL RAINFALL
4.6.4 Wind speed
Coimbatore LPA is classified under high damage risk zones and moderate damage risk zones, with an approximate wind speed of 47 metre/sec and 39 metre/sec respectively. In terms of area coverage, Coimbatore LPA is covered predominantly under the moderate damage risk zone while the high-risk zone falls only under the eastern end of the Coimbatore LPA region.
Map 4.9: Wind speed and fault line Map
4.6.5 Seismic vulnerability
The entire region falls under the Seismic Zone III category. The zone III is characterized by moderate seismic activity prone to minor to moderate damage to buildings. Mild tremors have been recorded due to tectonic movements in the Western Ghats and nearby fault lines. In the recent past, earthquakes of low intensity of magnitude around 3.0 have been recorded to registered within a range of 100 – 225 km zone.
Map 4.10: Seismic zone Map for Coimbatore LPA
4.7
Water resources
The seismic history of Coimbatore has record of a major earthquake in the year 1900 which is commonly reffered to as Nallepilly earthquake which had an estimated scale of 6.0 magnitude. The Earthquake caused structural damage to several buildings in Coimbatore including a clock tower, central jail and St. Micheal’s Cathedral which collapsed.
In the last 10 years the surrounding region of Coimbatore has only experienced minor to moderate seismic activity of which the strongest reason earthquake was of magnitude 4.6 occurring on March 03, 2020 with epicentre 212 kms south of Coimbatore.
The region within and surrounding Coimbatore LPA is divided into two catchment areas based on the direction of the water flow and the sub-basin in which the region is situated. The predominant catchment falls under east flowing rivers under the Cauvery River catchment area (4B) covering the northern part of the region while the southern part falls under west flowing rivers under the Valayar catchment area (5B).
Coimbatore, Erode, Tiruppur and Salem districts are primarily drained by five main rivers: the Cauvery, Bhawani, Noyyal, Moyar and Aliyaar. The Cauvery River acts as the boundary between the Salem and Erode districts, flowing from north to south along the region’s western part. Among these, Bhavani, Amravati and Noyal Rivers act as the main water source for the region.
In Coimbatore district, the main rivers flowing are Bhavani, Noyyal, Amaravathi and Aliyar. Canals, wells, tanks and reservoirs are this district’s irrigation sources.
Coimbatore LPA is mainly developed in the watershed expanse of the Noyyal River basin and consists of a network of lakes and canals. The Noyyal River originates from the Vellingiri Hills in the Western Ghats. It flows eastward, passing through Coimbatore, and eventually merges with the Cauvery River at Karur.
The region within and surrounding Coimbatore LPA primary falls under Cauvery and Periyar sub-basins. A significant portion of the northern side falls under the Cauvery sub-basin, which forms the majority of the sub-basin, while the southern region falls under Periyar sub-basin (Map 4.12).
5.2Classification of Towns
Classification of towns within the LPA as per Census 2011 and the status as on 2024 based on indications on assessment of respective administrative unit by the constituent local bodies are given below (Table 5.2). In 2011, in addition to the Coimbatore Local Planning Area (LPA) comprised a total of 72 urban settlements categorized under Class I to Class V towns. These included 2 no. of Class I towns with a population exceeding 1 lakh, 2 no. of Class II towns with a population ranging from 50,000 to 99,999, 16 nos. of Class III towns with population between 20,000 and 49,999, 23 nos. of Class IV towns with populations between 10,000 and 19,999, and 29 nos. of Class V towns with populations between 5,000 and 9,999. Based on the 2024 assessment of
population data from the constituent Local Bodies within the LPA, the number of towns has increased to 76. The revised classification for 2024 is projected to comprise 1 no. of Class I town, 1 no. of Class II town, 20 nos. of Class III towns, 30 nos. of Class IV towns, and 24 nos. of Class V towns, reflecting the continued urban growth and reclassification of settlements within the planning jurisdiction. The maps below (Map 5.1 & Map 5.2) indicate the emergence of many small-sized towns and their spatial location along NH-181 (Mettupalayam Road), NH-948 (Sathyamangalam Road), NH-544 (Avinashi Road), and NH-81 (Trichy Road).
Table 5.2Classification of Towns by Population Size in Coimbatore LPA
Classification of Towns
No. of Towns (as on 2011)
No. of Towns (as on 2024)
Class I - More than 1,00,000
2
1
Class II - 50,000 - 99,999
2
1
Class III - 20,000 - 49,999
16
20
Class IV - 10,000 - 19,999
23
30
Class V - 5,000 - 9,999
29
24
Source: Census of India (2011) and Local Bodies
DIRECTORATE OF TOWN & COUNTRY PLANNING - TAMIL NADU
DATA SOURCE
Census of India
SCALE
0 1 2 4 6 8 Km
PROJECTION: UTM ZONE 43N DATUM: WGS 1984
Map 5.1: Classification of Towns in Coimbatore LPA – 2011
CLASSIFICATION OF TOWNS - 2011
Map 5.2: Classification of Towns in Coimbatore LPA – 2024
CLASSIFICATION OF TOWNS - 2024
DIRECTORATE OF TOWN &COUNTRY PLANNING - TAMIL NADU
DATA SOURCE
MAWS,DTP, RD&PR
SCALE
0 1 2 4 6 8 Km
PROJECTION : UTM ZONE 43NDATUM : WGS 1984
5.3 Urbanisation in Tamil Nadu & Coimbatore
5.4 Demographic Characteristics
Tamil Nadu, accounted for 5.96% (7,21,47,030) of the country’s total population. Tamil Nadu is a highly urbanized state, with 48.45% of its population living in urban areas, exceeding the national average of 31.1%. Coimbatore district comprises of nearly 4.79% of the state’s population and the rate of urbanisation stands at 75.7%, which is higher than the state average.
5.4.1Population Growth
The Coimbatore population growth, driven by industry, commerce, and education, has accelerated post-independence. Migration and natural increase have shaped its expansion, extending beyond municipal limits into periurban areas.
In 1991, Coimbatore City Municipal Corporation had a population of 10,27,948 which increased to 15,84,719 in 2011. As per Census 2011, Coimbatore City Municipal Corporation holds 64.49% of the LPA population, while the Municipalities constitute 5.67% of the LPA population, and Town Panchayats and Revenue villages constitute 12.36% and 17.48% respectively. The population growth in Coimbatore City Municipal Corporation is reflected in its decadal growth rates of 21.7% during 1991 - 2001, which had gone up to 26.8% in 2001 - 2011. The population within the Municipal Corporation is distributed predominantly along the major transit corridors and adjacent to areas with industrial developments. Within the Municipal Corporation, Kurichi, which has a higher concentration of SIDCO industrial developments, has registered a higher population growth. Similarly, Kuniyamuthur and Koundampalayam, which houses a number of leading educational institutions, have also exhibited a higher population growth.
In terms of decadal growth rate as per 2011 Census, Gudalur Municipality located along the Metupalayam Road has exhibited a higher growth rate. Similarly, Kangayampalayam village abutting the NH-81 (Coimbatore-Trichy Highway) and Malumichampatti abutting NH-83 (Coimbatore-Nagapattinam Highway) have experienced major growth in the past two decades.
Between 1991 and 2001, few villages within the Local Planning Area (LPA) experienced negative population growth rate. These included Arasampalayam in the southern part of the LPA, through which a railway line passes; Irugur, situated along Avinashi Road; Arisipalayam, located near Pollachi Road and surrounded by mining and quarrying activities; and Bogampatti in the southeast, which faces accessibility challenges. However, during the subsequent decade (2001–2011), all of these villages recorded positive growth rates.During 2001-2011, Thambagoundenpalayam located in proximity to Pollachi road and surrounded by mining activities, Vadavalli (Annur Taluk) in the northern outskirts of LPA, Kuthiriyalampalayam located in the southern part of the LPA, which lacks accessibility, have all exhibited negative growth. The population and decadal growth rate of the constituent units during 1991–2011 are provided in the Table 5.3 and Map (5.3 to 5.7) below.
Table 5.3Population and Decadal Growth Rate of Coimbatore LPA
S. No.
Name of the Local Body
Population
Population
Population
Decadal Growth Rate (in %)
Decadal Growth Rate (in %)
S. No.
Name of the Local Body
1991
2001
2011
1991-2001
2001-2011
1
Coimbatore (Municipal Corporation)
10,27,948
12,51,336
15,84,719
21.7
26.6
Coimbatore (Old Municipal Corporation)
8,16,321
9,30,882
10,50,721
14.0
12.9
Added areas
2,11,627
3,20,454
5,33,998
51.4
66.6
Municipalities
Municipalities
Municipalities
Municipalities
Municipalities
Municipalities
Municipalities
1
Gudalur
19,840
21,966
38,859
10.72
76.9
2
Karamadai
20,065
27,817
35,166
38.6
26.4
3
Karumathampatti
17,624
26,477
35,062
50.2
32.4
4
Madukkarai
18,110
26,441
30,357
46.0
14.8
Town Panchayats
Town Panchayats
Town Panchayats
Town Panchayats
Town Panchayats
Town Panchayats
Town Panchayats
1
Chettipalayam
5,325
8,103
10,366
52.2
27.9
2
Dhaliyur
8,447
9,658
11,500
14.3
19.1
3
Ettimadai
5,727
7,543
9,352
31.7
24.0
4
Idikarai
6,158
6,333
8,686
2.8
37.2
5
Irugur
19,291
18,622
25,691
-3.5
38.0
S. No.
Name of the Local Body
Population
Population
Population
Decadal Growth Rate (in %)
Decadal Growth Rate (in %)
S. No.
Name of the Local Body
1991
2001
2011
Source: Census of India
Map 5.3: Population distribution in Coimbatore LPA – 1991
POPULATION DISTRIBUTION- 1991
Map 5.4: Population distribution in Coimbatore LPA – 2001
POPULATION DISTRIBUTION - 2001
Map 5.5: Population distribution in Coimbatore LPA – 2011
POPULATION DISTRIBUTION-2011
Map 5.6: Population distribution within in Coimbatore City Municipal Corporation – 2011
Population Distribution in Coimbatore City Municipal Corporation -2011
DIRECTORATE OF TOWN &COUNTRY PLANNING - TAMIL NADU
DATA SOURCE
Coimbatore City Municipal Corporation
SCALE
0
0.4250.85
1.7
2.55
3.4
Map 5.7: Population distribution within in Coimbatore City Municipal Corporation – 2024
Population Distribution in Coimbatore City Municipal Corporation -2024
5.4.2Population Density:
The overall gross population density of the Coimbatore Local Planning Area (LPA) is approximately 1,605 persons per Sq.km. Within the LPA, the CCMC area shows a significantly higher density of 6,147 persons per Sq.km. Notably, the older parts of the Corporation have an even higher density of 9,950 persons per Sq.km, while the newly added areas exhibit a density of 3,508 persons per Sq.km.
The population density of Municipalities located within the planning area (Gudalur, Karamadai, Karumathampatti, Madukkarai) ranges between 1,300 - 1,850 persons/ sq.km. This low gross population density in the LPA could be attributed to the presence of vast chunk of agricultural land and also natural constraints such as undulating terrain with hills, forest areas & water bodies occupying a large area of land. A good connectivity (Mettupalayam road) and proximity to major infrastructure along with the growing concentration of economic activities, have resulted in excessive residential developments in Kurudampalayam and Narasimhanaickenpalayam villages and thus have higher population density. Similarly, Pallapalayam along NH-81 (Coimbatore-Trichy Highway) wherein a number of educational institutions have come up, and also Keernatham abutting the corporation boundary in the north in and around which SEZ IT park and MSME clusters have developed, have also exhibited higher densities.
A comparative analysis of gross density patterns in large sized metro cities (Core Corporation areas) as well as cities of similar sized population indicates that the density of Coimbatore city is comparatively lower than other similar cities like Navi Mumbai, Thane, Ahmedabad, Surat and Pune as given in figure below.
Source: Census 2011
Figure 5.1: Comparative Population Density (in person/sq.km) of similar sized cities in India
Table 5.4Population density distribution of Coimbatore LPA
S. No.
Villages
Population Density in persons/sq.km(2001)
Population Density in persons/ sq.km (2011)
Population Density in persons/ sq.km (2024)
5.4.3Migrant Population
Coimbatore is Tamil Nadu’s largest industrial hub after Chennai and a key part of the Coimbatore–Tirupur– Erode Industrial Corridor. It boasts a diverse manufacturing and services sector, particularly in information technology, engineering, and textiles. With over 750 machinery factories, the city contributes 34% of Tamil Nadu’s machinery production, solidifying its status as an industrial powerhouse.
The booming textile industry has attracted various business and merchant communities. Coimbatore is also a major educational hub, home to 7 universities, 54 engineering colleges, 35 medical colleges, 24 polytechnic colleges, 70+ arts and science colleges, nearly 20 research institutes, and over 100 CBSE schools.
Its pleasant climate, quality healthcare, and peaceful environment make Coimbatore a preferred destination for jobs, education, healthcare, and real estate investment. The city’s robust economic opportunities and quality of life continue to attract a growing migrant population in search of better services and livelihoods.
According to 1991 Census, the migrant population in Coimbatore district constituted 13.7% of the total population. Of this, migrants to Coimbatore from other parts of Tamil Nadu State constituted 30.5 %. In 2011, the proportion of total migrant population was about 54.4% of the total district population. The proportion of migrant population from other parts of Tamil Nadu State has almost tripled during 1991-2011. Similarly, the migrant population from other states which was only 4.9% in 2001, increased to 8.6% by 2011. It is clearly evident that migration is a major driver of urbanization in the district (Table 5.6)
Table 5.6Migrant population in Coimbatore District
Description
Year
Total population
Total migrants
% of total migrants
Coimbatore District
1991
35,08,374
4,79,129
13.7%
2001
42,71,856
5,09,968
11.9%
2011
34,58,045
18,81,966
54.4%
Source: Census of India
5.5 Other Demographic Characteristics
5.5.1 Population of Persons with Disabilities (PwD):
As per Census 2011, Coimbatore district had 52,452 persons with disabilities which constituted 1.5% of the district population. Of the total, 21.1% of the persons with disabilities fall under 20 years of age. Majority of this population has disability in seeing, hearing and movement.
5.5.2Schedule Caste and Schedule Tribe Population
As of Census 2011, the Scheduled Caste (SC) population constitute 12.7% of the total population and Scheduled Tribes (ST) constitute about 0.3%. The SC/ST population is predominantly located within the CCMC area. In Rest of CCMC, the concentration of SC/ST population is very less.
Table 5.8Schedule Caste and Schedule Tribe Population in Coimbatore LPA
S. No.
Name of the Local Body
SC Population
SC Population
SC Population
ST Population
ST Population
ST Population
S. No.
Name of the Local Body
1991
2001
2011
1991
2001
2011
1
Coimbatore City Municipal Corporation
1,06,178
1,08,804
1,61,744
1,385
1,120
1,708
1
Coimbatore (Old Municipal Corporation)
79,370
77,178
1,07,949
362
535
683
1
Added areas
26,808
31,626
53,795
1,023
585
1,025
Municipalities
Municipalities
Municipalities
Municipalities
Municipalities
Municipalities
Municipalities
Municipalities
1
Gudalur
1,729
1,856
3,432
0
8
16
2
Karamadai
2,857
3,580
4,925
5
13
40
3
Karumathampatti
2,124
2,081
3,440
0
0
5
4
Madukkarai
1,856
3,724
4,640
24
161
29
Town Panchayats
5.5.3Literacy Rate
Coimbatore is a major educational hub in the state of Tamil Nadu, boasting a number of universities and colleges. As per Census 2011, the literacy rate of Coimbatore LPA (87.1%) is much higher than the state average of 80.1%. The high literacy rate can be attributed to Coimbatore LPA being one of the leading centres of higher education in the country and is also reflective of the large workforce in skilled economic activities. The literacy rate of Coimbatore LPA has increased from 73.6% in 1991 to 87.1% in 2011.
Table 5.9Literacy rate abstract of Coimbatore LPA
S. No.
Description
Overall Literacy rate
1991
2001
2011
1
Coimbatore LPA
73.6
82.3
87.1
2
CCMC
80.0
87.2
81.8
3
Municipalities
68.3
79.3
84.3
4
Town Panchayats
66.3
76.5
82.7
5
Revenue Villages
57.0
69.4
77.8
Source: Census of India
As per Census 2011, across the LPA, the male literacy rates are higher than the female literacy rate. The literacy rate of rural areas is on par with the urban areas which clearly indicates that the educational facilities, economic opportunities as well as social facilities are reasonably well distributed throughout the planning area.
Table 5.10Literacy rate of Coimbatore LPA
S. No.
Villages
Literacy rate (%)
Literacy rate (%)
Literacy rate (%)
S. No.
Villages
Male
Female
Overall
1
Coimbatore City Municipal Corporation
84.7
79.0
81.8
1
Old Coimbatore Municipal Corporation
5.5.5Age Structure
The age structure of a city’s population helps to assess the dependent and working population, guiding the planning of jobs, education, healthcare, and other essential services. According to the 2011 Census, Coimbatore district has a significant proportion of its population in the 20–45 age group, indicating a large working-age population. The age structure of the population in Coimbatore District as per Census 2011 is given in the table below:
Source: Census of India
Figure 5.3: Age pyramid of Coimbatore District
An analysis of the migration and population characteristics indicate that the age structure of Coimbatore shows a majority of the population falling under the working population category and that higher literacy rate of Coimbatore clearly exhibits the progressive nature of the city that would contribute to economic growth and reduction in poverty.
5.6 Population Projection
An appreciation of the development trends and activity growth as well as the economic role of the LPA in its regional/state context provide the possible growth scenario that may emerge in coming decades. In this regard, the following factors deserve special consideration:
i. As part of Tamil Nadu’s vision to evolve as a One Trillion Dollor Economy, a significant economic role is envisaged for Coimbatore in achieving the vision:
Milk supply heatmap of Tamil Nadu identifies 11 focus districts across 4 clusters of which Coimbatore along with Tirupur is part of the western cluster
Coimbatore is among the five additional districts for development of electronics manufacturing wherein 50-100 acres of land parcels will be developed
Programme for rejuvenation and repositioning of existing four machinery clusters in Tamil Nadu, of which Coimbatore is one.
Proposal to develop IT/GCC corridors across 10 cities, of which Coimbatore is one
Proposal to extensively address infrastructure development including expansion of Cargo as well as passenger handling capacity of Coimbatore airport (cargo demand 800 MT). Development/expansion of 3 corridor networks of 1000 km-Chennai-Coimbatore, Coimbatore – Hosur, Coimbatore – Karaikal and upgradation of Coimbatore - Tuticorin — Kumarapalayam – Madurai; exploring potential for potential for high-speed rail corridor;
ii. A substantial part of Coimbatore’s growth is fuelled by migration from both within the state and outside. Almost 54.2% of the district’s population constitutes migrants and of this, 28.7% are from other districts of the state and 8.6% from other states.
Economic Profile
6.1 Introduction
Economic Survey of Tamil Nadu pointed out that Tamil Nadu’s economic development is more evenly distributed across multiple urban centres including Coimbatore, which contribute significantly to the state’s economy helping bridge the urban rural divide. Coimbatore is well known for its industrial development in Tamil Nadu. Some of its major economic activities include manufacturing textiles, automobile components and light engineering, and services like trade and commerce, healthcare, education and information technology.
Several textile mills were established due to growth of the cotton industry, thereby contributing to increasing employment opportunities within and around Coimbatore. The decline of Coimbatore textile industry in the late 20th century, influenced by other factors, led to a diversification of the city industrial base from textile manufacturing to sectors like automobile components and agricultural implements. Additionally, Coimbatore wet grinder received the Geographic Indication (GI) tag recognising its manufacturing heritage in Coimbatore and acknowledges the region’s significant contribution to the industry.
In recent years, the Information Technology sector has been growing in the city which hosts several IT parks, including TIDEL Park, KCT Tech Park, and CHIL SEZ. Coimbatore was ranked 17th among the top global outsourcing cities, by Tholons, a major Business Consulting firm, reflecting its growing prominence in the IT sector.
As Coimbatore transitions towards a metropolitan economy, there is a growing need to integrate economic strategies with spatial planning—facilitating balanced growth, creating more high value employment opportunities, reducing commute times, ensuring efficient logistics, and supporting inclusive livelihoods.
In this chapter, focus is placed on evolving a spatial structure that would be conducive for facilitating sustained economic growth.
6.2 Guiding Principles of Economic Strategy
6.2.1Leveraging Existing Strengths
Coimbatore’s economic strategy capitalizes on its well-established industrial ecosystem, entrepreneurial heritage, and sectoral depth. It hosts over 1,000 textile mills and contributes significantly to India’s textile exports, particularly in yarn and knitwear production as per Tamil Nadu Industrial Development Corporation (TIDCO). The city is also a national leader in manufacturing, accounting for nearly 50% of India’s motor and pump production, and is a major supplier of auto components to Original Equipment Manufacturers (OEMs) like Maruti Suzuki and Tata Motors according to the District Industries Centre, Coimbatore.
With over 35,000 MSMEs operating across engineering, textiles, and manufacturing sectors, Coimbatore leverages its skilled workforce and strong institutional support to power its industrial economy. The presence of premier technical institutions like PSG College of Technology and CIT further supports innovation, R&D, and skill development. The city has successfully extended its legacy strengths to emerging sectors like information technology, renewable energy, and precision engineering, with IT exports alone crossing Rs.400 crores in 2018-19 as per the Software Technology Parks of India - STPI, Coimbatore.
6.2.2Building a Sustainable Economy
Economic activities impact the natural sources and environment and quality of life directly and indirectly. In order to have sustainable growth, there is a need for a balance between the demand on resources owing to economic activities and sustainability of such activities. A sustainable economic growth strategy requires minimising adverse environmental effects while promoting resource efficiency and resilience. The region has witnessed significant adoption of renewable energy and eco-friendly practices in textile manufacturing and residential sectors. Industrial clusters are transitioning towards energy-efficient machinery and green certification, supported by institutions like the Coimbatore Innovation and Business Incubator (CIBI).
6.2.3Raising Per Capita Income
An improved quality of life is closely linked to increase in per capita income, which expands individual choices and economic security. Economic activities in the region must be oriented toward raising the per capita income of its residents by creating high-value employment opportunities and fostering income multiplication. Growth strategies should prioritize the identification and promotion of sectors that offer high-value jobs, alongside robust initiatives for skilling and upskilling the labour force to meet evolving industry demands. In addition, the strategy will focus on identifying and nurturing exportoriented activities, which act as significant force multipliers in accelerating regional economic growth.
Administrative Units
Area (in Sq. Km)
IV
Revenue Villages
1
Veerapandi No:24 (part)
35.78
2
Marudur
29.14
3
Bilichi
27.94
4
Masagoundenchettipalayam
27.36
5
Neelambur (Neelambur & Muthugoundenpudur)
23.02
6
Karegoundenpalayam
21.39
7
Selakkarichel
21.23
8
Arasur
20.14
9
Bogampatti
18.79
10
Appanayakkanpatti
18.74
11
Pichanur
18.72
12
Kaniyur
18.33
13
Vellamadai
17.19
14
Valukkuparai
16.99
15
Vellanaipatti
16.42
16
Malumicchampatti
15.80
17
Pachapalayam
15.59
18
Vadavalli
15.52
19
Madampatti
15.44
20
Kalangal
15.01
21
Nayakkanpalayam
14.89
22
Sikkarampalayam
14.52
23
Kallapalayam
14.41
24
Semmandampalayam
13.93
25
Devarayapuram
13.92
26
Peedampalli
13.60
27
Theethipalayam
13.39
28
Keeranatham
13.31
29
Kuppepalayam
13.21
30
Somayampalayam
13.10
31
Kurudampalayam
12.81
32
Arasampalayam
12.60
33
Panappatti
12.08
34
Kadampadi
12.02
35
Nanjundapuram
12.01
36
Idayarpalayam
11.91
S. No
Administrative Units
Area (in Sq. Km)
37
Seerapalayam
11.88
38
PerurChettipalayam
11.18
39
Myleripalayam
11.13
40
Arisipalayam
10.85
41
Kattampatti
10.80
42
Vadaputhur
10.60
43
Pattanam
10.55
44
Kittampalayam
10.41
45
Agraharasamakulam
10.28
46
Pappampatty
10.25
47
Chinna Thadagam
10.20
48
Naranapuram
9.16
49
Kondayampalayam
9.06
50
Kunnathur
9.01
51
Solavampalayam
8.70
52
Thennamanallur
8.54
53
Kariampalayam
8.20
54
Kangayampalayam
7.61
55
Kallipalayam
7.56
56
Pannimadai
7.48
57
Pachapalayam
7.32
58
Karavellimadapur
6.79
59
Rasipalayam
5.58
60
Nachipalayam
5.18
61
Pottayandiporambu
5.03
62
Mylampatti
4.81
63
Karunsamikaundampalayam
4.14
64
Palathurai
3.44
65
Kuthiraiyalampalayam
2.64
66
Thamakavundampalayam
2.64
Sub Total
Sub Total
861.27
Total Area of Coimbatore LPA
Total Area of Coimbatore LPA
1531.57
Map 4.11: Catchment areas
Map 4.12: Sub-basins
4.8 Biodiversity
Coimbatore, situated on the banks of river Noyyal and foothills of Western Ghats of Nilgiri Biosphere Reserve, accommodate a large number of flora and fauna. Noyyal and associated wetlands form the major life supporting factor for the Coimbatore region. The study is based on a survey conducted by SACON on birds in 14 lakes of Coimbatore as a part of nature education programme in 2007.
The vegetation of Coimbatore consists of tropical dry deciduous forests, scrublands, and riparian ecosystems along the Noyyal River and its tributaries. Native tree species such as Neem (Azadirachta indica), Tamarind (Tamarindus indica), Indian Coral Tree (Erythrina variegata), and Peepal (Ficus religiosa) are commonly found. The forests near the Western Ghats harbor valuable timber species like Teak (Tectona grandis) and Rosewood (Dalbergia latifolia), along with medicinal plants and rare endemic species. Urban green spaces also support a variety of ornamental and fruit-bearing trees, contributing to the ecological balance.
Coimbatore’s biodiversity includes a wide range of wildlife, from large mammals to small reptiles and birds. The city’s outskirts, especially areas near Madukkarai, Pooluvampatti, Vadavalli, Somayamapalayam and Veerapandi, are home to elephants, leopards, deer, sloth bears, and Indian gaurs (bison), which often migrate from the surrounding forest reserves. Smaller mammals like jackals, civets, and mongoose are also found in semi-urban regions.
Coimbatore is rich in bird diversity, with wetlands and lakes supporting resident and migratory species. Water bodies like Periyakulam, Ukkadam Lake, and Singanallur Lake serve as habitats for birds such as painted storks, pelicans, cormorants, egrets, herons, and ibises. The surrounding forests and agricultural lands also provide refuge for parakeets, peafowls, kingfishers, hornbills, and raptors like eagles and kites.
The Noyyal River, lakes, and reservoirs host diverse aquatic species, including native carps, catfish, and freshwater turtles. However, pollution and encroachments have affected water quality, threatening aquatic biodiversity. Conservation efforts are needed to restore these ecosystems.
4.9 Conclusion
As evident, Coimbatore district is endowed with hills on the western side, plains on the east, renowned bioreserves, a network of lakes and a climate which is reasonably pleasant. At the same time its location, historical growth and economic progress have strengthened the urban framework. Rapid urbanization poses challenges such as environmental degradation, habitat loss, and resource management issues. With Coimbatore LPA’s climatic significance and biodiversity, preserving natural resources evenwhile enhancing urban resilience is crucial. A well-integrated strategy emphasizing infrastructure development, environmental sustainability, and efficient governance will ensure long-term liveability, economic stability, and ecological balance for the city.
DEMOGRAPHIC PROFILE
5.1 Demographic Profile
As per- Census 2011, Coimbatore City Municipal Corporation (CCMC) had a total population of 15,84,719 with its population density working out to 6,146 persons/sq.km. The literacy rate of Coimbatore LPA stands at 87.10%, exceeding the district (84.31%) and state (80.1%) average. The sex ratio in the LPA is 995 females per 1,000 males, close to the State average of 996 females per 1,000 males. These factors highlight Coimbatore’s role as a key urban and economic centre. The demographics characteristics of CCMC Coimbatore LPA, Coimbatore District and the state of Tamil Nadu are provided in the table below.
Table 5.1Comparison of Demographic Characteristics
Demographic Factor
Coimbatore City Municipal Corporation
Coimbatore LPA
Coimbatore District
Tamil Nadu State
Population (2011 Census)
15,84,719
24,57,452
34,58,045
72,147,030
Area (In Sq. Km)
257.81
1,531.57
4,732
1,30,058
Population Density (Persons / Sq.km)
6,146
1,605
731
555
Literacy Rate (%) (Census 2011)
81.8
87.10
84.31
80.1
Sex Ratio (Census 2011)
996
995
996
996
Source: Census of India – 2011
1991-2001
2001-2011
6
Kannampalayam
8,087
11,940
15,868
47.6
32.9
7
Mopperipalayam
6,212
8,732
10,923
40.6
25.1
8
Narasimhanaicken-palayam
6,972
11,271
17,858
61.7
58.4
9
Pallapalayam (Odderpalayam)
19,715
9,898
11,910
-49.8
20.3
10
Othakalmandapam
9,353
10,320
12,207
10.3
18.3
11
Periyanaicken-palayam
18,043
22,844
25,930
26.6
13.5
12
Perur
6,823
7,965
8,004
16.7
0.5
13
Pooluvapatti
11,249
11,964
12,853
6.36
7.4
14
Sarcarsamakulam
6,433
7,982
10,289
24.08
28.9
15
Sulur
19,715
24,152
27,909
22.51
15.6
16
Thenkarai
6,722
7,247
7,349
7.81
1.4
17
Thirumalayampalayam
9,684
11,136
12,164
14.99
9.2
18
Thondamuthur
8,408
9,340
11,492
11.08
23.0
19
Vedapatti
6,859
9,732
11,658
41.89
19.8
20
Veerapandi No. 4
9,325
12,794
16,953
37.2
32.5
21
Vellalur
14,388
17,340
24,872
20.52
43.4
Revenue Villages
Revenue Villages
Revenue Villages
Revenue Villages
Revenue Villages
Revenue Villages
Revenue Villages
1
Agraharasamakulam
3,366
3,879
4,144
15.24
6.8
2
Appanaickenpatti
3,306
3,656
3,992
10.59
9.2
3
Arasampalayam
3,782
3,079
3,818
-18.59
24.0
4
Arasur
1,799
8,689
11,510
382.99
32.5
5
Arisippalayam
5,325
2,393
2,400
-55.06
0.3
6
Bilichi
7,908
9,464
10,412
19.68
10.0
7
Bogampatti
2,143
1,772
2,415
-17.31
36.3
8
Chikkarampalayam
6,413
8,468
10,242
32.04
20.9
9
Chinnathadagam
6,340
8,276
8,407
30.54
1.6
10
Devarayapuram
5,420
5,766
6,417
6.38
11.3
11
Edayapalayam
1,707
2,095
2,251
22.73
7.4
12
Karavelimadapur
3,594
4,469
5,626
24.35
25.9
13
Kadampadi
6,811
6,968
8,147
2.31
16.9
14
Kalangal
4,051
4,556
5,590
12.47
22.7
15
Kallapalayam
2,875
2,945
3,066
2.43
4.1
16
Kallipalayam
1,704
2,646
2,821
55.28
6.6
S. No.
Name of the Local Body
Population
Population
Population
Decadal Growth Rate (in %)
Decadal Growth Rate (in %)
S. No.
Name of the Local Body
1991
2001
2011
1991-2001
2001-2011
17
Kangayampalayam
4,015
3,844
8,251
-4.26
114.6
18
Kaniyur
4,955
8,281
12,011
67.12
45.0
19
Karegoundenpalayam
4,655
6,723
7,531
44.43
12.0
20
Kariampalayam
3,180
3,966
4,498
24.72
13.4
21
Karunchamigoundenpalayam
73
194
343
65.75
76.8
22
Kattampatti
3,739
4,593
5,859
22.84
27.6
23
Keeranatham
3,253
4,229
4,707
30
11.3
24
Kittampalayam
2,194
2,836
4,362
29.26
53.8
25
Kondayampalayam
4,776
5,377
6,636
12.58
23.4
26
Kunnathur
3,208
3,765
4,281
17.36
13.7
27
Kuppepalayam
2,570
2,440
2,784
-5.06
14.1
28
Kurudampalayam
8,632
16,702
31,742
93.49
90.0
29
Kuthiraialampalayam
1,372
1,489
1,448
8.53
-2.8
30
Madampatti
5,292
6,434
6,771
21.58
5.2
31
Malumichampatti
4,471
7,176
12,936
60.5
80.3
32
Marudur
7,194
8,107
9,491
12.69
17.1
33
Masagoundenchettipalayam
7,840
8,304
9,616
5.92
15.8
34
Mylampatti
1,356
1,619
2,823
19.4
74.4
35
Myleripalayam
3,574
4,070
4,990
13.88
22.6
36
Nachippalayam
2,300
2,656
3,008
15.48
13.3
37
Naickenpalayam
5,030
5,253
5,914
4.43
12.6
38
Nanjundapuram
6,661
7,306
9,355
9.68
28
39
Naranapuram
1,997
2,116
2,111
5.96
-0.2
40
Neelambur
10,811
14,467
18,641
33.82
28.9
41
Pachapalayam (Sulur)
2,033
2,203
2,359
8.36
7.1
42
Pachapalayam (Annur)
2,445
2,775
2,933
13.5
5.7
43
Palathurai
2,505
2,626
2,727
4.83
3.8
44
Panappatti
1,981
3,110
2,635
56.99
-15.3
45
Pannimadai
8,054
10,782
13,785
33.87
27.9
46
Pappampatti
2,737
2,949
4,143
7.75
40.5
47
Pattanam
5,134
6,477
9,196
26.16
42.0
48
Peedampalli
3,160
3,520
3,896
11.39
10.7
49
Perur Chettipalayam
9,235
12,932
17,809
40.03
37.7
S. No.
Name of the Local Body
Population
Population
Population
Decadal Growth Rate (in %)
Decadal Growth Rate (in %)
S. No.
Name of the Local Body
1991
2001
2011
1991-2001
2001-2011
50
Pichanur
4,137
5,748
6,261
38.94
8.9
51
Pottaiyandiporambu
1,303
1,451
1,530
11.36
5.4
52
Rasipalayam
3,499
3,792
4,407
8.37
16.2
53
Seerappalayam
4,066
4,950
5,881
21.74
18.8
54
Sellakkarichal
5,204
5,626
6,209
8.11
10.4
55
Semmandampalayam
4,479
5,117
5,970
14.24
16.7
56
Solavampalayam
4,176
5,393
6,387
29.14
18.4
57
Somayampalayam
4,862
8,963
14,787
84.35
65.0
58
Thambagoundenpalayam
537
603
482
12.29
-20.1
59
Theethipalayam
4,666
6,626
8,629
42.01
30.2
60
Thennammanallur
4,266
4,496
5,098
5.39
13.4
61
Vadaputhur
2,616
4,594
5,176
75.61
12.7
62
Vadavalli (Annur)
3,472
3,971
3,859
14.37
-2.8
63
Valukkupparai
3,937
4,591
4,891
16.61
6.5
64
Veerapandi No. 24 (part)
4,637
3,485
7,528
-24.84
116
65
Vellamadai
5,115
6,131
6,874
19.86
12.1
66
Vellanaipatti
3,507
3,879
4,636
10.61
19.5
Coimbatore LPA
Coimbatore LPA
15,87,978
19,36,811
24,57,452
21.96
26.8
1
Coimbatore (Municipal Corporation)
4,854
6,147
8,913
Coimbatore (Old Municipal Corporation)
8,815
9950
NA
Added areas
2105
3508
NA
Municipality
Municipality
Municipality
Municipality
Municipality
1
Gudalur
734
1,299
1,767
2
Karamadai
1,441
1,822
2,282
3
Karumathampatti
985
1,304
1,685
4
Madukkarai
1,232
1,414
1,811
Town Panchayat
Town Panchayat
Town Panchayat
Town Panchayat
Town Panchayat
1
Chettipalayam
236
302
412
2
Dhaliyur
448
534
666
3
Ettimadai
459
569
868
4
Idikarai
556
763
1,658
S. No.
Villages
Population Density in persons/sq.km(2001)
Population Density in persons/ sq.km (2011)
Population Density in persons/ sq.km (2024)
5
Irugur
900
1,242
1,855
6
Kannampalayam
748
994
1,794
7
Mopperipalayam
400
500
728
8
Narasimhanaickenpalayam
1,769
2,803
4,932
9
Pallapalayam (Odderpalayam)
1,768
2,127
4,117
10
Othakalmandapam
746
883
1,310
11
Periyanaicken-palayam
2,435
2,764
3,463
12
Perur
1,304
1,310
1,351
13
Pooluvapatti
728
782
924
14
Sarcarsamakulam
631
814
1,911
15
Sulur
2,204
2,546
3,364
16
Thenkarai
568
576
602
17
Thirumalayampalayam
364
397
445
18
Thondamuthur
698
858
1,115
19
Vedapatti
1,585
1,899
2,431
20
Veerapandi No. 4
1,036
1,373
2,358
21
Vellalur
1,072
1,537
2,466
Revenue Villages
Revenue Villages
Revenue Villages
Revenue Villages
Revenue Villages
1
Agraharasamakulam
377
403
447
2
Appanaickenpatti
195
213
345
3
Arasampalayam
244
303
376
4
Arasur
431
571
761
5
Arisippalayam
221
221
495
6
Bilichi
339
373
667
7
Bogampatti
94
129
152
8
Chikkarampalayam
583
705
1,130
9
Chinnathadagam
811
824
824
10
Devarayapuram
414
461
588
11
Edayapalayam
176
189
261
12
Karavelimadapur
658
829
1,152
S. No.
Villages
Population Density in persons/sq.km(2001)
Population Density in persons/ sq.km (2011)
Population Density in persons/ sq.km (2024)
13
Kadampadi
580
678
1,375
14
Kalangal
304
372
963
15
Kallapalayam
204
213
569
16
Kallipalayam
350
373
1,143
17
Kangayampalayam
505
1,084
1,755
18
Kaniyur
452
655
953
19
Karegoundenpalayam
314
352
558
20
Kariampalayam
484
549
845
21
Karunchamigoundenp-alayam
47
83
183
22
Kattampatti
425
543
285
23
Keeranatham
318
354
2,139
24
Kittampalayam
272
419
531
25
Kondayampalayam
593
732
2,791
26
Kunnathur
418
475
571
27
Kuppepalayam
185
211
257
28
Kurudampalayam
1,304
2,478
3,555
29
Kuthiraialampalayam
564
548
580
30
Madampatti
417
439
546
31
Malumichampatti
454
819
2,256
32
Marudur
278
326
465
33
Masagoundenchettipalayam
304
351
669
34
Mylampatti
337
587
2,598
35
Myleripalayam
366
448
1,138
36
Nachippalayam
513
581
809
37
Naickenpalayam
353
397
755
38
Nanjundapuram
608
779
1,601
39
Naranapuram
231
230
355
40
Neelambur
628
810
850
41
Pachapalayam (Sulur)
141
151
205
42
Pachapalayam (Annur)
379
401
572
S. No.
Villages
Population Density in persons/sq.km(2001)
Population Density in persons/ sq.km (2011)
Population Density in persons/ sq.km (2024)
43
Palathurai
763
793
1,250
44
Panappatti
257
218
255
45
Pannimadai
1,441
1,843
2,937
46
Pappampatti
288
404
1,185
47
Pattanam
614
872
3,087
48
Peedampalli
259
286
1,190
49
Perur Chettipalayam
1,157
1,593
3,499
50
Pichanur
307
334
334
51
Pottaiyandiporambu
288
304
387
52
Rasipalayam
680
790
1,551
53
Seerappalayam
417
495
815
54
Sellakkarichal
265
292
430
55
Semmandampalayam
367
429
503
56
Solavampalayam
620
734
937
57
Somayampalayam
684
1,129
3,252
58
Thambagoundenpalayam
228
183
230
59
Theethipalayam
495
644
945
60
Thennammanallur
526
597
795
61
Vadaputhur
433
488
683
62
Vadavalli (Annur)
256
249
328
63
Valukkupparai
270
288
340
64
Veerapandi No. 24 (part)
97
210
236
65
Vellamadai
357
400
796
66
Vellanaipatti
236
282
948
Coimbatore LPA
Coimbatore LPA
1,265
1,605
2,426
The population density of Coimbatore LPA is presented in the Map 5.8.
Map 5.8: Population density in Coimbatore LPA – 2011
POPULATION DENSITY - 2011
5.4.2.1 Population Density distribution within the CCMC
Population density in Coimbatore LPA has risen, with 9,950 persons/sq.km in the old city and 6,147 persons/sq.km in the expanded area. Within the Coimbatore City Municipal Corporation, the highly dense wards are predominantly within the old Municipal Corporation area (Table 5.5). Broadly, the wards within the old Municipal Corporation area and which are adjacent to the CBD are found to have higher densities. This includes wards 46, 47, 48, 49, 77, 78, 79, 80, 81 which are part of CBD. Also wards 30, 32, 44, 45, which are in proximity to CBD have higher densities. Further, wards 7, 11, 17, 21, 25, 41, 64, 70, 71, 72, and 95, which have higher level of concentration of industrial, commercial and educational institutions show relatively higher densities.
Table 5.5Population density distribution within Coimbatore City Municipal Corporation
S. No.
Zone Name
Ward Numbers
Population Density in persons/sq.km(2011)
Population Density in persons/ sq.km (2024) based on assessment by Local Bodies
1
North
Ward 1
1,415
2,052
2
North
Ward 2
913
1,325
3
North
Ward 3
3,108
4,507
4
North
Ward 4
1,260
1,826
5
East
Ward 5
2,863
4,151
6
East
Ward 6
2,103
3,049
7
East
Ward 7
5,809
8,423
8
East
Ward 8
2,789
4,045
9
East
Ward 9
3,537
5,128
10
North
Ward 10
3,344
4,848
11
North
Ward 11
11,544
16,739
12
North
Ward 12
2,416
3,503
13
North
Ward 13
5,415
7,851
14
North
Ward 14
4,595
6,663
15
North
Ward 15
4,911
7,121
16
West
Ward 16
8,210
11,905
17
West
Ward 17
12,402
17,984
18
North
Ward 18
4,932
7,152
19
North
Ward 19
4,286
6,214
20
North
Ward 20
7,130
10,338
21
North
Ward 21
17,220
24,969
22
East
Ward 22
7,875
11,419
23
East
Ward 23
1,409
2,043
24
East
Ward 24
3,295
4,778
25
North
Ward 25
18,168
26,343
26
North
Ward 26
3,459
5,016
27
North
Ward 27
5,220
7,569
28
North
Ward 28
4,053
5,877
29
North
Ward 29
7,895
11,447
30
North
Ward 30
14,357
20,818
31
Central
Ward 31
5,141
7,455
32
Central
Ward 32
47,918
69,482
33
West
Ward 33
6,010
8,715
34
West
Ward 34
5,447
7,897
35
West
Ward 35
9,150
13,267
36
West
Ward 36
8,373
12,141
37
West
Ward 37
7,145
10,360
38
West
Ward 38
1,649
2,391
39
West
Ward 39
2,843
4,122
40
West
Ward 40
6,062
8,790
41
West
Ward 41
26,178
37,958
42
West
Ward 42
14,819
21,488
43
West
Ward 43
10,397
15,075
44
West
Ward 44
26,097
37,840
45
West
Ward 45
32,320
46,864
46
Central
Ward 46
13,736
19,917
47
Central
Ward 47
24,386
35,360
48
Central
Ward 48
17,101
24,796
49
Central
Ward 49
21,514
31,195
50
East
Ward 50
4,819
6,988
51
East
Ward 51
13,045
18,915
52
East
Ward 52
7,714
11,186
53
East
Ward 53
7,659
11,105
54
East
Ward 54
5,467
7,927
55
East
Ward 55
8,375
12,143
56
East
Ward 56
10,819
15,688
57
East
Ward 57
11,434
16,579
58
East
Ward 58
7,407
10,740
59
East
Ward 59
25,575
37,084
60
East
Ward 60
10,631
15,415
61
East
Ward 61
4,390
6,366
62
Central
Ward 62
2,251
3,264
63
Central
Ward 63
17,728
25,706
64
Central
Ward 64
30,426
44,116
65
Central
Ward 65
7,639
11,076
66
Central
Ward 66
5,603
8,124
67
Central
Ward 67
8,454
12,259
68
Central
Ward 68
9,659
14,005
69
Central
Ward 69
6,807
9,869
70
Central
Ward 70
22,210
32,205
71
West
Ward 71
13,497
19,571
72
West
Ward 72
11,356
16,467
73
West
Ward 73
8,582
12,445
74
West
Ward 74
5,476
7,940
75
West
Ward 75
9,027
13,088
76
South
Ward 76
6,333
9,183
77
South
Ward 77
14,060
20,388
78
South
Ward 78
22,966
33,300
79
South
Ward 79
30,751
44,588
80
Central
Ward 80
14,834
21,509
81
Central
Ward 81
14,753
21,392
82
Central
Ward 82
10,978
15,918
83
Central
Ward 83
3,928
5,695
84
Central
Ward 84
10,735
15,565
85
South
Ward 85
9,186
13,320
86
South
Ward 86
11,090
16,080
87
South
Ward 87
4,198
6,087
88
South
Ward 88
4,024
5,835
89
South
Ward 89
1,967
2,852
90
South
Ward 90
2,743
3,977
91
South
Ward 91
4,963
7,197
92
South
Ward 92
6,279
9,105
93
South
Ward 93
10,728
15,556
94
South
Ward 94
5,178
7,509
95
South
Ward 95
13,374
19,391
96
South
Ward 96
12,869
18,660
97
South
Ward 97
3,817
5,534
98
South
Ward 98
8,904
12,911
99
South
Ward 99
6,128
8,886
100
South
Ward 100
5,539
8,031
Source: Census 2011 and Local Bodies
Several wards within Coimbatore City Municipal Corporation exhibit significantly higher population densities compared to the overall city average. Sanganoor and KK Pudhur (Wards 32 and 45), located near the Central Business District (CBD), have extremely high densities. P.N. Pudhur (Ward 41), home to Tamil Nadu Agricultural University and MSME industries, also shows higher density levels. KK Pudhur and nearby areas (Wards 44 and 45), along with Rathinapuri, Gandhipuram, and Pappanaickenpalayam (Wards 46 to 49), are situated within or near the CBD have recorded high densities. Singanallur (Ward 59), a major residential area along NH-81, follows a similar trend.
Commercial hubs like Puliyakulam and R.S. Puram (Wards 64, 70–72), and central localities such as Selvapuram, Aathupalam, and Townhall (Wards 77–81) also report high densities. Additionally, Kurichi and Podanur (Ward 95) with industrial clusters; Saravanampatti (Wards 11 & 21) known for mills, educational institutions, and IT developments; Kavundampalayam (Ward 17) and Peelamedu (Ward 25) with prominent educational and commercial infrastructure; Ganapathy (Ward 30) with industrial and institutional developments; and Kalapatti (Ward 7), a key industrial zone, all reflect above-average population densities due to their strategic locations and land uses. The spatial population density pattern in the Coimbatore City Municipal Corporation in 2011 and 2024 are presented in maps 5.9 & 5.10.
The above analyses of density patterns in LPA indicates the density in the Municipal Corporation area is still low, indicating potential for densification. Further, densification is already taking place along major transit corridors and in and around educational institutions, Industrial, and Commercial developments.
DIRECTORATE OF TOWN & COUNTRY PLANNING - TAMIL NADU
DATA SOURCE
Census of India
SCALE
0 0.4250.85 1.7 2.55 3.4 Km
PROJECTION: UTM ZONE 43N DATUM: WGS 1984
Map 5.9: Population density within Coimbatore City Municipal Corporation – 2011
Population Density in Coimbatore City Municipal Corporation -2011
Map 5.10: Population density within Coimbatore City Municipal Corporation – 2024
Population Density in Coimbatore City Municipal Corporation -2024
DIRECTORATE OF TOWN &COUNTRY PLANNING - TAMIL NADU
DATA SOURCE
Coimbatore City Municipal Corporation
SCALE
0
0.4250.85
1.7
2.55
3.4
Table 5.7Persons with Disabilities population (2011) in Coimbatore District
Description
Age group
Total population of persons with disabilities (2011)
Coimbatore District
0-4
1661
5-9
2663
10-19
6763
20-29
8562
30-39
9013
40-49
8141
50-59
6458
60-69
4807
70-79
2826
80-89
1245
90+
249
Age not stated
64
Total
52452
Source: Census 2011
Town Panchayats
Town Panchayats
Town Panchayats
Town Panchayats
Town Panchayats
Town Panchayats
Town Panchayats
1
Chettipalayam
1,278
2,658
2,920
0
0
0
2
Dhaliyur
0
1,543
1,424
4
0
1
3
Ettimadai
1,367
1,687
2,694
0
119
79
4
Idikarai
868
900
1,402
0
0
8
5
Irugur
4,284
3,549
5,477
0
21
65
6
Kannampalayam
1,001
1,526
2,077
0
4
4
7
Mopperipalayam
989
1,343
1,565
0
9
4
8
Narasimhanaicken-palayam
530
524
1,172
0
0
6
9
Pallapalayam (Odderpalayam)
1,075
1,949
1,418
0
12
0
10
Othakalmandapam
1,123
1,542
1,479
0
6
69
11
Periyanaicken-palayam
1,432
1,932
2,666
17
13
17
12
Perur
987
1,159
1,211
0
35
0
13
Pooluvapatti
1,870
2,390
2,901
61
56
22
14
Sarcarsamakulam
1,569
1,937
2,122
0
0
3
15
Sulur
3,711
2,953
4,231
0
3
12
16
Thenkarai
801
736
1,016
53
70
77
17
Thirumalayampalayam
2,360
2,421
2,904
183
87
164
18
Thondamuthur
1,802
1,738
2,274
184
188
193
19
Vedapatti
2,900
403
4,398
0
27
0
20
Veerapandi No. 4
1,738
2,340
2,732
68
56
36
21
Vellalur
2,344
2,887
4,389
0
0
16
S. No.
Name of the Local Body
SC Population
SC Population
SC Population
ST Population
ST Population
ST Population
S. No.
Name of the Local Body
1991
2001
2011
1991
2001
2011
Revenue Villages
Revenue Villages
Revenue Villages
Revenue Villages
Revenue Villages
Revenue Villages
Revenue Villages
Revenue Villages
1
Agraharasamakulam
1,015
1,383
1,461
0
0
0
2
Appanaickenpatti
817
899
947
0
0
0
3
Arasampalayam
828
742
947
0
0
0
4
Arasur
888
996
1,576
0
3
4
5
Arisippalayam
566
591
823
0
0
0
6
Bilichi
1,479
1,698
1,983
4
0
5
7
Bogampatti
203
216
170
0
0
0
8
Chikkarampalayam
1,184
1,837
2,045
0
7
9
9
Chinnathadagam
1,001
1,374
1,470
32
45
42
10
Devarayapuram
1,022
1,149
1,577
2
0
0
11
Edayapalayam
216
220
269
0
1
4
12
Karavelimadapur
1,067
1,303
1,674
0
0
0
13
Kadampadi
1,562
1,699
1,747
0
8
13
14
Kalangal
489
620
784
0
0
0
15
Kallapalayam
512
59
686
0
0
4
16
Kallipalayam
526
615
435
0
0
0
17
Kangayampalayam
729
801
1,163
0
9
5
18
Kaniyur
828
1,325
1,763
0
3
2
19
Karegoundenpalayam
971
1,526
1,803
0
0
0
20
Kariampalayam
588
959
1,141
0
0
0
21
Karunchamigoundenp-alayam
0
0
0
0
5
0
22
Kattampatti
562
626
790
0
0
4
23
Keeranatham
695
1,053
1,124
0
0
0
24
Kittampalayam
505
577
785
0
0
6
25
Kondayampalayam
998
1,065
1,093
0
0
5
26
Kunnathur
631
763
837
0
0
0
27
Kuppepalayam
262
473
543
0
0
1
28
Kurudampalayam & Ashokapuram
1,887
2,255
3,379
0
22
36
29
Kuthiraialampalayam
385
452
442
0
23
9
30
Madampatti
1,047
714
1,384
0
18
9
31
Malumichampatti
653
1,368
2,561
0
0
4
32
Marudur
1,329
1,159
1,561
116
204
260
33
Masagoundenchettipalayam
1,776
2,163
2,791
0
0
0
S. No.
Name of the Local Body
SC Population
SC Population
SC Population
ST Population
ST Population
ST Population
S. No.
Name of the Local Body
1991
2001
2011
1991
2001
2011
34
Mylampatti
276
378
597
0
0
0
35
Myleripalayam
786
1,115
1,381
13
0
0
36
Nachippalayam
735
952
1,033
0
0
0
37
Naickenpalayam
941
1,404
1,528
832
863
883
38
Nanjundapuram
1,165
1,126
1,594
13
7
43
39
Naranapuram
440
1,002
537
0
10
0
40
Neelambur
2,358
3,057
3,270
0
5
22
41
Pachapalayam (Sulur)
510
625
703
0
0
0
42
Pachapalayam (Annur)
356
532
556
0
0
0
43
Palathurai
995
1,175
1,214
0
0
0
44
Panappatti
339
568
450
0
4
0
45
Pannimadai
1,765
1,859
2,659
0
0
4
46
Pappampatti
469
199
961
0
0
0
47
Pattanam
827
944
1,234
0
0
0
48
Peedampalli
562
775
683
0
5
24
49
Perur Chettipalayam
1,842
2,394
2,968
0
0
4
50
Pichanur
885
1,467
1,523
19
130
69
51
Pottaiyandiporambu
305
330
357
37
46
71
52
Rasipalayam
543
673
702
0
0
0
53
Seerappalayam
881
1,016
1,041
0
0
0
54
Sellakkarichal
1,123
1,438
1,610
0
0
0
55
Semmandampalayam
996
1,293
1,339
0
0
0
56
Solavampalayam
1,081
1,207
1,364
0
0
3
57
Somayampalayam
701
1,356
1,588
0
6
21
58
Thambagoundenpalayam
169
177
87
0
0
0
59
Theethipalayam
715
977
1,395
5
0
25
60
Thennammanallur
1,162
1,357
1,838
0
0
1
61
Vadaputhur
450
546
706
0
4
15
62
Vadavalli (Annur)
709
868
938
0
0
0
63
Valukkupparai
1,048
1,275
1,368
0
34
55
64
Veerapandi No. 24 (part)
492
695
727
2,105
306
2,820
65
Vellamadai
463
669
808
0
0
4
66
Vellanaipatti
612
813
1,002
0
0
5
Coimbatore LPA
Coimbatore LPA
2,02,695
2,25,104
3,12,168
5,162
3,776
7,065
Source: Census of India
85.1
79.8
82.4
1
Added areas
83.8
77.5
80.7
Municipalities
Municipalities
Municipalities
Municipalities
Municipalities
1
Gudalur
81.9
73.2
77.6
2
Karamadai
81.1
73.4
77.3
3
Karumathampatti
80.1
69.2
74.7
4
Madukkarai
80.6
71.3
75.9
S. No.
Villages
Literacy rate (%)
Literacy rate (%)
Literacy rate (%)
S. No.
Villages
Male
Female
Overall
Town Panchayats
Town Panchayats
Town Panchayats
Town Panchayats
Town Panchayats
1
Chettipalayam
75.8
65.0
70.5
2
Dhaliyur
78.2
65.8
72.0
3
Ettimadai
71.4
59.5
65.5
4
Idikarai
77.7
67.5
72.6
5
Irugur
82.7
73.8
78.3
6
Kannampalayam
83.3
75.2
79.3
7
Mopperipalayam
74.5
61.6
68.1
8
Narasimhanaicken-palayam
84.9
76.6
80.8
9
Pallapalayam (Odderpalayam)
84.8
77.2
81.0
10
Othakalmandapam
80.1
69.6
74.8
11
Periyanaicken-palayam
85.1
77.2
81.2
12
Perur
81.1
72.4
76.8
13
Pooluvapatti
70.1
56.4
63.2
14
Sarcarsamakulam
82.7
73.8
78.2
15
Sulur
82.7
74.7
78.7
16
Thenkarai
67.9
51.8
59.8
17
Thirumalayampalayam
73.2
60.5
66.8
18
Thondamuthur
77.0
65.5
71.1
19
Vedapatti
78.5
68.5
73.4
20
Veerapandi No. 4
82.0
73.4
77.7
21
Vellalur
83.5
73.6
78.7
Revenue Villages
Revenue Villages
Revenue Villages
Revenue Villages
Revenue Villages
1
Agraharasamakulam
65.3
52.0
58.7
2
Appanaickenpatti
70.7
62.8
66.8
3
Arasampalayam
73.1
56.6
64.8
4
Arasur
78.3
68.9
73.7
5
Arisippalayam
72.9
66.2
69.6
6
Bilichi
74.9
64.1
69.5
7
Bogampatti
72.2
52.5
62.7
8
Chikkarampalayam
77.7
66.6
72.1
9
Chinnathadagam
75.1
61.1
68.0
10
Devarayapuram
69.2
58.1
63.6
11
Edayapalayam
82.3
65.0
73.7
12
Karavelimadapur
74.8
59.9
67.4
S. No.
Villages
Literacy rate (%)
Literacy rate (%)
Literacy rate (%)
S. No.
Villages
Male
Female
Overall
13
Kadampadi
77.1
68.0
72.6
14
Kalangal
75.6
63.2
69.6
15
Kallapalayam
81.8
71.2
76.7
16
Kallipalayam
73.5
61.3
67.4
17
Kangayampalayam
82.9
73.7
78.6
18
Kaniyur
78.4
65.5
72.0
19
Karegoundenpalayam
73.8
61.6
67.7
20
Kariampalayam
70.5
55.7
63.1
21
Karunchamigoundenpalayam
64.9
59.3
62.1
22
Kattampatti
77.8
66.9
72.3
23
Keeranatham
75.1
60.2
67.6
24
Kittampalayam
74.3
61.8
68.0
25
Kondayampalayam
72.9
62.7
67.8
26
Kunnathur
80.7
64.4
72.6
27
Kuppepalayam
65.7
51.9
59.0
28
Kurudampalayam & Ashokapuram
85.5
77.9
81.9
29
Kuthiraialampalayam
70.5
52.9
61.3
30
Madampatti
76.9
63.4
70.1
31
Malumichampatti
80.9
73.9
77.5
32
Marudur
71.3
58.4
64.9
33
Masagoundenchettipalayam
72.5
56.8
64.7
34
Mylampatti
76.8
64.9
71.0
35
Myleripalayam
71.2
56.0
63.5
36
Nachippalayam
72.8
61.3
67.1
37
Naickenpalayam
73.6
59.6
66.6
38
Nanjundapuram
74.5
61.0
67.8
39
Naranapuram
74.4
60.2
67.2
40
Neelambur
33.6
29.4
31.5
41
Pachapalayam (Sulur)
72.8
55.6
64.3
42
Pachapalayam (Annur)
67.4
52.0
59.8
43
Palathurai
76.7
63.2
69.9
44
Panappatti
74.2
57.0
66.0
45
Pannimadai
75.1
63.9
69.6
46
Pappampatti
74.3
64.1
69.1
47
Pattanam
83.2
74.1
78.7
S. No.
Villages
Literacy rate (%)
Literacy rate (%)
Literacy rate (%)
S. No.
Villages
Male
Female
Overall
48
Peedampalli
81.9
71.1
76.5
49
Perur Chettipalayam
79.0
69.5
74.3
50
Pichanur
75.4
62.5
68.9
51
Pottaiyandiporambu
65.7
52.1
58.9
52
Rasipalayam
79.6
64.0
71.8
53
Seerappalayam
80.9
70.3
75.8
54
Sellakkarichal
78.7
62.0
70.4
55
Semmandampalayam
74.3
63.6
68.9
56
Solavampalayam
69.9
57.6
63.8
57
Somayampalayam
80.0
71.6
75.8
58
Thambagoundenpalayam
82.5
73.0
77.6
59
Theethipalayam
79.7
67.0
73.4
60
Thennammanallur
73.5
57.0
65.1
61
Vadaputhur
77.5
64.2
70.8
62
Vadavalli (Annur)
71.5
58.1
64.7
63
Valukkupparai
70.3
54.6
62.2
64
Veerapandi No. 24 (part)
71.0
56.0
63.6
65
Vellamadai
65.4
50.9
58.2
66
Vellanaipatti
76.9
64.3
70.5
Coimbatore LPA
Coimbatore LPA
82.6
75.2
78.9
Source: Census 2011
5.5.4 Sex Ratio
As per the 2011 Census, the sex ratio in Coimbatore LPA stands at 995 females per 1,000 males, matching the state average for Tamil Nadu. However, it is lower compared to other cities in the same category. The rural areas within the LPA show an even lower sex ratio. This disparity is partly due to male migrant workers, who often live alone in the city while their families remain in their native places, mainly due to high rents or a lack of affordable housing.
Source: Census of India
Figure 5.2: Sex Ratio of Coimbatore LPA
iii. It is also to be noted that the LPA constitutes 1 Municipality, 5 Town Panchayats and 8 villages that fall (either partly or fully) under Hill Areas Conservation Authority (HACA) which are ecologically sensitive areas that have developmental restrictions in view of their fragile nature.
Various methods have been used for projection of population for LPA in the coming decades till the horizon year (2041). These include arithmetical increase method, geometrical increase method, incremental increase method, exponential method and the least square method. The population of Coimbatore LPA has been projected up to the horizon year 2041 taking into consideration the decadal population trend from 1991 to 2011. Following table shows the population projection of Coimbatore LPA for the horizon of 2041 using various methods mentioned above.
Table 5.11Projected Population of Coimbatore LPA using various methods
Year
Arithmetical Increase
Geometrical Increase
Arithmetic method + Geometrical Method*
Incremental Increase
Exponential method
Least Square method
1991
15,87,978
2001
19,36,811
2011
24,57,452
2021
28,99,667
31,82,837
31,62,392
30,51,638
32,05,480
28,63,554
2031
33,41,881
42,70,435
42,04,955
38,08,567
43,44,317
32,99,754
2041
37,84,096
59,72,861
58,24,706
47,28,491
61,65,617
37,39,856
To realistically assess the expected population in future years, a combination of methods has been used. The geometrical increase method is applied to all constituent units, except for areas under the Hill Area Conservation Authority (HACA), while the arithmetical increase method is used for HACA areas, based on past trends. The graph below illustrates the projected population of the Coimbatore LPA area using these different methods.
Figure 5 4: Projected population trend for Coimbatore LPA
The following have been kept in view while considering the appropriate method for ppopulation projection:
i. Areas falling under Hill Areas Conservation Authority (HACA) are considered to have only natural growth in view of limitations on development.
ii. The draft Coimbatore Regional Plan-2047 has identified geometric increase method of population projection as the best suited for Coimbatore district which is undergoing rapid expansion due to factors like employment opportunities and improved infrastructure and has accordingly used the same for projecting population of the district by 2047.
iii. Considering the growth potential of Coimbatore, the growth trend will continue to consistently increase and accordingly the few administrative units which had shown negative growth rates have been adjusted with overall growth trends.
Table 5.12Projected Population for Coimbatore LPA
Description
Existing Population
Projected Population
1991
2001
2011
2021
2031
2041
CCMC
10,27,948
12,51,336
15,84,719
20,51,719
27,64,842
39,03,784
Municipalities
75,639
1,02,701
1,39,444
1,82,262
2,36,449
3,05,996
Town Panchayats
2,12,936
2,44,916
3,03,834
3,73,063
4,59,188
5,67,685
Revenue Villages
2,71,455
3,37,858
4,29,455
5,55,347
7,44,476
10,47,241
Coimbatore LPA
15,87,978
19,36,811
24,57,452
31,62,392
42,04,955
58,24,706
Source: Census of India & DTCP
Table 5.13Projected Population, growth rate and population density using Geometrical method and Arithmetic method
S. No.
Name of the Local Body
Projected Population
Projected Population
Projected Population
Projected Decadal Growth Rate(in %)
Projected population density
Projected population density
S. No.
Name of the Local Body
2021
2031
2041
2031-2041
2031
2041
1
Coimbatore City Municipal Corporation
20,51,719
27,64,842
39,03,784
41.2
10724
15142
Coimbatore (Old Municipal Corporation)
11,91,951
13,52,164
15,33,912
13.4
12805
14526
Added areas
8,59,768
14,12,678
23,69,872
67.8
9281
15570
Municipalities
Municipalities
Municipalities
Municipalities
Municipalities
Municipalities
Municipalities
Municipalities
1
Gudalur
48,369
57,878
67,388
16.4
1,935
2253
2
Karamadai
46,401
61,225
80,785
31.9
3,172
4186
3
Karumathampatti
49,212
69,073
96,950
40.4
2,570
3607
4
Madukkarai
38,281
48,273
60,873
26.1
2,248
2835
Town Panchayats
Town Panchayats
Town Panchayats
Town Panchayats
Town Panchayats
Town Panchayats
Town Panchayats
Town Panchayats
1
Chettipalayam
14,323
19,790
27,344
38.2
577
798
2
Dhaliyur
13,027
14,553
16,080
10.5
675
746
3
Ettimadai
11,165
12,977
14,790
14
789
900
4
Idikarai
9,579
10,563
11,648
10.3
927
1023
5
Irugur
30,486
36,177
42,929
18.7
1,749
2075
6
Kannampalayam
22,150
30,920
43,161
39.6
1,936
2703
7
Mopperipalayam
14,408
19,005
25,068
31.9
871
1148
8
Narasimhanaicken palayam
23,301
28,744
34,187
18.9
4,512
5367
9
Pallapalayam (Odderpalayam)
17,339
25,242
36,747
45.6
4,508
6562
10
Othakalmandapam
13,885
15,795
17,966
13.7
1,142
1299
11
Periyanaicken-palayam
30,846
36,694
43,651
19
3,912
4654
12
Perur
8,233
8,469
8,711
2.9
1,386
1426
13
Pooluvapatti
13,736
14,680
15,689
6.9
893
954
14
Sarcarsamakulam
13,003
16,434
20,769
26.4
1,300
1643
15
Sulur
33,131
39,330
46,689
18.7
3,589
4260
16
Thenkarai
7,663
7,976
8,290
3.9
625
650
17
Thirumalayampalayam
13,595
15,195
16,982
11.8
496
554
18
Thondamuthur
13,034
14,576
16,118
10.6
1,089
1204
19
Vedapatti
15,015
19,337
24,905
28.8
3,149
4056
20
Veerapandi No. 4
22,848
30,794
41,503
34.8
2,493
3361
21
Vellalur
32,297
41,939
54,459
29.9
2,592
3366
S. No.
Name of the Local Body
Projected Population
Projected Population
Projected Population
Projected Decadal Growth Rate(in %)
Projected population density
Projected population density
S. No.
Name of the Local Body
2021
2031
2041
2031-2041
2031
2041
Revenue Villages
Revenue Villages
Revenue Villages
Revenue Villages
Revenue Villages
Revenue Villages
Revenue Villages
Revenue Villages
1
Agraharasamakulam
4,567
5,033
5,546
10.2
490
540
2
Appanaickenpatti
4,386
4,818
5,294
9.9
257
282
3
Arasampalayam
4,662
5,691
6,949
22.1
452
552
4
Arasur
24,345
51,491
1,08,909
111.5
2,557
5,408
5
Arisippalayam
2,702
3,042
3,425
12.6
280
316
6
Bilichi
11,874
13,541
15,442
14
485
553
7
Bogampatti
2,963
3,634
4,458
22.7
193
237
8
Chikkarampalayam
12,896
16,237
20,444
25.9
1,118
1,408
9
Chinnathadagam
9,441
10,474
11,508
9.9
1,027
1,128
10
Devarayapuram
6,916
7,414
7,913
6.7
533
568
11
Edayapalayam
2,544
2,875
3,249
13
241
273
12
Karavelimadapur
7,038
8,806
11,016
25.1
1,297
1,622
13
Kadampadi
8,656
9,196
9,771
6.2
765
813
14
Kalangal
6,530
7,629
8,912
16.8
508
594
15
Kallapalayam
3,163
3,263
3,366
3.2
226
234
16
Kallipalayam
3,360
4,003
4,768
19.1
529
631
17
Kangayampalayam
10,821
14,192
18,612
31.1
1,865
2,446
18
Kaniyur
18,615
28,851
44,715
55
1,574
2,439
19
Karegoundenpalayam
9,271
11,413
14,051
23.1
534
657
20
Kariampalayam
5,317
6,285
7,430
18.2
766
906
21
Karunchamigounden palayam
730
1,554
3,307
112.8
375
799
22
Kattampatti
7,329
9,168
11,468
25.1
849
1,062
23
Keeranatham
5,574
6,600
7,816
18.4
496
587
24
Kittampalayam
6,093
8,510
11,887
39.7
818
1,142
25
Kondayampalayam
7,775
9,110
10,673
17.2
1,005
1,178
26
Kunnathur
4,941
5,704
6,583
15.4
633
731
27
Kuppepalayam
3,108
3,469
3,872
11.6
263
293
28
Kurudampalayam
60,866
1,16,713
2,23,801
91.8
9,111
17,471
29
Kuthiraialampalayam
1,522
1,600
1,682
5.1
606
637
30
Madampatti
7,511
8,250
8,990
9
534
582
31
Malumichampatti
21,951
37,247
63,204
69.7
2,357
4,000
32
Marudur
10,888
12,491
14,329
14.7
429
492
33
Masagounden chettipalayam
10,546
11,566
12,684
9.7
423
464
S. No.
Name of the Local Body
Projected Population
Projected Population
Projected Population
Projected Decadal Growth Rate(in %)
Projected population density
Projected population density
S. No.
Name of the Local Body
2021
2031
2041
2031-2041
2031
2041
34
Mylampatti
3,895
5,374
7,416
38
1,117
1,542
35
Myleripalayam
5,874
6,914
8,139
17.7
621
731
36
Nachippalayam
3,439
3,931
4,494
14.3
759
868
37
Naickenpalayam
6,356
6,798
7,240
6.5
457
486
38
Nanjundapuram
10,702
12,049
13,396
11.2
1,003
1,115
39
Naranapuram
2,200
2,294
2,391
4.2
250
261
40
Neelambur
21,791
25,474
29,778
16.9
1,107
1,294
41
Pachapalayam (Sulur)
2,541
2,736
2,947
7.7
175
189
42
Pachapalayam (Annur)
3,190
3,470
3,774
8.8
474
516
43
Palathurai
2,845
2,967
3,095
4.3
863
900
44
Panappatti
3,282
4,089
5,094
24.6
338
422
45
Pannimadai
18,019
23,553
30,788
30.7
3,149
4,116
46
Pappampatti
4,877
5,740
6,757
17.7
560
659
47
Pattanam
12,243
16,301
21,702
33.1
1,545
2,057
48
Peedampalli
4,326
4,803
5,333
11
353
392
49
Perur Chettipalayam
22,096
26,383
30,670
16.2
2,360
2,743
50
Pichanur
7,428
8,813
10,456
18.6
471
559
51
Pottaiyandiporambu
1,650
1,780
1,920
7.9
354
382
52
Rasipalayam
4,921
5,494
6,134
11.7
985
1,099
53
Seerappalayam
7,070
8,500
10,219
20.2
715
860
54
Sellakkarichal
6,778
7,400
8,078
9.2
349
380
55
Semmandampalayam
6,890
7,952
9,177
15.4
571
659
56
Solavampalayam
7,867
9,691
11,937
23.2
1,114
1,372
57
Somayampalayam
19,750
24,712
29,675
20.1
1,886
2,265
58
Thambagounden palayam
571
678
803
18.6
257
304
59
Theethipalayam
10,611
12,592
14,574
15.7
940
1,088
60
Thennammanallur
5,531
6,001
6,511
8.5
703
762
61
Vadaputhur
6,778
8,876
11,623
30.9
837
1,096
62
Vadavalli (Annur)
4,280
4,747
5,264
10.9
306
339
63
Valukkupparai
5,401
5,963
6,585
10.4
351
388
64
Veerapandi No. 24 (part)
10,004
13,294
17,665
32.9
372
494
65
Vellamadai
7,941
9,172
10,596
15.5
534
616
66
Vellanaipatti
5,303
6,066
6,939
14.4
369
423
Coimbatore LPA
Coimbatore LPA
31,62,392
42,04,955
58,24,706
38.5
2746
3803
From 2001 to 2011, Coimbatore LPA experienced a decadal population growth increase from 22.0% to 26.9%, indicating a steady rise in the growth rate over this period. The projected population for Coimbatore LPA in 2031 is 4,260,191, with a density of 2,782 persons per Sq.km, and for 2041, the density is expected to rise to 3,961 persons per Sq.km. The projected decadal growth rates are 33.0% for 2021-2031 and 38.5% for 2031-2041. The newly added areas within the Municipal Corporation and revenue villages are anticipated to experience higher growth.
Accordingly, the projected population of Coimbatore Local Planning Area will be 58.24 lakhs which has been adopted in the plan for future assessments and implementation planning.
Table 5.14Projected growth rate for Coimbatore LPA
Administrative Units
Existing growth rate
Projected growth rate
1991-2001
2001-2011
2011-2021
2021-2031
2031-2041
CCMC
21.7
26.6
29.5
34.8
41.2
Municipalities
35.8
35.8
30.7
29.7
29.4
Town Panchayats
15.0
24.1
22.8
23.1
23.6
Revenue Villages
24.5
27.1
29.3
34.1
40.7
Coimbatore LPA
21.9
26.8
28.7
33.0
38.5
The Projected population for the years 2021, 2031 and 2041 along with the projected densities during the respective years are presented in the maps (5.11 – 5.17).
Map 5.11: Projected Population for Coimbatore LPA – 2021
PROJECTED POPULATION - 2021
Map 5.12: Projected Population for Coimbatore LPA – 2031
PROJECTED POPULATION - 2031
Map 5.13: Projected Population for Coimbatore LPA – 2041
PROJECTED POPULATION - 2041
Map 5.14:Projected Population growth for Coimbatore LPA – 2041
PROJECTED POPULATION GROWTH RATE - 2041
Map 5.15: Projected Population density for Coimbatore LPA – 2021
PROJECTED POPULATION DENSITY - 2021
Map 5.16: Projected Population density for Coimbatore LPA – 2031
PROJECTED POPULATION DENSITY - 2031
Map 5.17: Projected Population density for Coimbatore LPA – 2041
PROJECTED POPULATION DENSITY - 2041
6.3.2Secondary Sector
Industries play a vital role in contributing to the economic output in Coimbatore. Strong industrial base, including textile manufacturing, engineering, and small-scale industries. Industrial areas are strategically distributed to support economic activities, job creation, and urban development.
Source: District Income Estimates, Department of Economics and Statistics
Figure 6.9: Contribution of key secondary sector activities at district level from 2017-18 to 2022-23 (at constant prices)
The manufacturing sector plays a pivotal role in Coimbatore’s secondary sector, significantly driving economic activities, as illustrated in Figure 6.9. Although the share of the secondary sector in Coimbatore’s Gross District Domestic Product (GDDP) has remained relatively stagnant, there has been a notable increase in the value of output over the years. A temporary dip in production between 2019–20 and 2020–21 was primarily due to the disruptions caused by the COVID-19 pandemic and the resulting lockdown measures.
However, post-pandemic, the manufacturing sector witnessed a robust recovery, with a remarkable 25% increase in output during 2021–22. This suggests a strong resurgence in industrial activities and a significant rebound from the pandemic’s impact. The resilience shown by the sector underscores its critical role in Coimbatore’s economic recovery and long-term growth.
Micro, small, and medium enterprises (MSMEs), which form the backbone of the manufacturing sector, have been at the forefront of this recovery. These enterprises contribute not
only to the district’s output but also to employment generation, innovation, and value-added production. As the sector continues to grow, it holds substantial potential to contribute further to Coimbatore’s economic development, particularly through greater integration of technological advancements, scalability, and improved export performance.
6.3.1Primary Sector
The Figure 6.6 shows the value addition by key sub- sectors in the primary sector, i.e., livestock, agriculture and forestry. The contribution of the primary sector as part of
the GDPP has increased from 5 % in 2017-18 to 10% in 2022-23, mainly aided by the contribution of the livestock sector with a compounded annual growth rate of more than 18%.
[Source: District Income Estimates, Department of Economics and Statistics]
Figure 6.6: Contribution of key primary sector activities at district level from 2017-18 to 2022-23 (at constant prices)
6.3.1.1 Agriculture
Coimbatore consists of diverse farming practices, due to the favourable climate and fertile soil.
Map 6.1: Percent of total block area under agriculture land
Percent of total block area under agriculture land
The Map 6.1 illustrates the total agricultural land area at the block level and its distribution across the Coimbatore district. Agricultural land coverage is higher in the northern and southern peripheral regions of the Coimbatore Local Planning Area (LPA), particularly in the blocks of Annur, Karamadai, and Kinathukadavu. A decline in agricultural land is observed when moving from the western to the eastern parts of the Coimbatore LPA.
The type of food crops common in Coimbatore include cereals, pulses, spices and condiments, fruits, vegetables, oilseeds like groundnut, gingelly, coconut, rapeseed and mustard, sunflower, castor, as well as cash crops like cotton and tobacco.
Source: Department of Agriculture
Figure 6.7: Quantity of major crops produced from 2021-22 to 2023-24
The production of crops such as ground nut, other pulses, cowpea, Bengal gram, cumbu, sorghum and paddy are observed to be decreasing over time. The increase in production quantity is observed in sugarcane, redgram, ragi and samai. Among the crops, sugarcane has the highest quantity of production in 2023-24.
Coimbatore sustained high maize & sorghum production (2021-24) which are mainly used as animal feed. Maize peaked at 50,700 MT (2022-23), while sorghum ranged from 23,903 MT to 17,585 MT (2023-24). This has played a major role in improving the contribution of the livestock sector to the GDDP of Coimbatore.
6.3.1.2 Livestock sector
The livestock sector in Coimbatore plays a crucial role in the agricultural economy, with a strong focus on cattle for milk production, goats for meat, and poultry farming with a CAGR of 18.9% for the period from 2017-18 to 2022-23. The steady growth highlights the expanding demand for dairy, meat, and poultry products, along with improved farming practices.
Coimbatore’s semi-arid climate and fertile soil support fodder cultivation and the availability of water resources in certain pockets help in maintaining dairy and poultry farms. The increase in growth rate can also be attributed to the shift from subsistence to commercial livestock farming (especially in poultry and dairy). Government initiatives like distribution of free cattle and other livestock in addition to schemes like National Livestock Mission have encouraged the growth of the livestock sector.
The well-established livestock population supports various economic activities, making it essential to focus on sustainable management and resource efficiency to maintain this positive trend. The livestock are categorized into different species and sub-classifications, offering insights into the distribution and composition.
Table 6.1Livestock Population (Buffalo and Cattle)
S. No Classification 1 Male:
Num Buffalo
bers <sub>Cattle</sub>
i.Under one year
431
7,018
ii.1 to 2.5 Years
306
1,594
iii.Over 2.5 year
117
1,983
Male Total:
854
10,595
2 Female:
35,853
i. Under one year
306
26,918
ii. 1 to 2.5 years
226
76,625
iii. Over 2.5 years
207
139,396
Female Total:
739
3 Among Female:
a. In milk
533
125,800
b. Dry
94
27,157
c. Not Calved
536
15,579
even once
d. Others
10
1,769
Female Total:
1173
170,305
Source: District Census handbook 2023-2024
The data highlights a well-established domestic animal population and a diverse range of livestock supporting various economic activities. Continued monitoring and efficient management of livestock resources will be crucial for sustainable agricultural development in Coimbatore.
6.3.1.3 Dairy development and milk production
Dairy development and milk production activities in Coimbatore range from small-scale family farms to largescale dairy operations, ensuring a steady supply of milk, an essential nutrient for public health. The district has a strong presence of societies involved in dairy activities. Notably, the Aavin Milk Production Co-operative Societies operate 322 milk societies, collectively producing 3,54,25,221 liters of milk, valued at approximately ₹120.94 crore. Additionally, the region is supported by essential dairy infrastructure, including one government dairy, one chilling centre, and 21 bulk milk coolers, further strengthening the dairy supply chain and supporting rural livelihoods
Source: District Census Handbook – 2023 -24
Figure 6.8: Quantity of milk produced in the Coimbatore district from 2018-19 to 2023-24
The Perur taluk of Coimbatore LPA exhibits a high concentration of dairy farming activity, supported by an Aavin production hub. This combination indicates that Perur and its surrounding areas contribute to the milk production and are considered as an emerging scope for dairy based industries.
6.2.5Leveraging Innovation and Diversification of Economic Activities
Aligning with state level policies for attracting investments into diversified, and formal segments would be beneficial for Coimbatore’s economy.
Beyond its traditional strengths in textiles and engineering, Coimbatore is emerging as a hub for information technology, renewable energy, and start-up innovation. The city has seen the rise of over 200 tech start-ups, supported by incubators like Forge Accelerator and KCT-TBI. Major companies like Cognizant and Ford Business Solutions have expanded operations in the planning area. The region’s culture of innovation, combined with institutional support, has enabled seamless diversification into high-value, knowledgedriven sectors [Source: STPI Coimbatore, KCT-TBI]
The economic profile of Coimbatore can be analysed by looking at the trend of the Gross Domestic Product of Coimbatore as it is one of the key indicators to understand the economic performance through analysis of market value of all goods and services for a selected period.
Source: District Income Estimates, Department of Economics and Statistics
Figure 6.1: Trend of Coimbatore LPA’s Gross Domestic Product
Figure 6.2 sectoral contribution of GDP in Coimbatore LPA 2017-18 to 2022-23. Coimbatore’s economy shows strong resilience and post pandemic recovery. This can be seen from the growth rates in the post pandemic period. The growth rate was about 7.4 % in the 2021-22 and greater than 9 % in the year 2022-23. The recovery presumably may be aided by the growth in demand and the stimulus given by the government through various packages.
Source: District Income Estimates, Department of Economics and Statistics
Figure 6.2: Composition of Coimbatore GDPP (at constant prices) for the period from 2017-18 to 2022-23
In Coimbatore district, a diverse range of economic activities are present that contribute to the economic development. The secondary and tertiary sectors generate a higher contribution in the district. The share of the primary sector has increased from 5% to 9% mainly aided by the growth in the livestock sector. The secondary sector shows signs of industrial revival post pandemic aided by government recovery packages and infrastructure projects. The tertiary sector occupies the highest share in the economic output
of the district, which is consistently close to 50 %. There is a huge potential for expansion of the region’s economy by expanding the tertiary sector.
Source: District Income Estimates, Department of Economics and Statistics
Figure 6.3: Comparison of GDDP of Coimbatore and GSDP of Tamil Nadu (at constant prices)
Figure 6.3 shows that the share of Coimbatore GDDP share in Tamil Nadu has largely remained constant for the period from 2017-18 and 2022-23. However, it has grown from 5.89% in 2011-12 to 6.53% in 2022-23. The secondary and tertiary sectors have led to a higher share of the district’s GDDP in the state’s GSDP.
[Source: District Income Estimates, Department of Economics and Statistics]
Figure 6.4: Comparison of per capita GDDP of Coimbatore along with Tamil Nadu
For the period from 2017-18 to 2022-23, Coimbatore’s per capita Gross District Domestic Product (GDDP) consistently outperformed the state’s per capita Gross State Domestic Product (GSDP), as shown in Figure 6.4. Notably, Coimbatore’s per capita GDDP recorded a higher Compounded Annual Growth Rate (CAGR) of 5.65% during this period, compared to the state’s per capita GSDP growth of 4.79%. This gap in growth rates indicates that Coimbatore’s economic base not only recovered swiftly post-pandemic but also expanded at a faster pace relative to the broader state economy. The overview of existing economic activities based on the sectoral classification is as follows (Figure 6.5):
Figure 6 5: Overview of economic activities based on sectoral classification in Coimbatore LPA
6.2.4Inclusive growth
For the sustained prosperity of any urban region, economic growth must go hand in hand with inclusion. The strategy for Coimbatore focuses on ensuring equitable distribution of the wealth generated by aligning economic opportunities with the skills available in the labour force, improving access to markets, reducing fragmentation in the labour market, and increasing the formalization of the informal economy. This includes detailed profiling of the labour force, identifying mismatches with industry requirements, and implementing targeted skilling initiatives to enhance employability.
State-led initiatives such as the Tamil Nadu Urban Livelihood Mission (TNULM) and Deen Dayal Antyodaya Yojana - National Urban Livelihoods Mission (DAY-NULM) have contributed to strengthening the income base of the urban poor through skill development, self-employment subsidies, and the promotion of self-help groups (SHGs). Similarly, the Tamil Nadu State Rural Livelihood Mission (TNSRLM) has empowered rural women through entrepreneurial training, capacity building, and credit linkages. The Udyam Registration portal has further simplified the formalization process for small enterprises, particularly women-led and SC/ST-owned businesses, improving their access to institutional support and benefits.
These efforts are reinforced by Coimbatore’s local initiatives such as the District Skill Development Centre (DSDC) and rural industrial training hubs, which focus on skilling youth from underserved areas for employment in high-demand sectors. Together, these interventions foster
6.3 Economic Profile of Coimbatore
an inclusive growth model, ensuring that the benefits of industrial and technological progress are shared broadly— positioning Coimbatore as a leader in inclusive economic development in Tamil Nadu.
6.3.2.3Registered MSME units in 2024-25 based on their classification obtained from the Udayam Portal
The number of registered micro-enterprises is the highest among the manufacturing MSMEs in Coimbatore district, with 10,975 micro-enterprises recorded. In comparison, there are only 74 small enterprises and 6 medium enterprises. This overwhelming presence of microenterprises highlights a significant level of fragmentation within the manufacturing sector’s MSME landscape.
[Source: District Industrial Centre (DIC), Coimbatore]
Map 6.4: Map - Village wise distribution of the number of MSME manufacturing units in Coimbatore LPA
The distribution of newly registered manufacturing MSMEs across Coimbatore highlights the city’s industrial growth along key corridors, with a clear trend of expanding industrial zones in both urban and rural areas. This growth can be attributed to the proximity to major transport routes, the availability of skilled labor, and the establishment of industrial clusters that support MSME activities. Here’s an in-depth geographical analysis of the key zones:
Core Corporation Area: The Industrial Heart of Coimbatore - The core corporation area remains the principal hub for manufacturing activities in Coimbatore, hosting a significant concentration of industries, particularly in textiles, engineering, and automotive components. Its strategic proximity to essential infrastructure such as major roads, reliable electricity supply, and access to key markets continues to support industrial growth. This core area serves as a base for established industrial players while also attracting new MSMEs seeking centralized resources. However, it is noteworthy that traditional textile mills in the core area have gradually seen a decline in activity, reflecting broader shifts in industrial dynamics and evolving market trends.
Southern Zone: Key Manufacturing Clusters along Pollachi Road - Malumichampatti, Chettipalayam, Othakalmandapam, and Vellalore: These villages in the southern part of Coimbatore have shown a significant increase in manufacturing activity, with 100 to 150 MSMEs each. The proximity to Pollachi Road, a major arterial route, enhances connectivity with both urban markets and rural supply chains. The southern zone is poised to benefit from its linkages to both industrial and agricultural sectors, making it a strategic location for manufacturing industries, particularly in textiles and agro-based industries.
Northern Zone: Industrial Growth along Mettupalayam Road Gudalur, Karamadai, Idigarai, and Agararasamkulam: The northern part of Coimbatore, particularly along Mettupalayam Road, is emerging as a key industrial zone. This area is highly active, with a mix of manufacturing sectors, including engineering, textiles, and auto-components. The northern zone benefits from its proximity to the foothills of the Western Ghats,
providing access to natural resources, a skilled labor force, and markets in nearby districts. As these areas are connected by a key transportation route, they offer favorable conditions for MSME growth in manufacturing.
Western Zone: Expanding Manufacturing Activity in Somayampalayam - Somayampalayam: Located on the western edge of Coimbatore, Somayampalayam has seen notable manufacturing activity. This region benefits from its proximity to both rural agricultural areas and urban Coimbatore, which makes it an ideal location for agro-processing industries and light manufacturing units. As the region continues to develop, further industrial growth is expected along with infrastructure improvements, supporting MSME activity and enhancing overall industrial output in the region.
Northeastern Zone: Emerging Manufacturing Areas Along Sathy Road - Keeranatham, Sarkarsamakulam, Kattampatti, and Masagoundenchettipalayam: The northeastern part of Coimbatore, particularly along Sathy Road, has seen an increase in newly registered manufacturing MSMEs. These areas are positioned well for growth due to their proximity to key road networks that connect the region to Coimbatore city and other industrial zones. The northeastern zone’s growth is also supported by the availability of land for industrial expansion, making it an attractive location for new manufacturing enterprises, particularly in textiles and light engineering.
Eastern Zone: Growth Potential Along Sulur and Kadampadi - Growth Potential Along Sulur and Kadampadi - Kannampalayam, Sulur TP, and Kadampadi: The eastern part of Coimbatore, including areas like Kannampalayam, Sulur TP, and Kadampadi, is showing promising signs of industrial growth. These locations are increasingly being recognized for their potential to support light and medium manufacturing industries. The proximity to the airport, as well as the availability of land for industrial development, makes this region particularly attractive for MSMEs looking to expand into international markets or benefit from enhanced logistical connectivity.
6.3.2.4 Employment in the MSME Sector
The employment distribution across enterprises in Coimbatore district shows a clear dominance of micro enterprises. Micro enterprises employ the highest number of workers, accounting for 125,774 employees, owing to their large presence across the district. In comparison, small enterprises provide employment to 1,147 individuals, while medium enterprises employ 705 individuals. This significant concentration of employment in micro-enterprises highlights their crucial role in supporting the local economy and driving widespread job creation.
6.3.2.2MSME Manufacturing hubs
Coimbatore is considered as a one of the towns where MSMEs in the manufacturing sector shall play a key role in the growth and contribution of Coimbatore having significant potential for industrial development. The MSMEs , especially in the manufacturing sector can play a significant role in improving economic output and generating employment in the planning area.
The data has been received from District Industrial Centre, Coimbatore as per the old classification of the micro, medium and small enterprises is based on the investment and the turnover given per the Ministry of Micro, Small and Medium Enterprises (MSME) prior to April 2025, the classification of It is as follows:
A micro enterprise, where the investment in Plant and Machinery or Equipment does not exceed one crore rupees and turnover does not exceed five crore rupees.
● A small enterprise, where the investment in Plant and Machinery or Equipment does not exceed ten crore rupees and turnover does not exceed fifty crore rupees.
A medium enterprise, where the investment in Plant and Machinery or Equipment does not exceed fifty crore rupees and turnover does not exceed two hundred and fifty crore rupees.
6.3.2.1Manufacturing Sector
Over 8,000 MSME registrations are found within the corporation limits, showing a strong concentration in the city area. Towards the south, villages like Malumichampatti, Chettipalayam, and Othakalmandapam have between 400 to 1800 industries each. On the northern side, areas such as Idigarai, Periyanaickenpalayam, Veerapandi, and Bilichi also show a high number of registrations, especially along key corridors like Mettupalayam Road, Avinashi Road, and Pollachi Road.
In addition, major industries within the region have been mapped. These are mainly located along important transit routes. On Mettupalayam Road, northern villages like Kurudampalayam, Narasimhanaicken Palayam, Idigarai, Periyanayakkanpalayam, and Bilichi show high industrial concentration. Along Avinashi Road in the northeast, Neelambur, Arasur, and Kaniyur have more than 100 industries. Similarly, in the south, Pollachi Road covers areas like Malumichampatti, Chettipalayam, and Othakalmandapam, which are also highly active industrial zones.
Map 6.2: Village wise distribution of the number of MSME manufacturing units in Coimbatore LPA
INDUSTRIAL CLUSTERS
There are existing industrial layouts in Kalapatti, Malumichampatti, and Myleripalayam. Upcoming industrial parks like COSMIEA at Mopperipalayam, Anna Industrial Park at Kittampalayam, and CODISSIA at Kallapalayam are also being developed. These existing industries and MSME registrations clearly highlight the growth direction of the city, with active development happening along major corridors and in surrounding villages.
Southern Zone: Industrial Hubs and Corridors
Malumichampatti, Chettipalayam, and Othakalmandapam: These villages in the southern part of Coimbatore city show a significant concentration of industries. With over 400 to 1,800 industries in each of these areas, they form a major part of Coimbatore’s manufacturing landscape. This region benefits from its proximity to Pollachi Road, a key transit route connecting Coimbatore to the southern parts of Tamil Nadu. The southern zone is also close to agricultural areas, making it ideal for industries such as textile manufacturing, food processing, and agricultural equipment.
Strategic Positioning Along Pollachi Road: Pollachi Road serves as a central link between Coimbatore and the rural areas of the south. The proximity to industrial hubs like Malumichampatti and Chettipalayam allows industries in this area to easily access raw materials and markets while benefiting from a skilled workforce from the surrounding villages.
Northern Zone: A Hub for Engineering and Manufacturing
Idigarai, Periyanaickenpalayam, Veerapandi, and Bilichi: The northern part of Coimbatore features key industrial concentrations, particularly along Mettupalayam Road, which connects Coimbatore to the foothills of the Western Ghats. This region benefits from its access to both urban and rural resources, making it ideal for engineering, manufacturing, and auto-components industries. These areas are located near transportation routes that link Coimbatore with Mettupalayam, which is a gateway to hill stations and rural markets in the northern part of Tamil Nadu.
Proximity to Industrial Clusters: These areas are strategically located near some of Coimbatore’s largest
industrial clusters, such as those focused on automotive parts and precision engineering. This proximity enhances the efficiency of supply chains and makes these areas attractive for industries relying on just-in-time delivery systems and easy transportation of heavy machinery or equipment.
Eastern Corridor: Emerging Industrial Areas
Neelambur, Arasur, and Kaniyur: Situated along Avinashi Road in the northeast, these villages have seen a growing industrial footprint, particularly in the textiles and auto-components sectors. With more than 100 industries in each area, this corridor has emerged as a key manufacturing hub. Neelambur and Arasur are strategically located near Coimbatore’s growing industrial parks, offering access to well-developed infrastructure and logistics networks. These areas are particularly beneficial for industries requiring high connectivity to Coimbatore’s main industrial clusters and easy access to international trade routes through the airport and railways.
Industrial Growth Around Avinashi Road: The rise of these areas along Avinashi Road highlights the expansion of Coimbatore’s industrial base beyond its traditional manufacturing zones. This corridor’s continued industrialization is expected to drive Coimbatore’s growth as a diversified economic hub.
Western Corridor: Access to Regional and National Markets
Kalapatti, Malumichampatti, and Myleripalayam: These areas lie to the west of Coimbatore and are historically known for their textile industries. The proximity to major roads, including the Coimbatore-Pollachi and Coimbatore-Mettupalayam highways, allows easy access to regional markets in Kerala and Karnataka. Kalapatti and Myleripalayam have seen a rise in MSME registrations, and the establishment of industrial layouts here offers potential for industrial growth in manufacturing, textiles, and engineering services.
Rural-Urban Linkages: These western regions also benefit from strong rural-urban linkages, where the availability of skilled labor from surrounding rural areas complements the industrial demand for manufacturing jobs. This ruralurban synergy helps drive the growth of MSMEs and larger manufacturing units.
Industrial Parks and Future Growth Zones
Upcoming Industrial Parks: The development of industrial parks such as COSMIEA at Mopperipalayam, Anna Industrial Park at Kittampalayam, and CODISSIA at Kallapalayam is expected to play a pivotal role in shaping the industrial geography of Coimbatore. These parks are strategically located to provide not only industrial facilities but also infrastructure like water, electricity, and waste management systems, which can support sustainable industrial growth.
Urbanization and Future Expansion: As Coimbatore’s industrial activities expand, urbanization will naturally occur around these growing industrial zones. The development of these parks is expected to catalyze further growth in surrounding areas, including transportation and logistics, thereby enhancing the region’s connectivity and economic potential.
Map 6.3: Distribution of industries within the Coimbatore LPA
Spatial Growth of Industries (2016- 2041)
The Map 6.3 shows that the industrial activities are predominantly concentrated in the central, eastern, and southern parts of Coimbatore. The distribution of industries is marked with purple dots, indicating individual industrial units, while major industrial estates are represented by large red circles. The key industrial zones include areas near Sulur, Kaniyur, and Peelamedu. The industrial zones are mainly aligned along major transport corridors including Avinashi Road, Sathyamangalam Road and Mettupalayam Road.
6.3.2.5Industrial growth and Agglomerations - Trend analysis (2014 – 2024)
Industrial Growth trends have been analysed in Coimbatore LPA from 2013 to 2024. It identifies villages with highest industrial approval and proposes areas for future growth. The analysis is based on distribution of approved industrial buildings and layouts across LPA. The analysis shall provide insights on growth direction and predominant areas of industrial clusters with high scope of development within the planning area.
Map 6.5: Village wise Number of Approval received from 2014 to 2024 in LPA
Approved industrial buildings area (2014-2024)
The Map 6.5 shows industrial approvals concentrated in specific directions.
Industrial Growth Corridors
North-East Corridor:
● Key Areas: Mopperipalayam, Karumathampatti, Kittampalayam, Masagavundenchettipalaym, and Keeranatham
Key Characteristics: These areas have seen significant industrial approvals, ranging from 50,000 to 1,00,000 square meters. The corridor benefits from robust highway connectivity and established transportation links, making it a prime location for future development. The potential for industrial growth here is high due to the strategic location along key transit routes and proximity to the growing urban and industrial hubs.
Key Characteristics: This corridor is one of the most developed industrial zones, with approvals exceeding 100,001 square meters. The SIDCO Industrial Estate, a well-established industrial park, continues to drive economic activity and industrial development in the region. The area is highly suitable for further industrial investments due to its infrastructure and connectivity.
The North-East and South-West corridors are particularly promising for industrial growth. Villages like Chettipalayam, Kuniyamuthur, and SIDCO Industrial Estate not only have high industrial approval rates but also boast excellent connectivity, making these regions ideal for future investments and industrial expansion.
This structure organizes the information by specific corridors, highlighting key areas and characteristics within each, providing a clear and targeted overview of industrial growth opportunities in Coimbatore. Let me know if you’d like to add more details or adjust the focus.
Coimbatore’s engineering sector is a significant contributor to the region’s economy. Coimbatore is renowned for its pump and motor manufacturing industry, which supplies over 40% of India’s requirements, highlighting its pivotal role in the national market.