15.3.1 Air Quality:
The introduction of chemicals, particulate matter, or biological materials that cause harm or discomfort to human beings or other living creatures and interfere with their normal functioning, is termed as Air pollution. The uncontrolled and irregulated industrialization of society, ever increasing number of motorized vehicles combined with exponential growth in population, has led to air pollution.
The major sources of pollutants in urban areas are transportation (predominantly automobiles) and fuel combustion in stationary sources, including residential, commercial, with industrial heating and cooling as also coal-burning power plants. Motorized vehicles produce high levels of carbon monoxides (CO), carbon dioxide ( C 0 2 ) hydrocarbons (HC) and nitrogen oxides (NOx).
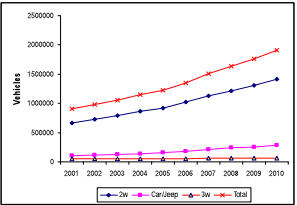
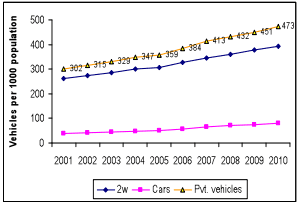
The population of Pune city has increased from 17 lakh to 35 lakh from the year 1991 to 2010 (including newly merged 23 villages). The number of vehicles in the city has also increased proportionately. In comparison to this growth, the road area in the city has not increased in same proportion. The following table shows the increase in number of vehicles in the decade 2001 to 2010.
Figure No. 15-1 : Vehicular growth from 2001 – 2010 and vehicle ownership per 1000 population.(Source : RTO, Pune)
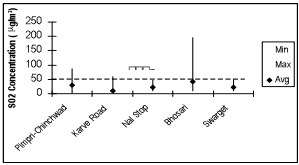
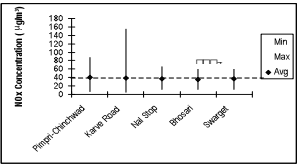
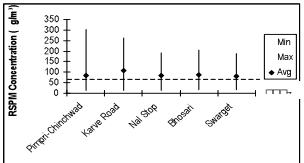
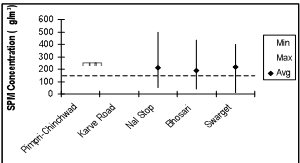
Ambient Air quality in Pune city is measured at areas representing residential, commercial and industrial zones. Out of the four parameters measured, it is observed that the S O 2 and N O 2 levels are within the limits. However the SPM and RSPM levels are on the higher side of the prescribed limits. This is mainly due to the heavy traffic in the city. Harm is caused to human health on account of high concentrations in RSPM levels. Excess level of RSPM is an indicator of degraded air quality.
Figure No. 15-2 : Air pollution levels in terms of SO2,NO2 RSPM and SPM levels in Pune
a) Pune emissions inventory
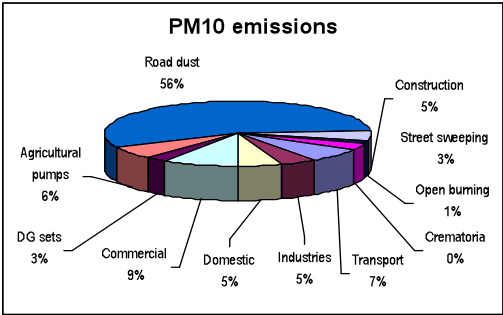
Fig No. 15-3 : Source of Air Pollution
Compilation of data for all the sources of air pollution, which are primarily responsible for air quality changes in a city, is termed as Emissions inventory. An effort was made by NEERI (National Environmental Engineering Research Institute) and AQM (Air Quality Management) and AQM (Air Quality Management) Cell of PMC to understand the dynamics of PM10 emissions from various sources in the city. The overall source- wise contribution of emissions in Pune city by various sources was considered in the study. The above pie chart shows the emission levels.
b) Ozone:
In the month of April, normally, higher concentrations of Ozone levels are observed in the city, whereas lower concentrations are observed in the month of August. It is observed that the ozone levels vary according to the seasons.
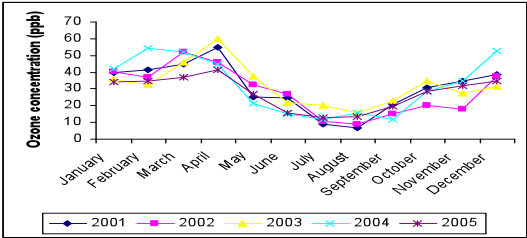
Fig. No. 15-4 : Monthly Ozone level Variation (Source ESR 2010-11 PMC)
15.3.2 Water Quality
Water bodies (ground water and surface water) in close proximity to urban areas are often very important sources of drinking water. The rapid increase in population is resulting in production of more sewage and consequently an increase in the pollution levels of rivers.
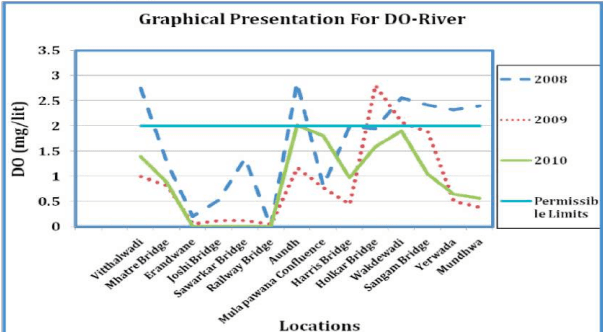
Figure No. 15-5 : Dissolved Oxygen (DO) in Mula and Mutha River.
Important physicochemical parameters such as pH, Electrical conductivity, Temperature, Total Dissolved Solids (TDS), Total Suspended Solids (TSS), Total Hardness (TH), Chemical Oxygen Demand (COD),
Biochemical Oxygen Demand (BOD), Dissolved Oxygen (DO), Alkalinity, Chlorides (Cl), Sulphates ( S 0 4 2 ) and Phosphates ( P O 4 2 ) are monitored with a view to understand the pollution loads as well as to assess the drifts of these loads in the surface water bodies. Out of the above parameters, BOD, COD and DO are the main indicators of pollution levels in water bodies.
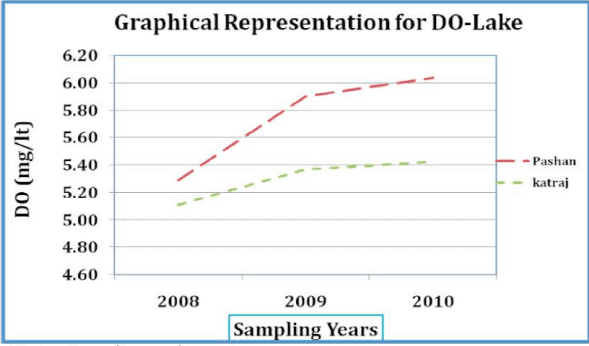
Figure No. 15-6 : Dissolved Oxygen (DO) in Lakes
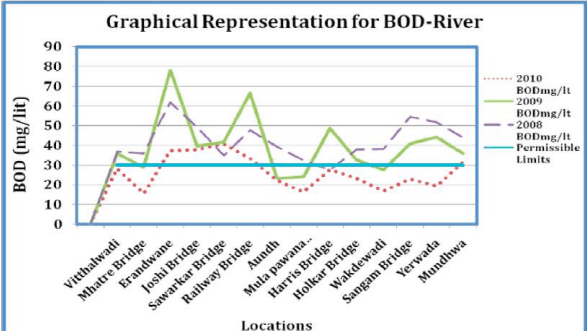
Figure No. 15-7 : BOD levels in Mula Mutha River
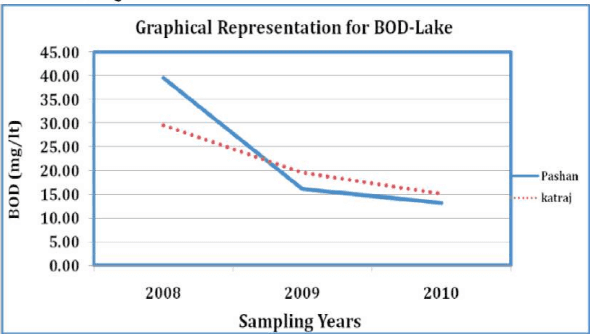
Figure No. 15-8: Biochemical Oxygen Demand (BOD) in Lakes
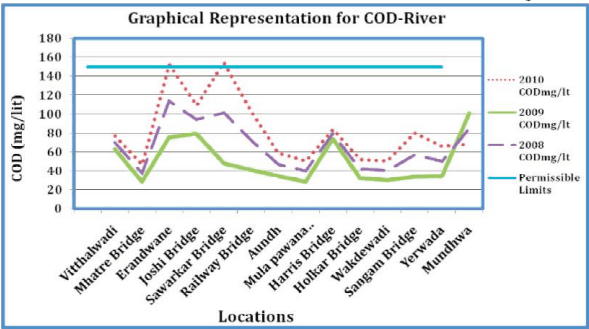
Figure No.15-9: COD levels in Mula Mutha River:
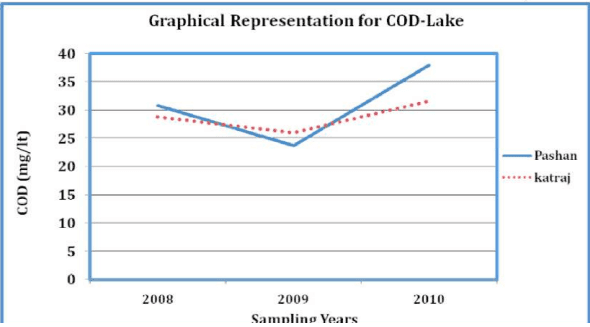
Figure No.15-10 : COD levels in Lakes
15.3.3 Noise Quality
Noise levels in the city are monitored at certain locations in the Residential, Commercial and Sensitive Zones. The average noise level in the city is more than the limits prescribed by Pollution Control Boards.
Vehicular traffic is the main source of noise in the city. The following table shows the trend of noise pollution in 2008, 2009, and 2010.
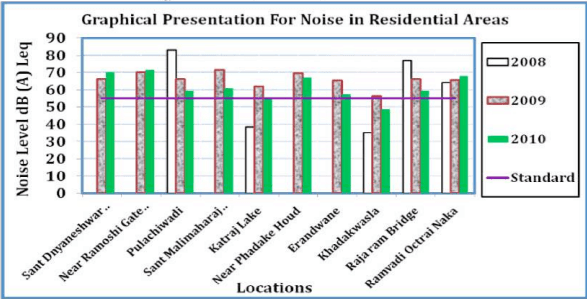
Figure No. 15-11 : Noise in residential areas
(Source: ESR 2010-11 PMC)
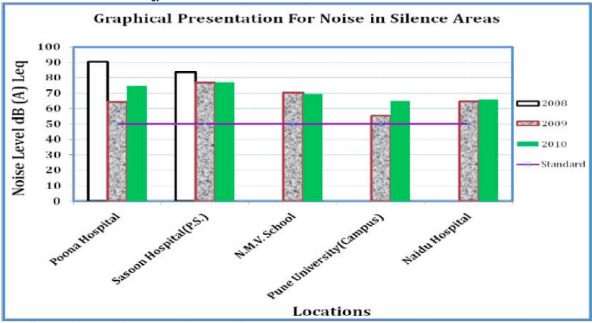
Figure No.15-12 : Noise level in silence areas
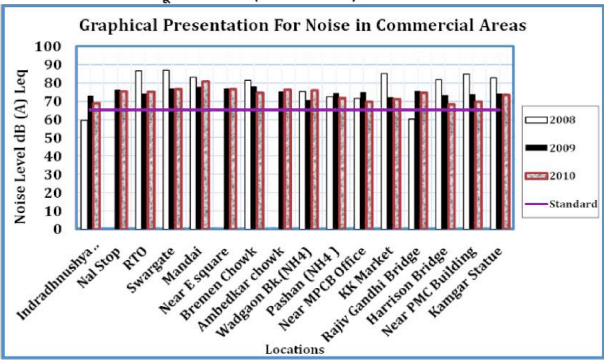
Figure No.15-13 : Noise level in commercial areas
CHAPTER NO. 16
Strategic Environmental Assessment