Report for Preparation of Development Plan of Old City Limit CONTENTS IN REPORT
Chapter
Contents
Page No.
1
History of Pune City
1-5
1.1 Location and setting of Pune
1.2 Temporal Evolution of Pune City
1.3 Territorial expansion of PMC limits
1.4 Population growth of Pune
2
Climatology
6-9
2.1 Geographical conditions
2.2 Climate
2.3 Wind
3
City in its Regional settings
10-17
3.1 Introduction
3.2 Division of Pune region
3.3 Co-ordinated approach of regional plan
3.4 Major problems in PMR as mentioned in Regional Plan
3.5 Major proposals and recommendations(PMR)
3.6 Recommendations in Regional Plan
3.7 Major road and development programmes in Pune
3.8 Overall impact of regional plan proposals on Pune City
3.9 Pune Metropolitan Regional Development Authority
4
Earlier planning efforts in Pune City
18-87
4.1 Initial planning efforts
4.2 Statutory Development Plans
4.3 Development of plan of 1987 and its
4.4 Planning unit of 1987 plan
4.5 Legal framework
4.6 Public amenities provided in 1966 DP& retained in 1987 DP
4.7 Deletion of reservations from sanctioned Development Plan of 1987
Report for Preparation of Development Plan of Old City Limit CONTENTS IN REPORT
Chapter
Contents
Page No.
4.8
Details of implementation of revised Development Plan
4.9
Hurdles in implementation of Development Plans
4.10
Concept of TDR and accommodation reservation
4.11
Draft Development Plan for newly merged villages
5
Introduction to revision of 1987 Development Plan (2nd revision)
88-90
5.1
Planning area
5.2
Declaration of intention
5.3
Preparation of existing land use
5.4
Appointment of town planning officer
6
Base Map
91
6.1
Introduction
6.2
Base map
7
Existing Land Use
92-103
7.1
Introduction
7.2
Base map for ELU.
7.3
Colour code of land use
7.4
Scenario as regards existing land Use of 1987 DP
7.5
Proposed land use of 1987 DP
7.6
Character of existing land uses in city
8
Demographic Projections
104-133
8.1
Introduction
8.2
Methods of population projection
8.3
Population projections for Pune 2027
8.4
Territorial expansion in PMC limit
8.5
Growth rate
8.6
Migration
8.7
Projected age and sex distribution for 2027
8.8
Population density
8.9
Occupation structure in Pune City
Report for Preparation of Development Plan of Old City Limit CONTENTS IN REPORT
Chapter
Contents
Page No.
9
Socio-economic study
134-141
9.1 Introduction
9.2 Population size
9.3 Economic profile of Pune City
9.4 Standard of living of population of Pune City
9.5 Economic and employment profile
10
Housing study
142-161
10.1 Introduction
10.2 Housing survey in old limit of Pune
10.3 Housing types in Pune
10.4 Housing demand in Pune City
10.5 Land requirement for projected housing
10.6 Recommendations for housing
11
Social Amenities and Utility services
162-189
11.1 Introduction
11.2 Planning for sectors
11.3 Amenities
11.4 Educational facilities
11.5 Health facilities
11.6 Recreational facilities
11.7 Commercial zone
11.8 Fire brigade stations
11.9 Civic & cultural centers
11.10 Public & semi public use
11.11 Other facilities
11.12 Utility services
12
Heritage and Tourism
190-194
12.1 Existing situation
12.2 Projects supporting economic development, culture, heritage and city beautification
12.3 Heritage walk
Report for Preparation of Development Plan of Old City Limit CONTENTS IN REPORT
Cha
pter Contents
Page No.
12.4 Tourism in Pune City
13
Traffic and Transportation studies 13.1 Introduction 13.2 National urban transport policy framework 13.3 Present scenario in city 13.4 Challenges and opportunities in Pune urban 13.5 tBrarinesfporervtiew of earlier traffic and transportation studies 13.6 Study area for traffic studies
195-227
14
Traffic and Transportation Proposals 14.1 Sustainable transportation goals 14.2 Common sustainable transport objectives included 14.3 Studies for traffic and transportation 14.4 Urban transport components in planning 14.5 Achievement as per NUTP in traffic planning
228-265
15
Environmental Planning 15.1 Scope in Development Plan 15.2 Natural features in city 15.3 Environmental quality
277-289
16
Strategic Environmental Assessment as a tool in Land use planning 16.1 Background of strategic environmental assessment 16.2 Strategic Environmental Assessment 16.3 SEA in developing countries 16.4 SEA challenges 16.5 Environmental impact assessment in India 16.6 SEA for sustainable city planning for Pune
290-308
Report for Preparation of Development Plan of Old City Limit CONTENTS IN REPORT
Chapter
Contents
Page No.
17
Approach Paper
309-326
17.1 Preparation of Development Plan of old limit of Pune City
17.2 Plans to be prepared
17.3 Surveys and studies undertaken during preparation of Development Plan
17.4 Evaluation of sanctioned Development Plan (1987)
17.5 Projection of demographic characteristics
17.6 Sub-division of planning area
17.7 Planning norms
17.8 Self-reliant plan
17.9 Alternative approaches for traffic and
17.10 General nature of proposals to be included in the
17.11 Public participation in preparation of revised development plan
18
Structural Plan
327-328
19
Broad Policies of the Development Plan
329-337
19.1 Education
19.2 Health
19.3 Transport
19.4 Social Aspect
19.5 Housing
19.6 Redevelopment of congested area.
19.7 Densification along Metro influence zone
19.8 Premium FSI
19.9 Environmental Aspect
19.10 Recreational
19.11 Heritage
20
Proposed Land Use
338-349
20.1 Introduction
20.2 Major goals for proposed land use
Report for Preparation of Development Plan of Old City Limit CONTENTS IN REPORT
Chapter
Contents
Page No.
20.3
Proposed land use in future pune 2027
21
Implementation, Costing and Phasing of Development Plan
357-378
21.1
Introduction
21.2
Financial implications and different modes of effective implementation of plan.
21.3
Apportionment of responsibilities
21.4
Monitoring the implementation of the
21.5
Phasing programme
21.6
Financial feasibility analysis of the implementation of the Draft Development Plan.
21.7
Resource Augmentation.
21.8
Financial assistance from the government for small
21.9
Participation of social organizations & individuals
21.10
Recommendations for implementation
21.11
Urban transportation development fund
Report for Preparation of Development Plan of the Old City LIST OF TABLES IN REPORT
Table
Title
Page No.
1.1
Temporal Evolution of Pune city
4
1.2
Territorial Expansion of Limits
4
1.3
Trends of population growth of Pune city
5
3.1
Division of the Pune Region
11
4.1
Town Planning Schemes in Pune city
18
4.2
Sites Reserved and Implemented in 1966 Development Plan
22
4.3
Implementation Of Roads In 1987 DP
23
4.4
Sites reserved and Implemented in 1987 Development Plan
24
4.5
Site from the sanctioned Development Plan of 1966 that were retained in 1987 Development Plan
28
4.6
Implementation of Reservations in Sector I
29
4.7
Implementation of Reservations in Sector II
30
4.8
Implementation of Reservations in Sector III
31
4.9
Implementation of Reservations in Sector IV
33
4.10
Implementation of Reservations in Sector V
34
4.11
Implementation of Reservations in Sector VI
35
4.12
Implementation of Reservations in Sector I-VI
36
7.1
Land use analysis of the ELU of 1987 DP (Base year being 1978-79)
94
7.2
Proposed land use 1987 DP
95
7.3
Existing landuse survey details Sector I
96
7.4
Existing landuse survey details Sector II
97
7.5
Existing landuse survey details Sector III
98
7.6
Existing landuse survey details Sector IV
99
7.7
Existing landuse survey details Sector V
100
7.8
Existing landuse survey details Sector VI
101
7.9
Existing landuse survey details Sector I to VI
102
8.1
Trend of population growth of PMC for the decade from 1991 – 2001
105
8.2
TFR for Pune
106
Report for Preparation of Development Plan of the Old City LIST OF TABLES IN REPORT
Table
Title
Page No.
8.3
Mortality pattern Consideration for Pune city
107
8.4
Migration Projections
108
8.5
Projection of population by Gokhale Institute
109
8.6
Growth rate Alternative I (high)
110
8.7
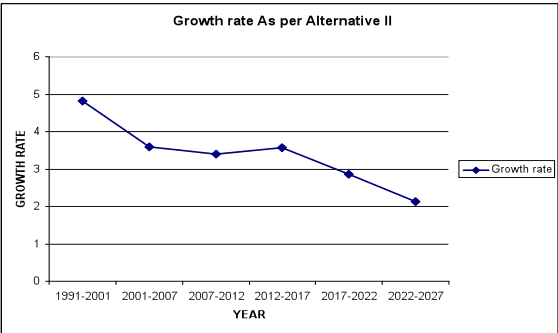
Growth rate Alternative II (realistic)
111
8.8
Age distribution and sex-ratio of projected population for the Old City, 2002-27
112
8.9
Age pattern Alternative I
115
8.10
Age pattern Alternative II
115
8.11
Net in-migration
116
8.12
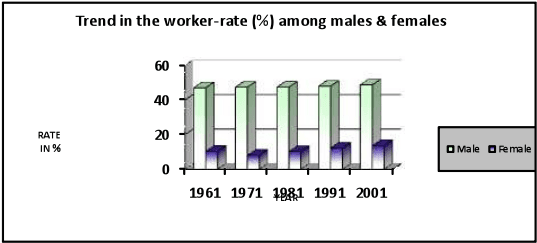
Trend in the worker-rate (%) among males & females
117
8.13
Future trend of labour force
118
8.14
Projection for territorial expansion in PMC limit.
120
8.15
Projected Growth Rate.
121
8.16
Projected Migration.
122
8.17
Projected Age And Sex Distribution
123
8.18
Projected population for sector I
126
8.19
Projected population for sector II
127
8.20
Projected population for sector III
127
8.21
Projected population for sector IV
128
8.22
Projected population for sector V
128
8.23
Projected population for sector VI
129
8.24
Occupation structure in Pune City
130
9.1
Population Growth Of Pune City
136
10.1
Housing Occupancy
143
10.2
Distribution of house
144
10.3
House hold conditions
146
10.4
Household Tenure
146
10.5
Growth of total population and slum population in PMC area
153
Report for Preparation of Development Plan of the Old City LIST OF TABLES IN REPORT
Number of registered vehicles in Pune from 2001 to 2011
199
13.2
Recommended MRT Network
205
13.3
Traffic Speeds (Km/hr.) on Major Roads
205
13.4
Critical Peak Hour Volume and V/C Ratios on Major Roads
206
13.5
Recommendations of CIRT Study
208
13.6
Average Annual Daily Traffic (AADT)Observed at Major Entry Locations of Pune City
211
13.7
Definition, Formulation, Evaluation and Targets for the indices in CMP,2008, Pune
214
13.8
Summary of Comparisions of different types of Transit Systems
215
13.9
PCU Values adopted for the Study
224
13.10
Growth trend in Vehicle Population (in thousands)
225
13.11
Number of Vehicular type in Pune
225
13.12
Modal Share in %
225
13.13
Estimated Mode Share in future in %
226
Report for Preparation of Development Plan of the Old City
LIST OF TABLES IN REPORT
Table
Title
Page No.
13.14
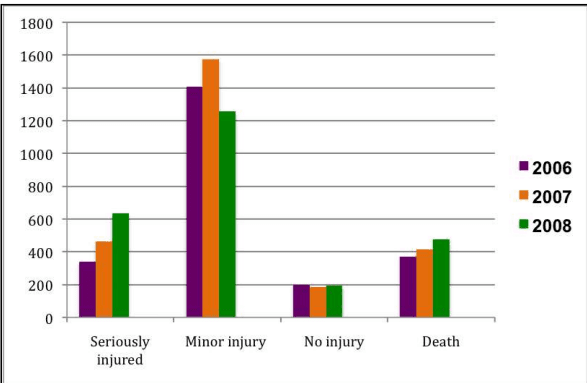
Road accident data
226
14.1
Summary of Sustainable Transportation Goals, Objectives and Performance Indicators
229
14.2
Estimated Travel for Base year and Forecast Years (Daily passenger trips)
233
14.3
Peak Hour Passenger boardings and passenger distance for all modes for horizon year 2021
234
14.4
Peak Hour Passenger boardings and passenger distance for all modes for horizon year 2031
235
14.5
Peak Hour Passenger boardings and passenger distance for different P.T. modes for horizon year 2021
236
14.6
Peak Hour Passenger boardings and passenger distance for different P.T. modes for horizon year 2031
237
14.7
Peak hour Metro Loading for the year 2021
238
14.8
Peak hour Metro Loading for the year 2031
239
14.9
Ridership Estimation on Monorail Corridor
240
14.10
Peak Hour Passenger Boarding and Passenger Distance for BRTS
241
14.11
Routes proposed for BRT
258
14.12
Pilot BRT Project in Pune
264
16.1
Core Areas and Objectives Identified in Scoping Report
299
16.2
Issues/problems/opportunities in Pune (Revised Scoping Report)
301
17.1
Population projection for 2027
318
Report for Preparation of Development Plan of the Old City Limit LIST OF STATEMENTS IN REPORT
Statement
Title
Page No.
4.1
List of Modification as per Section 37/50 of MRTP Act 1966 in Development Plan of 1987
40
4.2
Reservations as per 1987 Development Plan
53
4.3
List of reservations fully developed as per Appendix R-7 w.r.t. Development Plan of 1987
83
4.4
List of reservations partly developed as per Appendix R-7 w.r.t. Development Plan of 1987
85
8.1
Demographic Projection givrn by Revision of Development Plan for old PMC limit
133
11.1
Details of Reservations from 1987 DP in Proposed Land Use
189
14.1
Proposed road widening in proposed Development Plan
266
14.2
Proposed new links in proposed Development Plan
267
14.3
Proposed cycle tracks in proposed Development Plan
268
14.4
Proposed metro alignmens in proposed Development Plan
269
14.5
Proposed flyovers in proposed Development Plan
271
14.6
Proposed foot over bridges/pedestrian bridge in proposed Development Plan
272
14.7
Proposed subways in proposed Development Plan
273
14.8
Proposed railway over bridges( for vehicle) in proposed Development Plan
274
14.9
Proposed BRT routes in proposed Development Plan
275
14.10
Proposed Is-lands in proposed Development Plan
276
20.1
PLU details in terms of zones for sector I
350
20.2
PLU details in terms of zones for sector II
351
20.3
PLU details in terms of zonesfor sector III
352
20.4
PLU details in terms of zonesfor sector IV
353
20.5
PLU details in terms of zones for sector V
354
Report for Preparation of Development Plan of the Old City Limit LIST OF STATEMENTS IN REPORT
Statement
Title
Page No.
20.6
PLU details in terms of zones for sector VI
355
20.7
PLU details in terms of zones for sector I-VI
356
21.1
Financial Feasibility Analysis of Implementation of Development Plan
376
21.2
Phase Wise Costing of Reservation in Proposed Development Plan
377
Report for Preparation of Development Plan of Old City Limit
List of Figures in Report
Figure Title Page No.
1.1 Temporal Evolution Of Pune City 3
2.1 Wind Rose for 8.30 hrs 8
2.2 Wind Rose for 5.30 hrs 9
3.1 Map showing Industrial Development in Pune District 12
3.2 Map showing Mode of Transport in Pune District 15
4.1 Sectors in 1987 Development Plan 25
4.2 Satellite Imagery Of Pune City 26
5.1 Plan showing boundaries of pmc limit 89
7.1 ELU for Pune city 1978 95
7.2 Proposed land use in 1987 DP 96
7.3 Pie diagram for Existing Land Use Sector I 97
7.4 Pie diagram for Existing Land Use Sector II 98
7.5 Pie diagram for Existing Land Use Sector III 99
7.6 Pie diagram for Existing Land Use Sector IV 100
7.7 Pie diagram for Existing Land Use Sector V 101
7.8 Pie diagram for Existing Land Use Sector VI 102
7.9 Pie diagram for Existing Land Use Sector I to VI 103
8.1 Total Fertility rate 106
8.2 Mortality pattern 107
8.3 Projected Migration 109
8.4 Growth rate as per alternative I 110
8.5 Growth rate as per alternative II 111
8.6 Age Ratio year 2002 113
8.7 Age Ratio year 2017 114
8.8 Age-sex ratio year 2027 114
8.9 Age pattern alternative I 115
8.10 Age pattern alternative II 116
8.11 Net-in-migration 117
8.12 Trends in worker-rate 117
8.13 Urbanisation in India 118
Report for Preparation of Development Plan of Old City Limit
List of Figures in Report
Figure Title Page No.
8.14 Projected Population 120
8.15 Trends Of Population Growth 121
8.16 Projected Growth Rate 122
8.17 Inter-State Migration 123
8.18 Migration within State 123
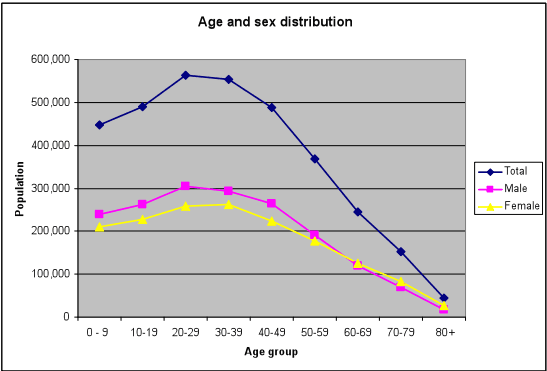
8.19 Age and Sex distribution projection for 2027 124
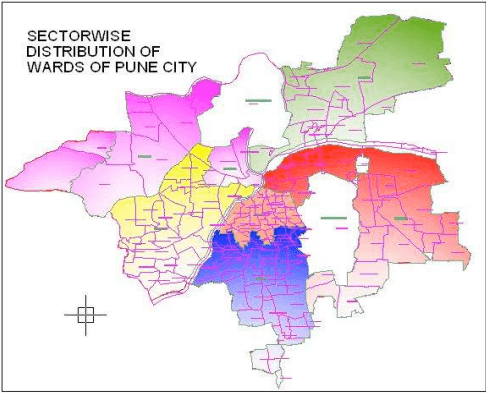
8.20 Sectorwise distribution of wards 125
8.21 Sectorwise projected population 125
8.22 Occupational Structure 130
8.23 Working & Non-working Population 131
9.1 Standard of Living Index 138
10.1 Percentage Distribution Of Occupied Houses 144
10.2 Housing typology 145
10.3 Ward wise distribution by tenancy 145
10.4 Type of Household conditions 146
10.5 Housing Tenure 147
10.6 Housing systems Pune 147
10.7 Land ownership of total 564 slums 154
11.1 No. of Consumers of electricity uses 186
11.2 Percentage of total energy consumption 186
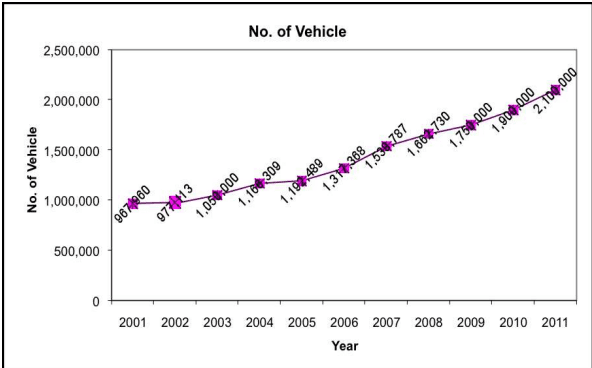
13.1 Vehicles registered in Pune 199
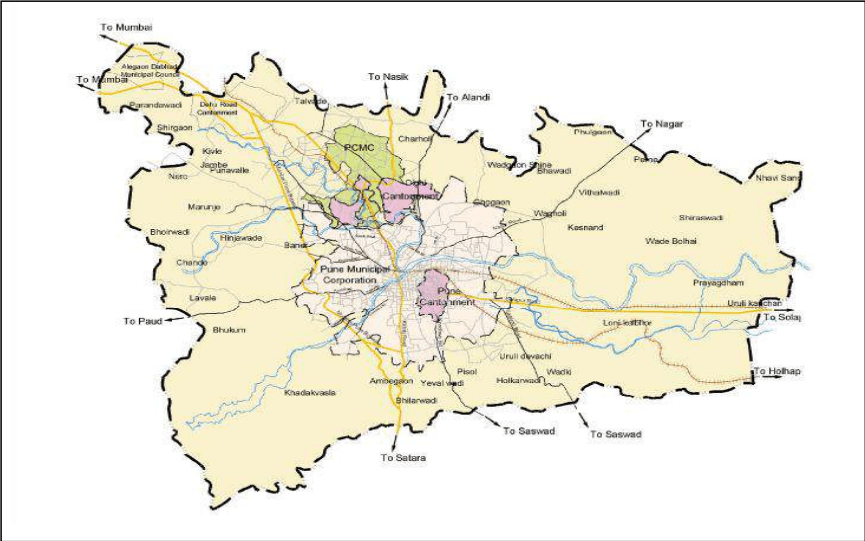
13.2 Study area for traffic studies 219
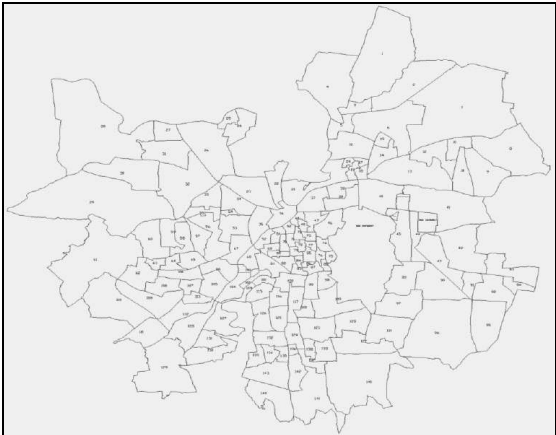
13.3 Zonal Map of PMC Region 220
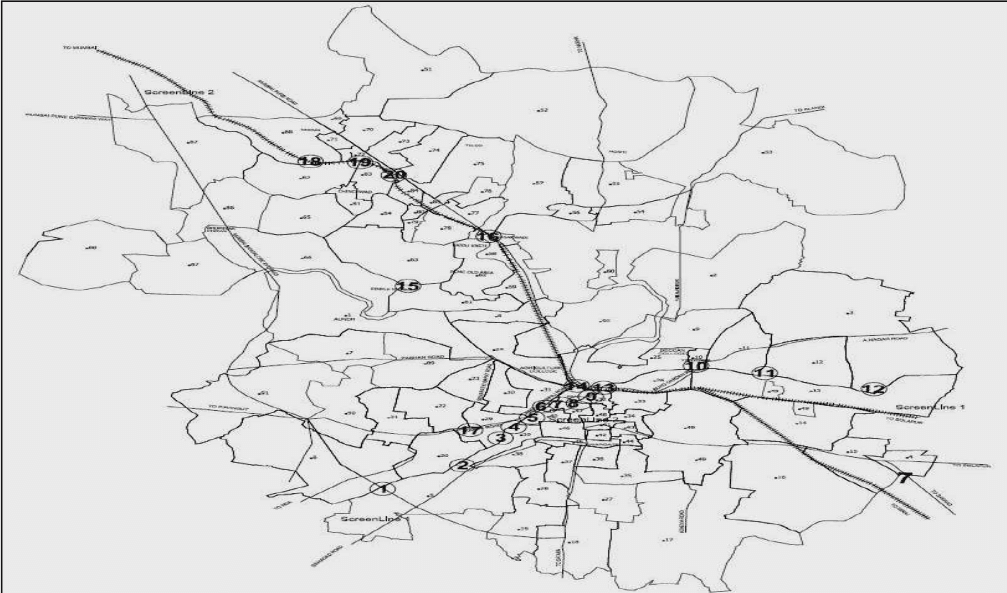
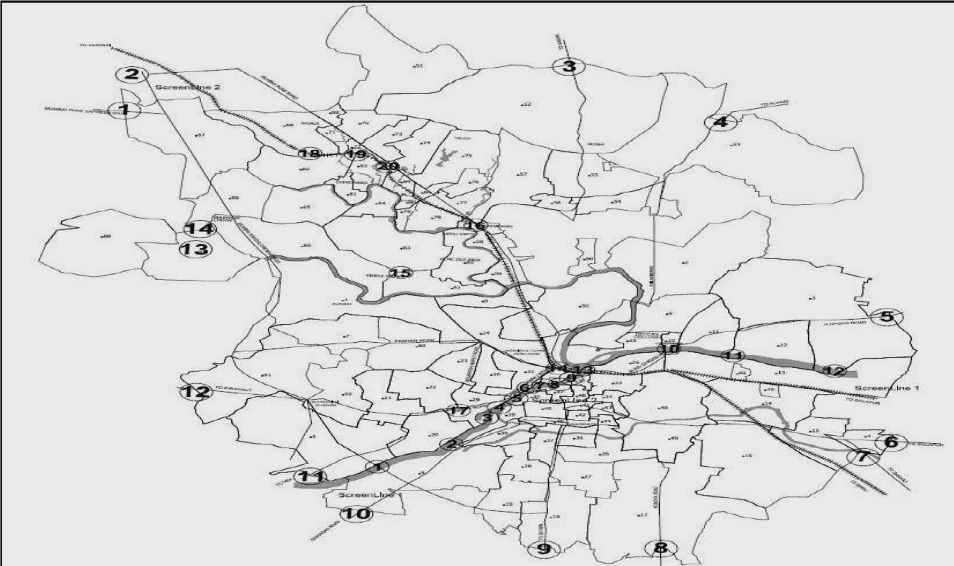
13.4 Locations of Screen Lines in Study Area 222
13.5 Locations of Screen Lines and the External Cordon 223
13.6 Road accident data 227
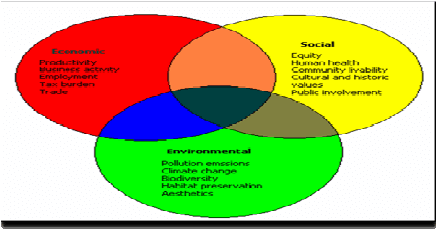
14.1 Sustainable Transportation Goals 228
14.2 3-D View of BRT Corridor 252
15.1 Vehicular growth from 2001 – 2010 and vehicle ownership per 1000 population 283
Report for Preparation of Development Plan of Old City Limit LIST OF FIGURES IN REPORT
Figure
Title
Page No.
15.2
Air pollution levels in terms of SO2, NO2, RSPM 8 SPM levels in Pune
283
15.3
Source of Air Pollution
284
15.4
Monthly Ozone level Variation
285
15.5
Dissolved Oxygen (DO) in MulaMutha River
285
15.6
Dissolved Oxygen (DO) in Lakes
286
15.7
BOD levels in Mula Mutha River
286
15.8
Biochemical Oxygen Demand (BOD) in Lakes
287
15.9
COD levels in Mula Mutha River
287
15.10
COD levels in Lakes
288
15.11
Noise in residential areas
288
15.12
Noise level in silence areas
289
15.13
Noise level in commercial areas
289
20.1
Pie Chart for Proposed Land Use for sector I
350
20.2
Pie Chart for Proposed Land Use for sector II
351
20.3
Pie Chart for Proposed Land Use for sector III
352
20.4
Pie Chart for Proposed Land Use for sector IV
354
20.5
Pie Chart for Proposed Land Use for sector V
355
20.6
Pie Chart for Proposed Land Use for sector VI
356
20.7
Pie Chart for Proposed Land Use for sector I-VI
357
Report for Preparation of Development Plan of Old City Limit LIST OF ANNEXURES IN REPORT
Annexure
Title
A
General Body Resolution No.512 dated 23.02.2007
B
Format for data collection for ElU survey and colour code
C
Typical Cross Section for 60 m wide road
D
Users permissible in designated sites
E
Planning Standards adopted in revised development plan
Report for Preparation of Development Plan of Old City ABBREVIATIONS
Abbreviati
o Description
n
AADT
Average Annual Daily Traffic
AQM
Air Quality Management
ASRI
Automotive Research Association of India
BOD
Bio-Chemical Oxygen Demand
BOT
Build Operate and Transfer
BPMC
Bombay Provincial Municipal Corporation
BRTS
Bus Rapid Transit System
BSUP
Basic services for the urban poor
BT
Bio-Technology
CDP
City Development Plan
CIRT
Central Institute of Road Transport Bhosari
CMP
Comprehensive Mobility Plan
CMP
Comprehensive Mobility Plan
COD
Chemical Oxygen Demand
COEP
College of Engineering, Pune
CPCB
Central Pollution Control Board
CWTP
Cantonment Water Treatment Plant
DCR
Development Control Rules
DDP
Draft Development Plan
DGPS
Differential Global Positioning System
DO
Dissolved Oxygen
DP
Development Plan
DPDC
District Planning Development Committee
DPR
Detailed Project Report
EIA
Environmental Impact Assessment
ELU
Existing Land Use
ESR
Environmental Status Report
EWS
Economically Weaker Section
FSI
Floor- Space Index
GHG
Green House Gas emissions
Report for Preparation of Development Plan of Old City ABBREVIATIONS
Abbreviation
Description
GIPE
Gokhale Institute of Politics and Economics, Pune
GIS
Geographic Information System
GR
Government Resolutions
GSR
Global Software Resources
HCMTR
High Capacity Mass Transportation Route
HCMTS
High Capacity Mass Transit System
HH
Houseless Households
HIG
High Income Group
HPSV
High Pressure Sodium Vapour
IHSDP
Integrated Housing and Slum Development Program
ILFS
Infrastructure Leasing & Finacial Structure
IPT
Intermediate Public Transport
IRC
Indian Road Congress
IT
Information Technology
JNNURM
Jawaharlal Nehru National Urban Renewable Mission
KDMC
Kalyan Dombivili Municipal Corporation
KINSS
Karve Institute of Social Service
LIG
Low Income Group
LRTS
Light Rail Transit System
MASHAL
Maharashtra Social Housing and Action League
MEDA
Maharashtra Energy Development Agency
MIDC
Maharashtra Industrial Development Corporation
MIG
Middle Income Group
MOEF
Ministry of Environment and Forests
MRTS
Mass Rapid Transit System
MSEB
Maharashtra State Electricity Board
MSEDCL
Maharashtra State Electricity Distribution Corporation
MSRDC
Maharashtra State Road Development Corporation
MSTDC
Maharashtra State Transport Development Corporation
MSWM
Municipal Solid Waste Management
Report for Preparation of Development Plan of Old City ABBREVIATIONS
Abbreviatio
Description
n
NBC
National Building Code
NEERI
National Environmental Engineering Research Institute
NGO
Non Government Orgnisation
NIBM
National Institute of Bank Management
NIC
National Informatics Centre
NMT
Non Motorised Transport
NRW
Non Revenue Water
NTDA
New Town Development Authority
NUTP
National Urban Transport Policy
PCMC
Pimpri - Chinchwad Municipal Corporation
PCMT
Pimpri-Chinchwad Municipal Transport
PCNTDA
Pimpri Chinchwad New Town Development Authority
PLU
Proposed Land Use
PMC
Pune Municipal Corporation
PMPML
Pune Mahanagarpalika Parivahan Mandal Limited
PMR
Pune Metropolitan Region
PMRDA
Pune Metropolitan Regional Development Authority
PMT
Pune Municipal Transport
POA
Plan of Action
PPP
Public private participation
RAY
Rajiv Awas Yojana
RITES
Rail India Technical and Engineering Services
ROB
Railway Over Bridge
RP
Regional Plan
RRZ
River Regulatory Zone
SCADA
Supervisory Control and Data Acquisition
SLI
Standard of Living Index
SRA
Slum Rehabilitation Authority
SEA
Strategic Environmental Assessment
SRS
Sample Registration System
Report for Preparation of Development Plan of Old City ABBREVIATIONS
Abbreviatio
Description
n
STP
Sewage Treatment Plant
T & T
Traffic & Transportation
TAZ
Traffic Analysis Zones
TDR
Transferable Development Rights
TDS
Total Dissolved Solids
TFR
Total Fertility Rate
TPS
Town Planning Scheme
TSS
Total Suspended Solids
TH
Total Hardness
UDPFI
Urban Development Plan Formulation and Implementations
UNO
United Nation's Orgnisation
UTM
Universal Transverse Mercator
WGS
World Geodetic Survey 1984
WSA
Wilber Smith's Associate
WTP
Water Treatment Plant
PHADB
Pune Housing and Area Development Board
HDH
Housing the Dis-housed
MTDC
Maharashtra Tourism Development Corporation
Report for Preparation of Development Plan of Old City Limit
ACTS
Act
Description
MRTP
Maharashtra Regional & Town Planning Act'1966
BTP
Bombay Town Planning Act'1954
BPMC
Bombay Provisional Municipal Corporation Act'1949
MHADA
Maharashtra Housing & Area Development Act'1976
CRRI
Central Road Research Institute
Report for Preparation of Development Plan of Old City Limit
UNITS
Units
Description
Ha
Hectare
sq.km
Square Kilometer
MLD
Million Liters per Day
TMC
Thousand Million Cubic Feet
MT/Day
Metric Tone per Day
TPD
Tones per Day
MW
Mega Watt
MWH/Year
Mega Watt hour per year
MGD
Million Gallons per Day
G/C/D
Gallon per Capita per Day
Chapter NO. 1
History of Pune City
1.1Location and Setting of Pune
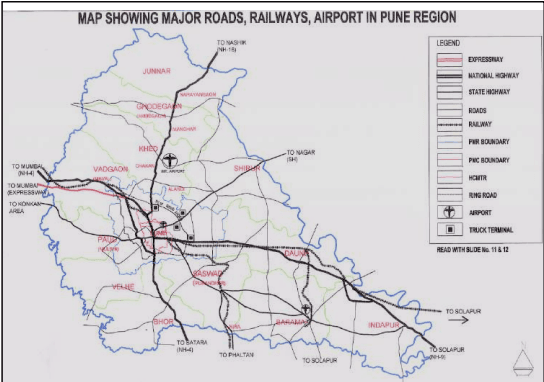
The city of Pune lies in the eastern belt of Maharashtra State on the South East of Mumbai at a distance of 178 kms and at a height of 1840 feet (560 meters) above mean sea level. It is located between 17 Degrees 50 Minutes N and 19 Degrees 24 Minutes N latitudes and 73 Degrees 19 Minutes E and 75 Degrees 10 Minutes E longitudes. Several National and State Highways pass through the city. Prominent among them are Mumbai-Banglore National highway No. 4, National highway no. 16 Pune-Nashik, State highway Pune- Ahmednagar, Pune–Solapur-Hyderabad National Highway, etc Central Railway has a connection from Mumbai-Pune double line broad gauze, while, it further goes to Solapur via Daund. Another, branch of Central Railway goes to Miraj and further to Goa from South Eastern direction via Saswad, Jejuri and Neera station etc.
The city is situated at the confluence of the rivers Mula and Mutha and bounded by Alandi Town on the northern boundary and Katraj Ghat on the southern boundary, which are located about 20 Km and 16 Km respectively from the city. Located at about 30 km from the city on the eastern side, is the village of Urali-Kanchan. The city is blessed to have a number of hills. Prominent among them are Chaturshrungi, Bhamburda Van Vihar, Law College hill, Hanuman hill, Vetal hill, SNDT hill, on the southern side, hill in Wadgaon, Dhayari, Hingane, Parvati, Bibwewadi, Dhankawadi, Katraj and Ram tekadi on the South of Pune-Solapur road.
The Mutha River flows from western side to eastern side towards Daund. Mula River, which is coming from Western side of Pune City, meets the Mutha river near Sangamwadi and then the combined rivers flow towards Solapur side. Width of Mutha River bed is 200 meters (660 feet). From the riverbed of Mutha, highest portion in the Pune City is Kedareshwar hill, which is about 612 meters from the riverbed.
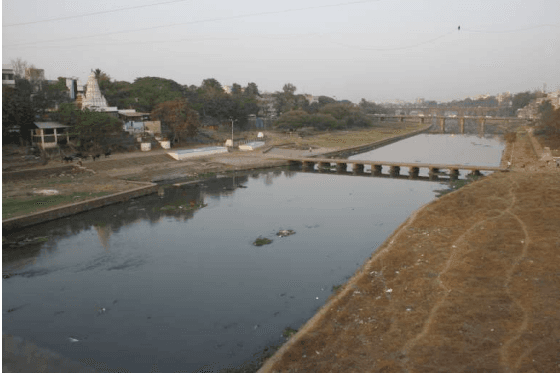
Mutha River – Major Feature Of Pune City
During summer, maximum temperature in the city can go up to 4 4 0 ; while in the winter, temperature can go as low as 5 to 6 0 . Average rainfall is about 62.5 cm. In short, the weather is balanced i.e clear and sub tropical. The Western portion from Mulshi, Maval, Tahsil in Pune District, contains black soil where the main crop is paddy. This is because the rainfall in this area is about 100- 105 cms. At some places, it is black. Generally, all lands to the north, west south and east have generally reddish soil. The city was the jahagiri of Chhatrapati Shri. Shivaji Maharaj till the 1 6 t h century and till that period, the city was growing slowly. The place of residence of Shri. Shivaji Maharaj near Kasba Ganpati temple was known as Lal Mahal. The construction pattern was typical consisting of basements, Ground floor, Upper floor and it was a fortified structure. The city was ruled by the Maratha kingdom from 1600 to 1818 after which, the British rule came in to force. The City further extended beyond Kasba Peth up to the river towards the western side, up to Shankarsheth Road on the Southern side and up to Cantonment on the Eastern side. The City was divided in 16 Pethas which is termed as the core City. Many religious temples, Churches, Mosques were constructed in the City.
The residential development was mostly taking place in the city, with some sporadic commercial development taking place in Budhwar Peth, Ravivar Peth, Bhawani Peth and Nana Peth. The city has transformed from its embryonic form of Kasba peth to a huge city of 244 sq.km, with immense potential to become one of the top cities of India.
1.2Temporal Evolution of Pune City.
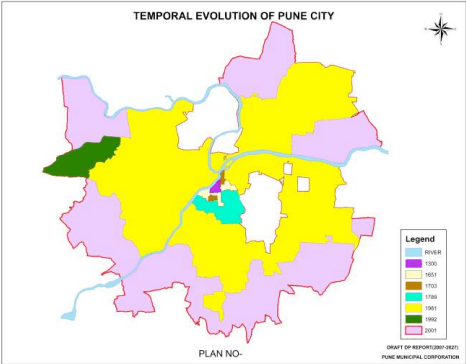
It is very interesting to take a review of the temporal evolution of Pune City. From i t s embryonic form covering a small area around the Kasba Peth, Pune, like all other towns has grown in size by successive annexations of peripheral areas. Following Tables indicates the temporal evolution of Pune City.
Figure No. 1-1 Temporal Evolution Of Pune City
Table No. 1-1 Temporal Evolution Of Pune City
Sr. No.
Year
Growth Of The City
1
1857
South-Shankarsheth road to Ambil nala road North east-right bank of Mutha river East-Welesly road to new Modikhana near Nagzari
2
1889
The area between Shankarsheth road, Satara road and Golibar Maidan
3
1890
Erandwana and Bhamburda villages
4
1931
Parvati gaothan and area till Hingne Khurd
5
1935
Chaturshringi area
6
1958
Inclusion of 18 villages in the Corporation viz. Bopodi, Dhanori(part), Yerawada, Lohgaon(part), Wadgaon Sheri(part), Ghorpadi(part), Mundhwa(part), Hadapsar(part), Hingne(Bk), Dhankawdi, Pashan(part), Aundh, Wanowari, Bhosari, Dapodi, Kalas(part)
7
1975
Exclusion of some part of Bhosari from Corporation limits
8
1981
Inclusion of Sutarwadi in Corporation limits
9
1983
Inclusion of survey no. 79 of Ghorpadi
10
1997
Inclusion of 38 fringe villages and deletion of Dapodi in the Corporation limit
11
2001
Deletion of 15 complete and 5 partial villages from the Corporation
1.3 Territorial Expansion of P.M.C Limits
Table No. 1-2 Territorial Expansion Of Limits
Table No. 1-2 Territorial Expansion Of Limits
Table No. 1-2 Territorial Expansion Of Limits
Year
Area (Sq.Km)
Increase(Sq.Km)
1857
7.74
-
1889
9.86
2.12
1890
18.04
8.18
1931
18.79
0.75
1935
19.05
0.26
1958
138.9
119.85
1975
138.05
-0.85
1981
146.95
8.9
1985
146.11
-0.84
1997
376.89
230.78
2001
243.8
-133.09
1.4 Population Growth of Pune
The following Table shows the growth of the city population from 1911 to 2001
Table No. 1-3 Trend of population Growth of Pune City.
Year
Population
Decadal Growth Rate
1911
1,58,856
-
1921
1,98,543
25 %
1931
1,98,078
-
1941
2,57,554
30 %
1951
4,88,419
90 %
1961
6,06,777
24 %
1971
8,56,105
41 %
1981
12,03,351
41 %
1991
15,67,000
30 %
2001
25,38,000
62%
2011
31,15,454
22.73%
Chapter NO. 2
Climatology
2.1 Geographical Conditions
Pune is located 560 m (1,840 ft) above mean sea level on the western margin of the Deccan plateau. It is situated on the leeward side of the Sahyadri mountain range, which forms a barrier from the Arabian sea. It is a relatively hilly city, with its tallest hill, Vetal Hill, rising to 800 m (2,600 ft) above sea level. Just outside the city, the Sinhagad fort is located at an altitude of 1300m
Central Pune is located at the confluence of the Mula and Mutha rivers. The Pavana and Indrayani rivers, tributaries of the Bhima river, traverse the northwestern outskirts of metropolitan Pune.
3.1Introduction
3.1.1 The first Regional Plan (RP) for Pune Metropolitan Region (1970-91) comprised of area around Pune city, Haveli Tahsil, Part of Mawal, Mulshi and Khed Tahsil (Alandi MC). Pune Metropolitan Region(PMR) mainly comprises of Pune Municipal Corporation, Pimpri Chinchwad Municipal Corporation, Talegaon & Alandi Municipal Council, Pune, Khadki & Dehu Road Cantonments & 129 villages.
3.1.2 The Regional Plan for PMR was published on 4th March, 1970 after following all legal procedures and subsequently sanctioned by the Government in February 1976. This RP was further revised & draft RP for PMR and Pune District was published in 1993 & sanctioned in November 1997, to come into force thereafter. The concept of preparation of District RP is a part of State Policy connected to State Five Year Plan (DPDC).
3.1.3 The Pune District area comprises of 1500 sq. km. accommodating 55.11 Lakh populations (1991). There are two Municipal Corporations – PMC and PCMC, 3 Cantonments – Pune, Kirkee and Dehu Road, 11 Municipal Councils and 1753 villages. As per the population projection stated in R.P Report, more than 50% (51%) population has been accommodated in urban area by 1991. The total population of district for 2011 was estimated to be 94.80 Lakh of which 71.29 Lakh would reside in urban areas, their extentions, proposed new towns, and urban centers. Thus, the percentage of urban population in the region was projected to rise from 51% of 1991 to 75% by 2011.
2.3Winds
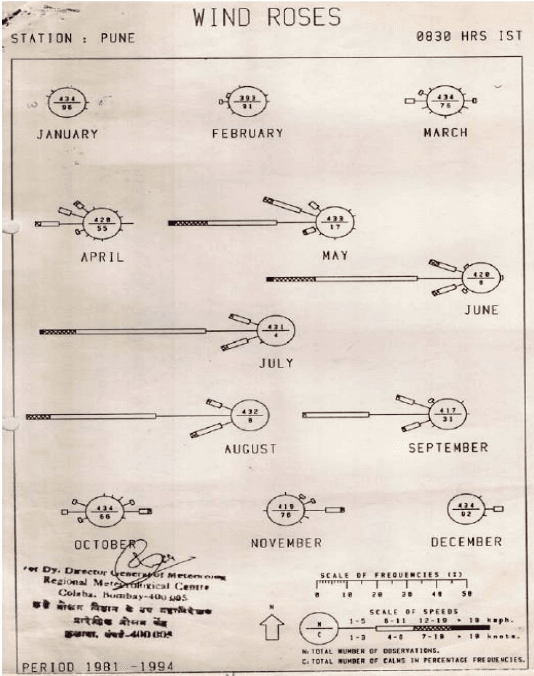
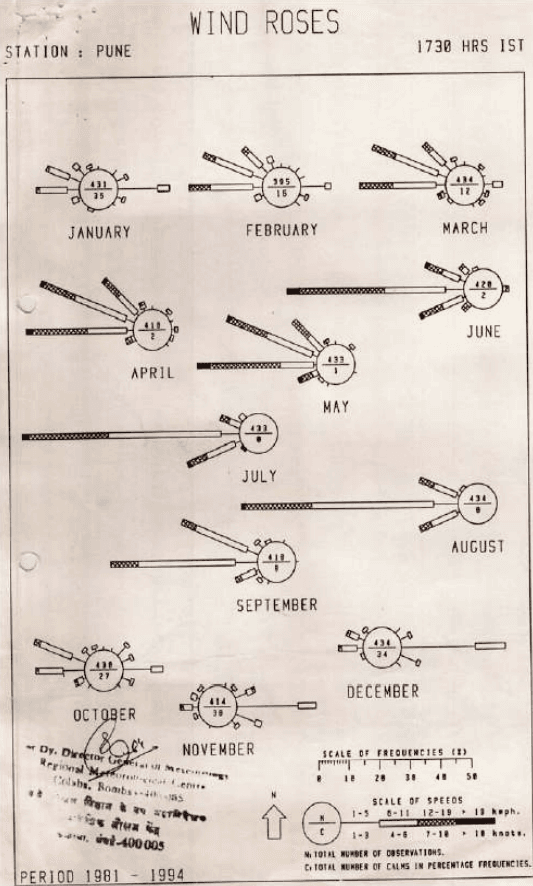
For Pune station, wind rose diagram is available for the period between 1981 to 1994 from the office of Dy. Director-General, Regional Meteorological Department, and Mumbai. The wind rose diagram for 8.30 hrs in the morning and 5.30 hrs in the evening is shown below:
Figure no 2-1:- Wind Rose for 8.30 hrs.
Source: Dy.Director-General, Regional Metrological Department, Pune (2001)
Figure no 2-2. Wind Rose for 5.30 hrs.
Source: Dy.Director-General, Regional Metrological Department, Pune (2001)
CHAPTER NO. 3
Pune City in Its Regional Setting
2.2Climate
Pune experiences three distinct seasons: summer, monsoon and winter. Typical summer months are from March to May, with maximum temperatures ranging from 35 to 3 9 ° C (95 to 102°F). While May is the warmest month in most of the Deccan Plateau, the warmest month in Pune is April. The city often receives locally developed heavy thundershowers with sharp downpours in May. Though the temperatures plunge in this month, the summer heat accompanied by high humidity can be occasionally quite oppressive. Nevertheless, the nights in Pune are significantly cooler compared to those in most other parts of this region owing to the city’s high altitude.
Pune receives moderate rainfall. The city receives an annual rainfall of 625 mm, mainly between June and September as a result of the southwest monsoon. July is the wettest month of the year. Though the rainfall is comparatively lower than that in the adjoining Western ghats, steady spells of heavy rain frequently disrupt normal life in the city. The spells of continuous rainfall may stretch to many days or even a few weeks. Pune has, on record, received rainfall for 29 consecutive days (days when rainfall is greater than 2.5 mm).
However, the weather is very pleasant in the city with temperatures ranging from 20 to 2 8 ° C (68 to 82°F).
Pune experiences winter from November to February. Pleasant windy days, clear skies and cool nights make it the most enjoyable time of the year. The day temperature hovers around 2 9 ° C ( 8 4 ° F ) while the night temperature dips below 1 0 ° C ( 5 0 ° F ) for most of December and January, often dropping to 5 or 6 ° C ( 4 2 ° F ) . On particularly cold days, the wind is extremely chilly due to the dryness in the air. Rainfall is rare in winter.
Temperature records : The highest temperature recorded was 110 °F (43.3° C ) on 30 April 1987 and 7 May 1889. The lowest temperature recorded during 1881-1940 was 3 5 ~ ° F ~ ( 1 . 7 ° C ) on 17 January 1935. More recently, Pune recorded a lowest temperature of 2 . 8 ° C in January 1991.
3.6Recommendations in RP
No more addition to existing Defense land.
Control over development on the road from Chandani chowk to National Defence Academy Gate.
High capacity Mass Transportation Route. (as per 1987 D.P. )
South-Easterly bypass in continuation to Westerly diversion connecting Satara road to Solapur road. –
90 mtrs North Easterly diversion route with railway track. - 90 mtr wide Westerly Expressway from Somatane phata to Shirval. -
Traffic & Transportation proposals made in the earlier studies to be incorporated.
Development control to be exercised as per standardized Development control rules for ‘A’ class municipal councils with suitable modification. – (upto 10 kms from local authourity boundary)
More than 10,000 hectare has been proposed for residential purposes in fringe area in 8 sectors.
Govt. gairan lands are proposed to be utilized for Public-Semi-Public use as far as possible
Out of 51.35 lakhs population in PMR by 2011, population of 21 lakh would be accommodated in Pune city, 12 lakhs in PCMC, 2.65 lakhs in Cantonments, 10.75 lakhs in fringe area and the remaining towns will accommodate the balance population.
3.4Major Problems in PMR AS Mentioned in RP (1976-1991)
Higher population growth.
Short comings in implementation of Pimpri-Chinchwad New Town Development.
Lop sided Industrial growth in PMR – in Western Corridor.
Traffic congestion on city roads, unprecedented growth in two wheeler traffic, parking problems, break down stage of traffic movement.
Water supply.
Housing shortage and increase in slums, unaffordable housing situation.
Artificial scarcity in Housing stock due to operation of Urban land Ceiling Act, 1976.
Unauthorized constructions and non-agricultural use on agriculture zoned lands.
Developments in Grampanchayat area, without regard to building regulations and without obtaining Non-agricultural permission.
3.5 Major Proposals and Recommendations (PMR)
It would be seen from the recommendations regarding the development in PMR that emphasis has been given on controlling the development in the fringe area of PMC & PCMC comprising of 53 villages. Population is likely to be accommodated to the extent of 10.75 lakhs by 2011.
53 villages on the fringe of PMC, PCMC were identified as influence villages having rapid growth. There is a view that these villages should be included in PMC (38), PCMC (15).
Accordingly, the PMC & PCMC limit was extended to include 38 villages in PMC & 15 villages in PCMC on the 11th September, 1997.
3.3Co-ordinated Approach of Regional Plan
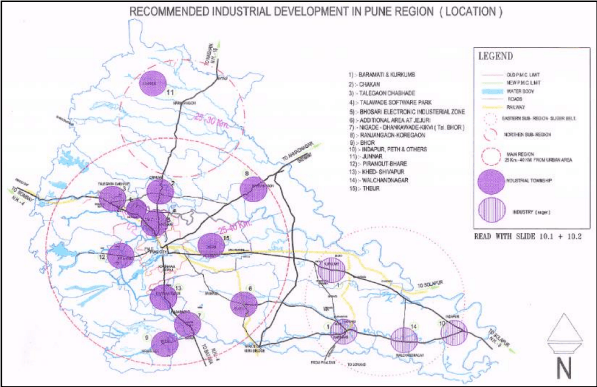
New town to be established at a distance of 80 to 100 kms from Pune – between Baramati and Kurkumbh industrial area with 5 to 7 lakhs population together with peripheral ring towns of 0.50 to 1.50 lakhs each around existing / proposed industrial area at nodal points.
To take care of housing need, residential townships are suggested at 25-30 Km & 50-80 Km distance as ring towns. These towns are named as Inner Residential Ring Towns (25-30 Km away from Pune) for carrying total population of 7.75 lacs & Outer Ring Towns (50 – 80 km away from Pune) for carrying total population of 7.60 lacs.
Regional plan shows industrial & residential zone to satisfy the housing need of the industrial development. The existing development in these areas shows that the Industrial areas are developing but the residential area is not having the same pace of development. The impact is thereby coming on the adjoining urban settlements in respect of Housing & transportation.
Figure No. 3-1 Map showing Industrial Development in Pune District.
3.2Division of Pune Region
The Pune region is mainly divided into following three sub regions as shown in PLAN NO 3-1
Pune Metropolitan Area (PMR)
Western Ghat Area – (Mawal, Mulshi Taluka)
The remaining Eastern & Central part of the region – (Shirur, Daund, Baramati & Indapur sub region
For the sub region no. 1 (PMR), 8 sectors have been formed in the Pune RP from ‘A’ to ‘H’ which have been described below :
3.8Overall Impact of Regional Plan Proposals on Pune City
The generation of jobs & employment of workers has taken place due to industrial growth but no industry which has come up in this area in last decade or so has provided any housing for their workers.
There is a huge influx of Industrial workers in the City which has resulted in bringing pressure on infrastructure of the City.
A proposal of setting of IT Park at Hinjewadi abutting WEH, is a proposal considered by State Govt. of Maharashtra in its priority sector.
The State Govt. of Maharashtra has considered the IT sector as a major foreign exchange generating section which is capable of generating lakhs of jobs. This is a direct impact on the PMC limit and has been considered while drafting proposals for DP.
The major impact would be seen on Housing, T&T and provision of Infra Services and civic amenities.
Sus & Mhalunge villages which lie on either side of express highway are two sensitive villages lying on the fringe of PMC limit & prone to development due to low land values & typical location. Since there is no controlling Authority to keep a watch & permit the development in this area, Gunthewari development may take place & as a result, the impact of this population would directly come on PMC infrastructure. This is an indirect burden on future development.
The Express Highway is the main access to the fringe area. As as result, undeveloped lands are the main target of developers & lot of schemes under section 20 of the ULC Act 1976 have come up in such areas.
Part of areas from the villages which are located outside PMC limit are also growing very fast resulting in an increased pressure on infrastructure of PMC.
Absence of proper road network also may cause traffic hazards in peak hours.
Adequate provisions of Public transport have to be considered right now by undertaking to the quick modification to the sanctioned RP with a view to connect the existing road network in and around these areas.
3.7Major Road and Development Programmes in Pune Region
Completion of Westerly diversion
South-Easterly diversion from Katraj to Loni
90 mtr wide North-Easterly diversion
90 mtr wide Westerly Expressway
Upgrading, strengthening and improvements of the following:-
State Highway road link connecting Ring towns.
State highway link from Pune-Nagar highway connecting Nhavara-Kadgaon, Supa-Sangvi
Jejuri-Morgaon-Baramati road
Saswad- Pisarve – Supa - Undavadi road
Patas- Wasumbhe -MDR 53
MDR 63 – Sarole -Baramati via Nira.
3.7.1 Railways
Quadruplicating of the Railway track from Pune to Lonavala
Strengthening and improvement of services between Pune-Daund.
Improving the services between Pune and Jejuri including introduction of new shuttle services
Conversion of Daund-Baramati narrow gauge railway line to broad gauge
Extension of the Daund - Baramati broad gauge line upto Lonand via Phaltan
3.7.2 Airport
Proposal to set up one International Airport near Khed (to the north of Chakan) is under consideration.
Figure No. 3-2. Map showing Mode of Transport in Pune District.
3.9Pune Metropolitan Regional Development Authority (pmrda)
The Regional Plan of Pune was sanctioned by the State Government in 1997. The recommendation of formation of ‘Pune Metropolitan Regional Development Authority’ for the entire District was made in Appendix ° Y ′ of the report. Section 243(Z)(E) of the Constitution stipulates the formation of such an Authority. As per the 7 4 t h Constitutional amendment which came in to force from 1993, a Metropolitan Planning Committee (MPC) has to be formed for all cities having a population in excess of ten lakhs. This MPC has to prepare a draft Development Plan for the region. Members have been elected on the MPC and a couple of meetings have taken place.
CHAPTER 4
Earlier Planning Efforts in Pune
4.1Initial Planning Efforts :
4.1.1 Town Planning Schemes
Immediately after the introduction of the Bombay Town Planning Act of 1915, the then Poona City Municipality took steps to control the development of the growing town on the west and the north of the City by undertaking a Town Planning Schemes. T.P.S.No.1. Bhamburda, which was finalised in the year 1931. This was followed by three more schemes, viz. Town Planning Scheme No. III of Parvati and Gultekdi, Town Planning Scheme No. II of Somwar-Mangalwar Peth and T.P.S. Sangamwadi which was lately undertaken by P.M.C. Prior to the merger of suburban Municipality in PMC, the then suburban Municipality undertook T.P.S. Pune suburban No.1 which was finalized in 1930. These Schemes included most of the remaining areas on the southern and eastern parts of the City, which were open. In addition to these Town Planning Schemes, subsequently two T.P.S. mainly for industrial development were taken in the eastern part of the city viz. in Hadapsar area.
The area of the city was covered by various TPS the details of which are as below :
Table No. 4-1 Town Planning Schemes in Pune City
Sr. No.
Name of T.P. scheme
Area in ha
Date of Implementation
1
TPS no.1(bhamburda)
545.60
16/8/1979
2
TPS suburban no.1
19.20
16/8/1973
3
TPS no.2 Somwar, Mangalwar Peth
20.66
1939
4
TPS Yerawada
162.80
1/6/1983
5
Hadapsar Industrial TPS no.1
11.40
1/6/1977
6
Hadapsar Industrial TPS no.2
146.00
1/7/1978
7
TPS Sangamwadi
452.4
1/6/1975
8
TPS no.3 Parvati
720.00
15/9/1989
The total area covered under all TPS is about 2078 Ha. i.e. 20.78 sq.km.
4.1.2 Other planning schemes undertaken and developed by PMC
4.3The Development of plan of 1987 and its implementation.
Under the provisions of Section 38 of MR and TP Act 1966, at least once in ten years (now it is 20 years) from the date on which a Development Plan has come in to operation, the planning authority can revise the Development Plan. The revision of the Development Plan was due in 1976. Accordingly, the PMC declared its intention to revise the Development Plan on 15-3-1976, as per the section 23 of the MR and TP Act of 1966. After following all the procedures of the MR and TP Act of 1966, the proposed draft revised DP was submitted to the State Government as per section 30, in 1982. The State Government, after scrutinizing the submitted Plan and suggesting various modifications, finally accorded sanction to the first revised Development Plan of Pune, under Government Notification, Urban Development Department No. TPS 1884/1377/Cr-220/84/(iii) UD-7 dated 5-1-1987.
4.2Statutory Development Plans
Before 1954, there was no statutory Plan for Pune City. The local authorities were permitted to undertake the improvement of certain areas in their jurisdiction, by preparing Town Planning Schemes, under the provisions of the Bombay Town Planning Act of 1915.
4.2.1 Master Plan 1952 for the City
The Pune Municipal Corporation was established on 15-2-1950. The work of preparation of Master Plan was taken up in hand immediately after the establishment of the Corporation. A Draft Master Plan of Greater Poona was first prepared by the Corporation in the year 1952 and this draft master plan was then duly published for information of the public and for eliciting opinions and suggestions thereon. After considering all the relevant suggestions, the Corporation finally by Resolution number 76, dated 27-4-1955, approved this Draft Master Plan with certain modifications. The area covered under this Plan was consisting of 20 wards, having an area of 26,545.44 acres (107.43 square kilometer) and a population of 4,85,485. This master plan is shown in PLAN NO. 4-1.
4.2.2 The Development Plan of 1966.
Although a Master Plan for the Poona City had already been prepared in 1952, the State Government desired under their letter No. TPC/1257/36339- M dated 23-9-1957 that a Development Plan for Poona should be prepared afresh in accordance with the Bombay Town Planning Act, 1954. As per the instructions issued by the Government in this behalf, the PMC declared its intention to prepare a Development Plan for the entire area under it’s jurisdiction under the Corporation Resolution No. 312 dated 20-11-1958. The work of preparing the Plan was then taken up. In its main outlines; this Development Plan was based on the Master Plan that was already prepared in 1952, with some changes. The work of preparing this Development Plan was completed in 1964 and it was sanctioned with many amendments by the Government, Urban Development and Public Health Department Notification
No. TPS-1365-14, dated 7-7-1966 to come in to force from 15-8-1966. The plan of 1966 DP is shown in PLAN NO. 4-2. The Maharashtra Regional and Town Planning Act, 1966 replaced the 1954 Act and as provided under the provisions, the Development Plan sanctioned under the earlier Act continued as the one sanctioned under the new Act.
4.2.2.1 Evaluation of Development Plan of 1966
4.4Planning unit of 1987 plan
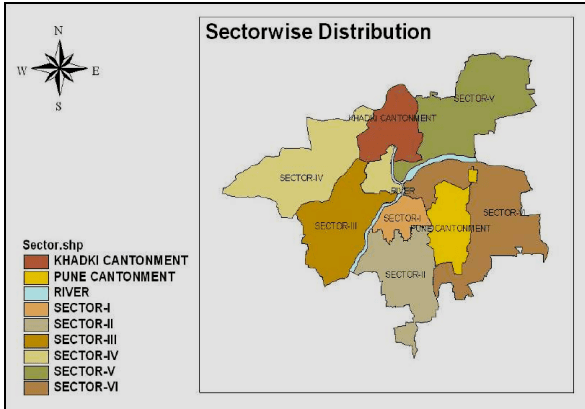
The area under the jurisdiction of Pune Municipal Corporation was about 146 sq.km, which included the area of 4.96 sq.km. of the congested parts of the city. The entire area within the municipal limits was considered under six sectors.
Figure No. 4.1 Sectors in 1987 Development Plan.
Sector I Congested area (Core city)
Sector II Southern suburbs, which includes Parvati, Dhankawadi, Katraj, Munjeri,etc
Sector III Southwestern suburbs, which includes Erandawane, Kothrud, Hingne Budruk, Bhamburda, etc
SectorIV Northwestern suburbs, which includes Shivajinagar, Sangamwadi, Aundh, Pashan, Bopodi etc
Sector V Northeastern suburbs, which includes Lohgaon, Yerawada, Wadgaon Sheri, Kalas, Dhanori, etc
Sector VI Eastern suburbs, which includes Hadapsar, Ghorpadi, Mundhwa, Wanawadi, Kondhava, etc.
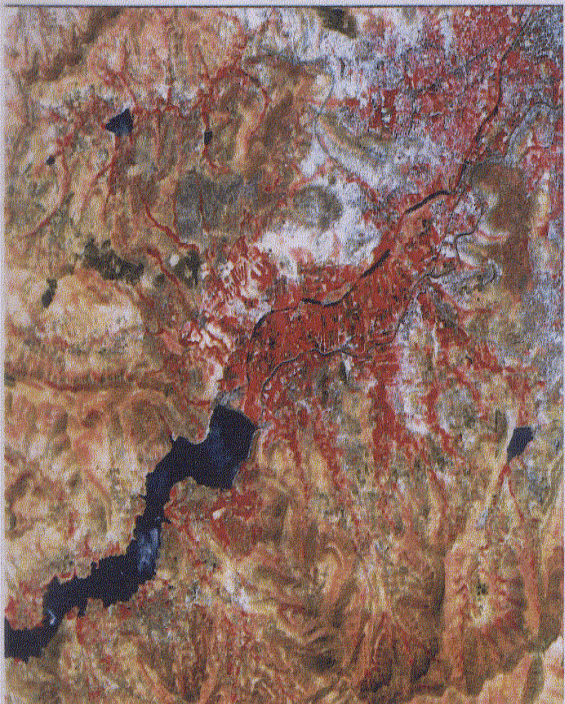
Figure No. 4-3 Satellite Imagery Of Pune City
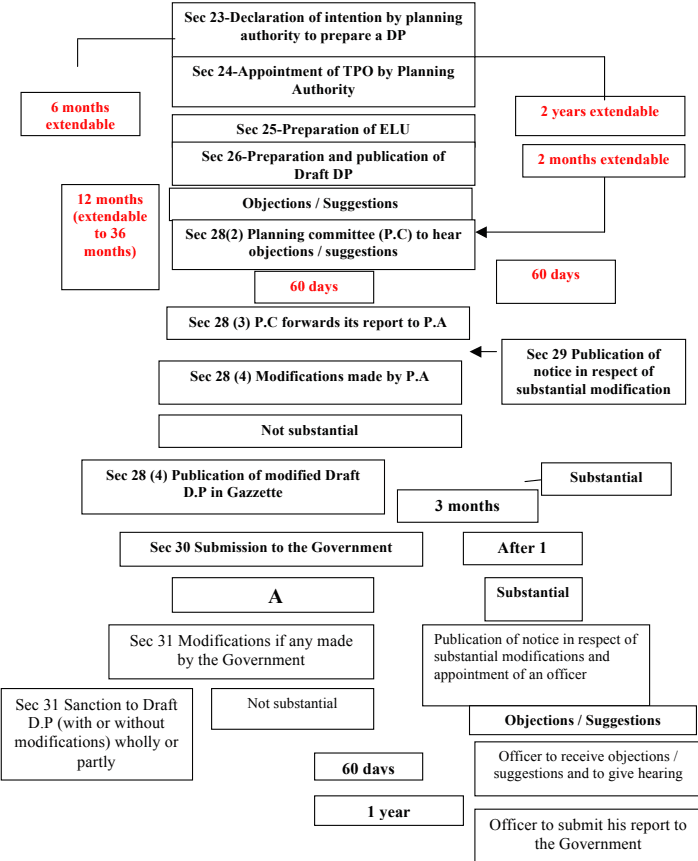
4.5 Legal Framework
Legal framework of preparation of development plan and the procedure is as defined abelow.
4.6Public amenities provided in 1966 DP and retained in 1987 DP (first revision)
The total no. of Reservations that were earmarked in the Development Plan of 1987 were 526. The following table gives details regarding the Reservations from the sanctioned Development Plan of 1966, which were retained in the 1987 Plan.
Table No. 4-5 Sites from the sanctioned development plan of 1966 that were retained in the 1987 plan):
Sector
No. of Sites originally earmarked in the 1966 D.P
No. of Sites retained in the 1966 D.P after deletions
No. of Reservations retained in 1987 D.P (for same purpose)
No. of Reservations retained in 1987 D.P (with changed purpose)
Total
I
114
106
94
7
101
II
110
99
54
38
92
III
87
75
46
20
66
IV
30
29
17
7
24
V
36
30
25
4
29
VI
82
74
42
29
71
Total
459
413
278
105
383
4.7Deletion of reservations from the sanctioned development plan of 1987.
It was expected that the PMC should develop all the sites that were earmarked in the sanctioned Development Plan of 1987. Making Budgetary provisions for acquiring these sites, developing these sites and in turn implementing the proposals of Development Plan was the duty of the PMC. Since 1987, there were 29 deletions made in the Reservations from time to time from the revised DP . The details of these deletions are as given in STATEMENT NO-4-1. In addition to the 1987 comprehensive planning was prepared in 1992 for Pashan Sutarwadi area for an area of about 813.36 ha. Also the some parts of agricultural land was converted into residential in 2000. All the reservations are considered in this reservation of Development Plan.
4.9Hurdles in implementation of development plans:
It is clear that both the Development Plans, i.e. 1966 and 1987 have to a large extent remained as paper plans only, with the extent of implementation of both the plans being extremely pathetic. The various reasons attributed to the non-implementation of Development Plans in general and those of Pune in particular, are as under.
The Development Plan of a city or a town attempts to evolve scientific and rational policies to meet the functional needs of the city and aspirations of
its citizens in a perspective of 20-25 years. Such methodology followed in plan preparation has not been found very effective. The basic criticism of such methodology is that it neither matches the pace of urban growth nor does it cope with the changing development needs of the society. The gap between the plan targets and the actual development has thus got widened. Although Master Plans are generally prepared for the planning areas identified under the respective Acts, they mainly confine to the precincts of city limits and seldom take in to consideration the developments taking place on the urban fringes and adjoining peripheral areas due to statutory requirements. In other words, more often there would be a mis-match between the development proposals embodied in the Master Plan and the actual development taking place on the edges of the urban areas termed as peri- urban areas, thereby defeating the very purpose of the Master Plan.
The Master Plans are supposed to take note of the regional and national goals of development but in the absence of well conceived urban development policies at national and state level, these are not reflected in the Master Plan of an individual town / city.
4.10Concept of TDR and accommodation reservation:
The Development Plan of Pune City was sanctioned on 5/1/1987.There were about 500 sites admeasuring about 600 Ha in area reserved for various public purposes in the Development Plan. These reservations are shown against a number of public utilities and are estimated to cost more than Rs 1500 Crores at the prevailing market rates. In view of the limited financial resources available with the utilities and consequently the paucity of funds for such huge compensation, the state government vide their order-dated 5/6/1997, have introduced a concept of Transferable Development Rights (T.D.R) for the city of Pune. T.D.R is a recent innovative land assembly technique introduced by the Government of Maharashtra for cities having a population of 2 lakhs and above, wherein participation of the land owners is sought for the purpose of implementation of the planning proposal.
With this concept, if land owner hands over the possession of the reserved land to the Pune Municipal Corporation, free of cost and without any encumbrance, a ‘Development Rights Certificate’ will be granted to him, to
entitle him to construct a built up area equivalent to the permissible FSI of the land handed over by him on one or more plots in the zones specified. The PMC has a mandate to regulate the activities pertaining to T.D.R.
There are certain types of reservations that can be developed by the principle of Accommodation Reservation. It allows the land owners to develop the sites reserved for an amenity in the Development Plan using ful permissible F.S.I on the plot, subject to agreeing to entrust and hand over the built up area of such amenity to the local authority free of all encumbrances and accept the full F.S.I as compensation in lieu thereof. The area utilised for the amenity shall not form part of the F.S.I calculations. The reservations that are commonly developed under this principle are Parking, Shopping Centre, C2, Dispensaries, etc. In view of the fact that the Corporation saves both the cost of acquisition and the cost of development of the sites in case of Accommodation Reservation, This tool have become really popular nowadays and relieves to a large extent, the burden of developing the reservations.
5.1Planning Area
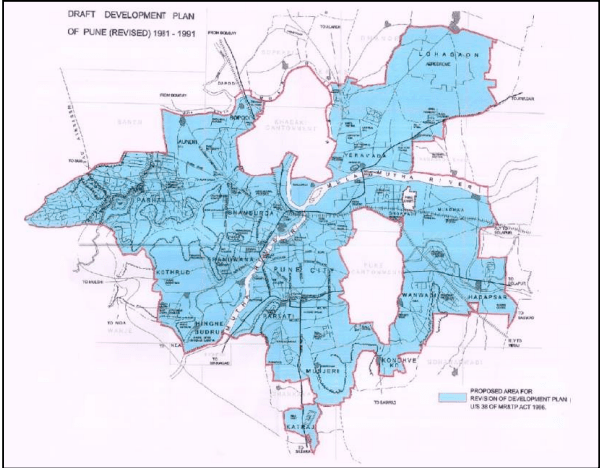
Pune City is the second largest metropolitan city in the State, It is fast changing its character from an educational-administrative centre to an important Industrial City. The area under the old city which is under jurisdiction of the Pune Municipal Corporation is about 146 sq.km. The planning area is the same area as shown in the 1987 Development plan area. The entire area within the municipal limits was considered under six sectors
Sector I Congested area (Core city)
Sector II Southern suburbs, which includes Parvati, Dhankawadi, Katraj, Munjeri etc
88
Sector III Southwestern suburbs, which includes Erandawane, Kothrud, Hingne Budruk, Bhamburda, etc
Sector IV Northwestern suburbs, which includes Shivajinagar, Aundh, Pashan, Bopodi, etc.
Sector V Northeastern suburbs, which includes Lohgaon, Yerawada, Wadgaon Sheri, Kalas, Dhanori, Sangamwadi etc
Sector VI Eastern suburbs, which includes Hadapsar, Ghorpadi, Mundhwa, Wanawadi, Kondhava, etc.
Figure No. 5-1 Map showing boundaries of Draft Development plan of Pune
5.2 Declaration of Intention
Under the provisions of section 38 of MR&TP Act 1966, at least once in twenty years from the date on which a development Plan has come into operation the Planning Authority shall revise the Development Plan.
The Planning Authority has intented to revise the 1987 Development plan as per section 38 of MR&TP Act 1966, vide resolution no 512 dated 1 3 t h Dec 2007.Annexed here by in this report in ANNEXURE A.
5.3Appointment of Town Planning Officer.
Under the provisions of section 24 of MR&TP Act 1966, after the declaration of the intention to revise the development plan, the general body of the Pune Municipal Corporation with prior sanction of the State Government has appointed the City Engineer, Mr Prashant. M. Waghmare as the Town Planning Officer, vide resolution 512 dated 23.2.2007. The deputy director of town planning department, vide letter dated 8 t h dec 2007 has given approval to the appointment of the City Engineer, Mr Prashant. M. Waghmare, as the Town Planning Officer for the revision of the development plan hereby annexed in this report in ANNEXURE A.
5.4 Preparation of Existing Land Use.
Under the provisions of section 25 of MR&TP Act 1966 after the declaration of the intention to revise the development plan, the work of existing land use has been carried out.
5.5 Extension to the Publication of Draft Development Plan U/S 21(1) of the Said Act, Granted by State Government
i) From 1 3 t h Dec 2009 to 1 2 t h Dec 2010.
ii) Extension sought from the State Government from 1 2 t h Dec2010 to 1 1 t h Dec 2011.
CHAPTER NO 6
Base Map for Revised Development Plan
6.1Introduction
An accurate base map to a scale as prescribed under the Act, is required for the preparation of a development plan. The most basic pre-requisite for preparation of any statutory plan is the up to-date base map for the entire area to be included in the Plan. The revision process of old city limits comprises of the area for which the earlier DP has been sanctioned in 1987 excluding Dapodi area and including the area of Pashan- Sutarwadi for which Development Plan is sanctioned in 1992. The area for the city in the 1987 DP plan was divided into six sectors. Combined maps and detailed sheets to the scale of 1: 10,000 for the entire municipal area and to the scale of 1 : 2000 respectively for the congested area in the city were prepared.
6.2Base Map
For preparation of the base map, following procedure was adopted. By taking advantage of modern survey techniques such as Total station machines, Differential Global Positioning System (DGPS), etc, ground features were collected and a geo-referenced base map was prepared for the city. In this survey, all the street furniture, buildings/ structures along roads but falling under specified buffer and reservation areas were picked up with their ground co-ordinates. This entire survey was based on a traverse referred with DGPS points already established all over the city, which was projected to UTM co ordinates for working purpose. For Geo referencing, WGS1984 (World Geodetic Survey), latest datum level and UTM43North (Universal Transverse Mercator) is the projection system, adopted for Pune City survey sheets the entire city, village maps, 1987 DP maps of different scales, TP Scheme maps were scanned and digitized, the output of all layers was exported in GIS format with necessary attribute data. Base map with geographic co-ordinates was introduced in development planning process and approximate revenue boundaries (survey boundaries) was also shown based on data available from Land Records Department. The above procedure was adopted and the base map prepared was used for preparing the proposed land use plan.
CHAPTER NO 7
Existing Land Use for Revised DP 1987 for OLD Limits of Pune Municipal Corporation
7.1Introduction
Study of the existing land use pattern of the city and the growth trends is very important in the context of visualizing the perspective of the future land use pattern. As per section 25 of the MR&TP Act 1966, it is obligatory to prepare an existing land use Plan for the proposed development plan area of the city. The existing land use survey is an important and basic study which enables the planners to understand the character of existing development, activity pattern of the city, aids in making a proper analytical study of socioeconomic and physical conditions of the city and in foreseeing the future growth trends.
The master plan for the Pune city was prepared in the year 1952. The first development plan was prepared in 1966, which was revised and sanctioned by Govt. on 5 t h January 1987. The D.P. for Sutarwadi area was sanctioned in 1992. An intention was declared to revise the development plan, as per the provisions of section 38 of MR&TP act 1966, vide general body resolution no. 512 dated 23 r , February 2007. According to the provisions of section 25 of the MR&TP Act 1966, the work of preparation of the existing land use for the old PMC area was assigned to the College of Engineering Pune.
The Planning Team in the old city area carried out an exhaustive land use survey and data was collected in forms specially designed for the purpose. The format in which information was collected by the survey parties is appended at ANNEXURE B
7.2 Base Map for ELU
The base map used for the existing land use survey is described in chapter no 6 of this report. These maps have been used for the existing land use survey. The total city comprises of about 60 - 65 thousand properties, which have been surveyed. Major Land uses that have been observed are residential, commercial, mixed land use, public and semipublic, industrial, recreational etc. The data so collected has been taken on GIS format on various layers and various themes were worked out, analyzed and mapped in upto date manner.
7.3Colour Code of the Land Use
As per the UDPFI guidelines and various land uses prescribed, there is a colour code for each land use prescribed by the state Govt. The same has been followed by the College of Engineering Pune by marking the land use on map and recording in this format. By making use of the advanced GIS technique, information was input in different layers. This is a major improvement in the procedure of preparation of DP. In the earlier DP, this latest technology was no available. As a result, the entire process of carrying out the ELU, representing and analyzing was extremely cumbersome. List of users shown on ELU map is as below and the colour code used attached in ANNEXURE B.
List of land uses
Residential,
Industrial,
Mixed use,
Transport,
Fully commercial,
Recreation,
Public semi public,
Agricultural,
Public utilities (water supply, sewerage,
Water bodies,
burial ground, crimination ground,
Hill top- hill slope,
garbage disposal etc.)
Forest,
Defense,
Vacant,
Slum,
Area Under construction,
Roads
4.11Draft development plan for the newly merged villages
As has been mentioned earlier, 38 villages were merged in the limits of Pune Municipal Corporation on 1 1 t h September 1997. In the year 2001, 15 complete villages and 5 part villages were delinked from the limits of PMC. The area of these 23 villages is 97.84 sq. km. The total area of Pune city is now 243.84 sq. km. The 23 villages assume the shape of a garland around the neck of the old city. The draft Development Plan for the 23 villages was submitted to the State Government on 3 1 s t December 2005. The State Government has accorded part sanction to the Development Plan.
STATEMENT NO 4-1
LIST OF MODIFICATIONS DURING 1987 TO 2008 U/S 37, 50 OF MRTP ACT
LIST OF MODIFICATIONS DURING 1987 TO 2008 U/S 37, 50 OF MRTP ACT
LIST OF MODIFICATIONS DURING 1987 TO 2008 U/S 37, 50 OF MRTP ACT
LIST OF MODIFICATIONS DURING 1987 TO 2008 U/S 37, 50 OF MRTP ACT
LIST OF MODIFICATIONS DURING 1987 TO 2008 U/S 37, 50 OF MRTP ACT
LIST OF MODIFICATIONS DURING 1987 TO 2008 U/S 37, 50 OF MRTP ACT
LIST OF MODIFICATIONS DURING 1987 TO 2008 U/S 37, 50 OF MRTP ACT
LIST OF MODIFICATIONS DURING 1987 TO 2008 U/S 37, 50 OF MRTP ACT
SECTOR-I
SECTOR-I
SECTOR-I
SECTOR-I
SECTOR-I
SECTOR-I
SECTOR-I
SECTOR-I
Sr. No.
Reservation as per DP
Address
Area(Ha) as per DP
37(1)Directives Intial or50(2)
Reservation as per Modification
37(1) fully or Partly reservation changes and Area
Government sanction
1
HS-1
344 to 346, Narayanpeth.
0.2163
37 (2)
Residential Zone
Partly
TPS1896/149/CR/8/96/UD -13, Dt- 3/2/2000
1
HS-1
343 & 347, Narayanpeth.
0.2163
37 (2)
Parking
partly
TPS-1807/1742/CR-886/07/UD-13, Dt-16/10/2007
7.4Scenario AS Regards Existing Land Use of 1987 DP
In 1987 DP, the entire data of the existing land use was collected during the process of the survey and mapping was done for the same. Findings and conclusions were arrived at, after the detailed analysis of the existing land use.
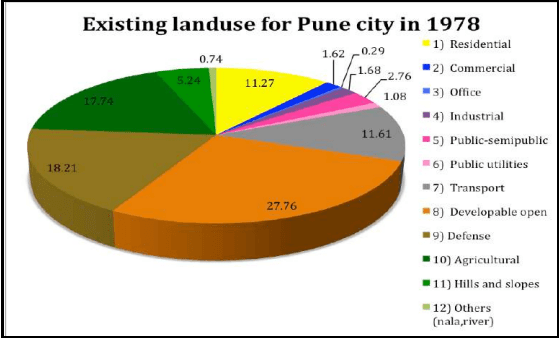
Figure No 7-1 ELU for Pune city 1978
Table No. 7-1 Land use analysis of the ELU of 1987 DP (Base year being 1978-79)
Major land use
% of total area
Major land use
% of total area
1) Residential
11.27
7) Transport
11.61
2) Commercial
1.62
8) Developable open
27.76
3) Office
0.29
9) Defense
18.21
4) Industrial
1.68
10) Agricultural
17.74
5) Public-semipublic
2.76
11) Hills and slopes
5.24
6) Public utilities
1.08
12) Others (nalas and rivers)
0.74
Above broad categories of the land use, as in 1978-79 survey, were considered in the future planning and in formulating proposed land use proposals.
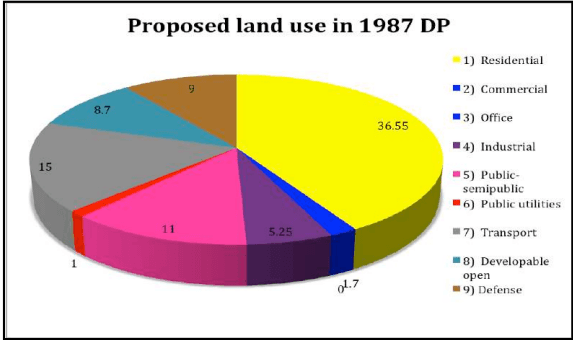
7.5 Proposed land use of 1987 DP
Table No. 7-2 Proposed land use 1987 DP
Major land use
% of total area
Major land use
% of total area
1) Residential
36.55
7) Transport
15
2) Commercial
1.7
8) Developable open
4.8Details of implementation of the revised development plan:
The following table deals with area kept under reservations in these six sectors and the area of the reservations that has been implemented till date.
Table No. 4-6
Table No. 4-6
Table No. 4-6
Table No. 4-6
Table No. 4-6
Table No. 4-6
Table No. 4-6
Table No. 4-6
Implementation of Reservations - SECTOR I
Implementation of Reservations - SECTOR I
Implementation of Reservations - SECTOR I
Implementation of Reservations - SECTOR I
Implementation of Reservations - SECTOR I
Implementation of Reservations - SECTOR I
Implementation of Reservations - SECTOR I
Implementation of Reservations - SECTOR I
TOTAL RESERVATIONS
TOTAL RESERVATIONS
FULLY DEVELOPED RESERVATIONS
FULLY DEVELOPED RESERVATIONS
NOT DEVELOPED RESERVATIONS
NOT DEVELOPED RESERVATIONS
Sr No
Reservations
No
Area
No
Area
No
Area
1
PS
22
3.72
7
1.15
15
2.57
2
HS
2
0.36
1
0.243
1
0.117
3
PS&HS
0
0.37
0
0
0
0.37
4
D/MH/H/HC/FPC
8
1.43
0
0
8
1.43
5
SC
4
0.43
1
0.07
3
0.36
6
CPG
12
2.54
1
0.15
11
2.39
7
PG
7.6Character of the existing land uses in the city
Pune City is a metro city and has also attained a global character during the last three decades. As a result, the character of the existing use of the land is of complex nature. The city has not developed in conventional manner, but it consists of such users which are of multiple nature. In 1987 DP, this multiple character of the city as metro city has been studied since 1965, when the city had started experiencing the influence of the industrial development that was taking place around the city i.e in the neighbouring Pimpri-Chinchwad area, due to development of large Industrial Townships set up by M.I.D.C.
Major Land uses that have been identified are Residential, Mixed use, commercial, Public semi public, Public utilities (water supply, sewerage, burial ground, cremation ground, garbage disposal etc.) Defense, Industrial, Transport, Recreation, Agricultural, Water bodies, Hill top- hill slope, Forest, Vacant, Slum, Roads. Etc.
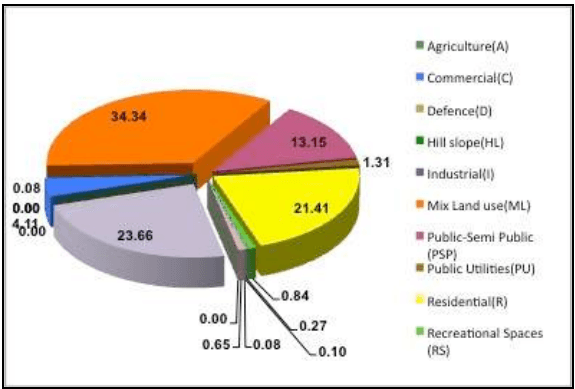
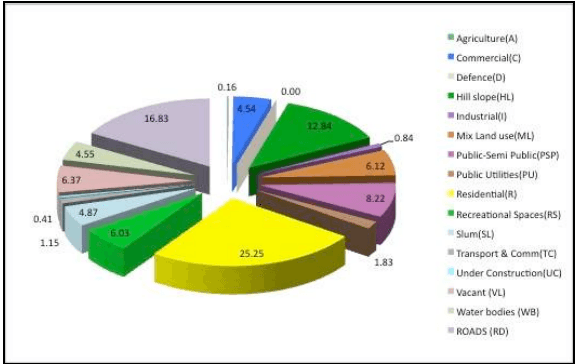
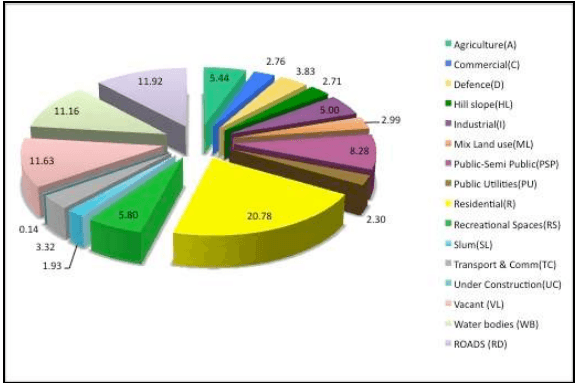
Table No 7-3 EXISTING LANDUSE SURVEY DETAILS . SECTOR I
ZONE
%
ZONE
%
Agriculture(A)
0.00
Residential(R)
21.41%
Commercial(C)
4.11%
Recreational Spaces(RS)
0.84%
Defence(D)
0.00%
Slum(SL)
0.27%
Hill slope(HL)
0.00%
Transport & Comm(TC)
0.10%
Industrial(I)
0.08%
Under Construction(UC)
0.08%
Mix Land use(ML)
34.34%
Vacant (VL)
0.65%
Public-Semi Public(PSP)
13.15%
Water bodies (WB)
0.00%
Public Utilities(PU)
1.31%
ROADS (RD)
23.66%
8.1Introduction
Urbanization is always interpreted as an indicator of development. The anticipated population growth patterns drive most of the important planning policies. The Development Plan is prepared for a city and as per the provisions of the Maharashtra Regional and Town Planning Act 1966; it is revised once in twenty years. Projection of population for the end of the first and second decade is an essential exercise which is to be carried out. The projected population is an important input into the forecasts of housing demand and thus land requirements for housing land available for the use and provision of social amenities for the projected population.
8.1.1 Major objectives of this study were
To carry out the population projection for the year 2017 and 2027.
To work out details like break up by age & sex.
To estimate the working population in the city.
104
To estimate the migration in the city.
To estimate the school going population.
8.1.2 Population Projection
The work of projecting the population and determining its occupational structure was entrusted to Gokhale Institute of Politics and Economics Pune. A copy of the report is kept in office of the DP Cell.
8.1.3 Growth of Population in Pune City
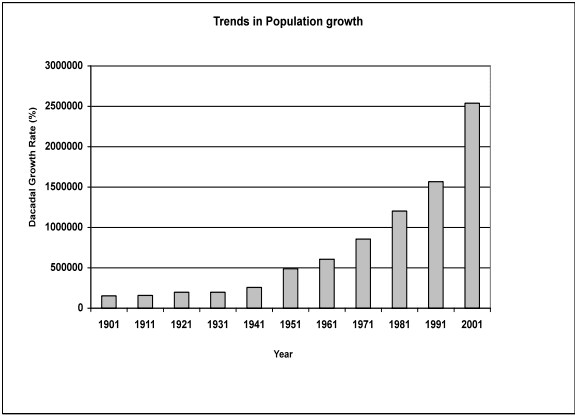
Like many other cities, Pune is experiencing considerable growth due to migration as well as natural increase. The decade trend of population growth of Pune Municipal Corporation from 1991 to 2011 is as follows,
Table No. 8-1 Trend of population growth of PMC for the decade from 1991 - 2001
Year
Population (Lac)
Growth rate (%)
1901
1.53
N.A.
1911
1.59
3.60 (+)
1921
1.99
25.00 (+)
1931
1.98
--
1941
2.58
30.00 (+)
8.3Population Projections for Pune 2027
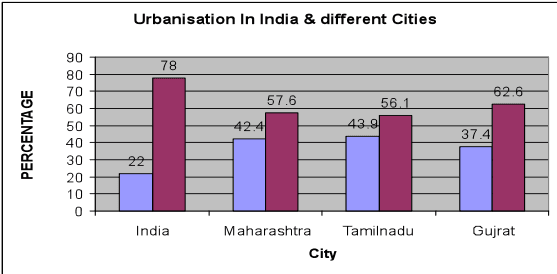
Figure No. 8-13. Urbanisation in India.
Pune is well known as the ‘cultural capital’ of Maharashtra and also as an educational centre. Growing emphasis to the IT sector, impact of the IT sector on the infrastructural facilities, Real Estate, Housing, etc, move towards decentralization of the IT activities, the adverse impact of rising vehicle ownership on accidental deaths, disparity within the city, impact of American recession on the IT sector in India, need for strengthening the
production sector, rising economic level of Pune city, etc are the major causes of migration in Pune.
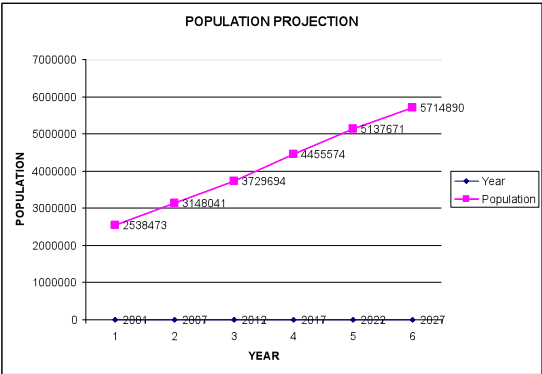
The Demographic Projections for Pune had the objectives to carry out the five half-decadal population projections from 2006-2026 (or 2027), to give details like break-up by age and sex, to estimate the number of workers and to estimate the migration. The method used for the projection is the component method, including the components fertility, mortality, migration and territorial expansion.
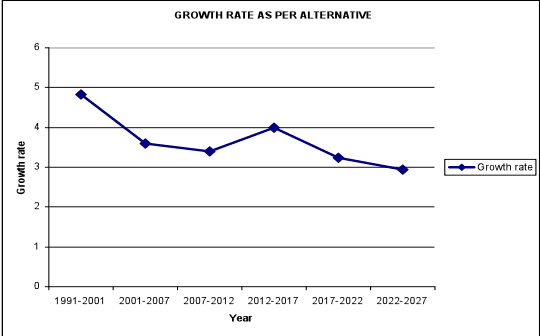
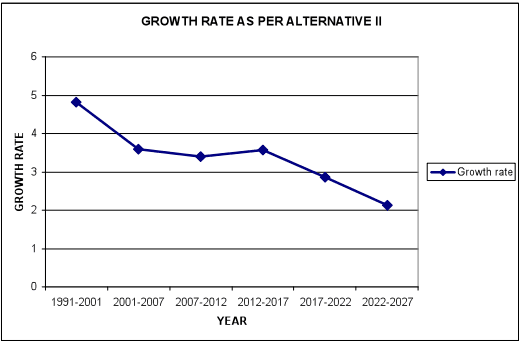
The projections result in two alternatives, I (high) and II (realistic). The higher scenario expects the population to increase by alternative I (high) from 26 lakhs inhabitants 2002 to 62 lakh in 2027. The corresponding figure for 2027 for the realistic scenario is 57 lakh inhabitants. Updated to 2027, the figures are 62 lakh and 57 lakh respectively. Even if these population figures are very high, they are not in any respect surprisingly high, since the population growth has been very high during a long period of time.
8.3Methods of Population Projection
8.2.1 Component method of Population projection
In this method, assumptions about the future trends in all the three components of population growth (fertility, mortality & migration) are made & then the different predicted components are combined to give the projected population for the city.
8.2.1.1 Fertility
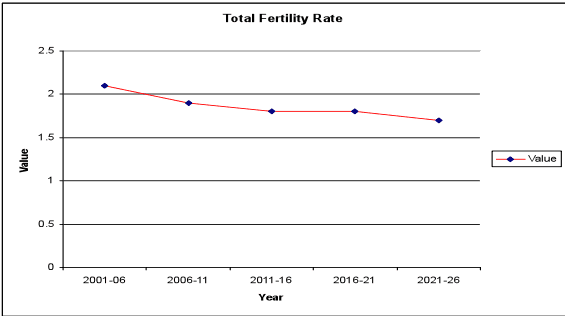
In case of fertility and mortality, the estimates from the sample registration system (SRS) are used. The level of TFR (total fertility rate) for urban Maharashtra is 2.1. Pune city does not have different TFR from urban Maharashtra.
The Sample Registration System data on TFR for urban Maharashtra revealed that for 1996 TFR was 2.4, for 2003 it was 2.1, while in 2004 it was 1.9.
Table No. 8-2 TFR for Pune
TFR
2001-06
2006-11
2011-16
2016-21
2021-26
Value
2.1
1.9
1.8
1.8
1.7
Figure No. 8-1. Total Fertility rate
8.2.1.2 Mortality
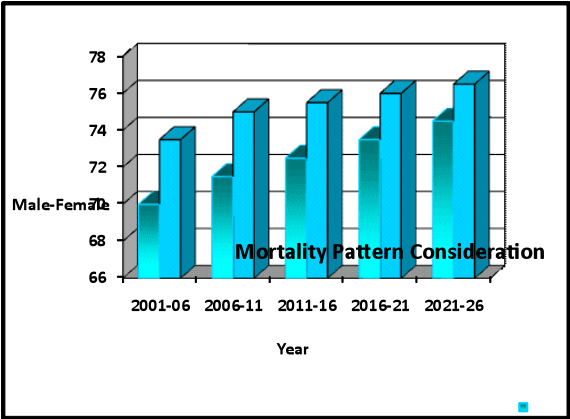
Projections are required for male & females separately starting with birth.
It was necessary to know the value of sex-ratio at birth for current and future years. Mortality pattern is always represented through e 0 (expectation of life at birth).
Table No. 8-3 Mortality pattern Consideration for Pune city
Years e<sup>0</sup>
2001-06
2006-11
2011-16
2016-21
2021-26
Male
70
71.5
72.5
73.5
74.5
8.4Territorial Expansion in PMC limit
Considering the expansion of PMC limits due to the merger of 23 fringe villages.
Assuming the merger of further 15 full and 5 part fringe villages in PMC limit in the near future.
Considering the township development in village Nanded, which is likely to be included in the city
The earlier identified future urbanisable area admeasuring about 1140 Ha is now converted from agriculture zone to residential zone. Considering the above factors, software DEMPROJ was applied for the projections and the results thus obtained were found out after carrying out the necessary analysis.
Taking into considerations the various above factors, the realistic option has been taken into account.
Table No. 8-14 Projection for territorial expansion in PMC limit.
Year
2001
2007
2012
2017
2022
2027
Population
25,38,473
31,48,041
37,29,694
44,55,574
51,37,671
57,14,890
Male
13,20,438
16,42,049
19,51,413
23,40,923
27,08,460
30,20,329
Female
12,16,410
15,05,992
17,78,281
21,14,651
24,29,211
26,94,561
Figure No. 8-14 Projected Population
8.5 Growth rate
Figure No. 8-15 Trends Of Population Growth.
As per the study carried out by Gokhale Institute, considering various factors and comparison with the previous surveys, the growth rate is considered as per Alternative II (realistic)
8.6Migration
Large-scale IT parks are mainly functioning at Hinjewadi, Talawade, Kharadi and Hadapsar. Pune is growing with expanding IT sector. It is observed that during 1981-91, there were 3.1 lakhs in-migrants in the urban agglomeration, while during 1991-2001, the figure went up to 7.4 lakhs, amounting to about 13 and 20 percent of the total population.
Table No. 8-16 Projected Migration.
Year
2001-06
2006-11
2011-16
2016-21
2021-26
Migration %
12%
12%
10%
10%
8%
Figure No. 8-17. Inter-State Migration
Figure No. 8-18. Migration within State
8.7 Projected Age And Sex Distribution for 2027
Table No. 8-17 Projected Age And Sex Distribution
Table No. 8-17 Projected Age And Sex Distribution
Table No. 8-17 Projected Age And Sex Distribution
Table No. 8-17 Projected Age And Sex Distribution
2027
Total
Male
Female
0 - 9
448,493
238,693
209,799
10-19
490,623
262,284
228,338
20-29
563,991
305,308
258,683
30-39
554,197
292,573
261,623
40-49
488,987
264,838
224,150
50-59
367,890
8.9Occupation structure in Pune City
The population of Pune City in the year 1991 is 15.66 lakh in 2001 is 25.38 lakhs and in 2011 is 31.15 lakhs with a growth rate of about 30.0 % and 40 and 45 % respectively.
According to 1991 data, the city had 39.01% workers in the secondary sector with 25.7% in manufacturing. The tertiary sector accounts for 58.96% of workers with 22.36 in trade and commerce and 28.15 % under ‘services’.
The total population of town as per census 2001 is 25.38 lakhs. According to Census 2001, the work participation rate of Pune city was 34.19 percent and total non-working population was 65.80 percent. This shows that the work participation rate i.e. the number of people engaged in work shows marginal increase since 2001.Out of the total working population, 2.5 percent is engaged in primary sector, 45.3 percent in secondary sector and 55.2 is engaged in tertiary sector.
Table No. 8-24. Occupation structure in Pune City
Primary sector
2.03%
Secondary sector
39.01%
Tertiary sector
58.96%
Figure No. 8-22. Occupational Structure
Classification of workers
Percent
Classification of workers
Percent
Primary
2.5
Total working
34.19
Secondary
45.3
Non-working
65.80
Tertiary
52.2
Total working
36.96
Population (Primary Secondary + Tertiary)
Non working
63.04
Population
9.1Introduction
Pune city, the second largest metropolitan city in the state, is fast changing its character from Pensioner’s city to Educational – Administrative Center and now to an important Industrial hub with reference to the IT Center. The land use and their consequential results such as density of population, congestion on roads, fast deteriorating level of services etc. are becoming more and more complex day by day. The city also reflects the change in its ethos from taking pride in having the highest number of bicycle users to one having a large number of automobiles. from Wada culture to large multiplexes and high risers on one side and large numbers of slums on the other. As a result, the revised development plan of 1987 has not been able to meet the demands of the rapid urbanization in the City.
The population of Pune city has grown from 7.37 lakhs in 1961 to 25 lakhs in 2001. It signifies a descriptive understanding of the changing need pattern of the utility services such as water supply, sewage system, transportation, housing, parking space, shopping and other entertainment areas. The present study focuses on the perception of the population about the changes that have occurred because of urbanization and highlights their opinions about the infrastructure development and quality of life. It studies the priorities of citizens for future development of the city.
In accordance with the same, the responsibility of conducting the Socio- Economic Survey of Pune city was entrusted upon B. D. Karve Research and Consultancy Cell of Karve Institute of Social Service.
8.8Population Density
One of the distinguishing characteristics of Pune city is the compact urban area and high population density. It is seen that the core area of city is about 4.5 sq. km. Sector I has a population density of 551 person/ha as compared to the sectors II to VI. The urban area along the core is also expected to densify from 266 person/ha in 2007 to 301person/ha in 2027. The expected population increase in the old city is about 3356121 persons in the year 2027.
The urban area in sector IV and sector VI having population from 296876 persons to 315431 persons are observed to have moderate population densities ranging from 64 person/ha to 73 person/ha in 2001. The minimum projected population there, is 336121 persons. The population density in the respective sector is observed to increase to 148 person/ha -181person/ha.
Sector I
Table No. 8-18 Projected population for sector I
Sr. No.
Year
Population
Sector I
%
population
area in ha
gross density
2001
as per 87 DP report
596644
495
1205.34
2001
1855476
16
296876
621.18
477.92
2007
2138243
16
342119
621.18
550.76
2012
2371663
16
379466
621.18
610.88
2017
2650481
16
424077
621.18
682.70
2022
2975718
15
446358
621.18
718.56
2027
3356121
15
503418
621.18
810.42
Sector II
Table No. 18-19 Projected population for sector II
9.2Population Size
The growth and development of any city is reflected in the change in its population pattern, for example its birth and death rate, migration, etc.
According to the District Census handbook of Pune. 1971, the population of Pune city, in the year 1891was 1.18 lakhs. It remained more or less the same, at 1.20 lakhs in the year 1901. The slow population growth in this decade can be attributed to high death rate due to severe droughts that the region faced during this time. Even during the period
between 1901 to 1921, the population size did not show a significant increase, because the region had to face several epidemics including influenza during this period.
It was only after 1920s that the population in the city increased considerably In the year 1941, the population size reached 2.57 lakhs. When the Pune Municipal Corporation was set up in 1950, it catered to a total population of 4.85 lakhs. The main reasons for a significant change in the population size from 1920 to 1950 were increase in employment and business opportunities after the World War II, large-scale migration from Pakistan after the Partition and from other neighboring countries. There was an 85% increase in the population size of the city during this period.
After the 50s, the decadal growth up to 1991 was in the range of 30-40 percent. The population in 1961 was 5.95 lakhs, which went up to 12.03 lakhs in 1981. According to the Census 2001, the population of Pune city was 25, 38,473 with a total of 555,771 households. The total population of the city within PMC limits in the year 2011 is around 31.5 lakhs.
9.2.1 Trends in Population Growth in Pune city
Table No. 9-1. Population Growth in Pune city
Year
Population
Year
Population
1780
150000
1941
257554
1851
73000
1951
488419
1891
9.4Standard of Living of the population of Pune City:
Standard of Living is determined by the level of material comfort as measured by the goods, services, and luxuries available to an individual, households, group or nation. The present survey has taken note of several commodities present in the households to determine the standard of living index for the population. These goods or commodities are either bought by the household members or gifted to them. But in either case, the household members are utilizing the commodities and hence are able to enjoy the benefits of the same. Presence or absence of certain commodities in the house determines the standard of living of that particular household.
The present study has calculated the household measure called Standard of Living Index as follows :
Standard of Living Index (SLI) of the surveyed population
Standard of Living Index scores
Frequency
Percent
Low (score 7-31)
2195
39.5
Medium (score 32-56)
2604
46.9
High (score 57-82)
758
13.6
Total
5557
100.0
Figure No. 9-1. Standard of Living Index
Index score range from 7 to 31 for low SLI, from 32 to 56 for medium SLI and 57 to 82 for a high SLI. By this measure, more than 1/3 (39.5%) of households from Pune have a low standard of living, 46.9% have medium standard of living and 13.6% have a high standard of living.
9.5Economic and Employment Profile
a) Future Economic Trends for Pune City
Since 1985, Pune’s ability to generate workforce and skilled manpower for new and knowledge intensive industries has been more sharply felt. It has increasingly enhanced its historical reputation as an educational and R &D centre. Three areas noted for their professional training setups, have merged in the last two decades: management education, IT and computer education, and engineering. Moreover, a number of established educational institutions have introduced new courses and research areas (for example NCL, NIV and
NARI in cell research in the department of bio-informatics in Pune University). This course of events has helped Pune emerge as a top IT-BT centre.
b) Pune, the emerging IT & BT:
Pune was the first city in the country to have a software technology park; TCS, Wipro, Infosys, Mahindra British Telecom, Mastek and PCS have significant presence in Pune. Global majors like HSBC Global Technology, IBM, Sasken, Avaya, T-systems and Syntel also have a major presence in the city. During the last eight years, this sector has grown from Rs. 250 crores to Rs.6500 crores.
After the development of MIDC, Industrial growth is seen in a radius of 60-65 kms from the main city of Pune. Distinct hubs of industrial activities can be seen, with most of the manufacturing industries concentrated in and around the Pimpri, Chinchwad and Bhosari MIDC. Several smaller industrial hubs have formed around this area prominent among them being Tathavade, Chikhali, Moshi, Khadki, Dighi,Nigdi etc.
The other belts of industrial growth can be seen in the Pune-Chakan belt (Moshi, Chimbli, Kuruli, Khed, Mahalunge), the Pune-Mumbai belt (from PCMC, Khadki, Dehu, Pirangut and Urawade, Urse, Ambi, Talegaon, Kanhe, Takwe upto Lonavala), the Pune-Nagar belt (Kharadi, Wagholi, Koregaon Bhima, Sanaswadi up to the MIDC at Ranjangaon).
c) Pune as the Oxford of the East:
The other big sector that Pune has hosted is education. Termed as the Oxford of the East, the first landmark in Pune’s evolution as an educationa centre was the establishment of the Deccan Education Society in the city. Today the city has six universities, which include 600 functional colleges and PG departments in their fold. It is estimated that the student population exceeds five lakhs.
10.2Housing Survey in OLD Limit of Pune
10.2.1 The work of housing survey was allotted to Mashal by Pune Municipal Corporation (PMC). The number of households in year 2007 was assessed based on the demographic projections carried out by Gokhale Institute of Politics & Economics. Of the total population, about 40.56% live in slums. The estimated household in the old PMC limit are 474,165. The overall sample size for the household survey was 4752 i.e 1% of the total households. The sample size also includes slum sample which is 1902 households.
The housing situation in the city as per MASHAL & Census is as follows;
Table No. 10-1. Housing Occupancy
Sr. No
Category
Census 2001
MASHAL Sample Survey
1
No. of houses as per Census of2001
763, 133
2
Occupied Houses
625, 336
82%
90%
3
Vacant Houses
137, 797
18%
10%
4
Household Size
4.57
4.74 (Non-Slum)
5.4 (Slum)
10.2.2 House Distribution by Use
The distribution of houses by use in Pune as per Census indicates that about 509,819 houses contributing about 82% of that of occupied houses is under residential use and total 65,951 are shops and offices with about 11% share from total 625,336 occupied houses.
Table No 10-2. Distribution of house
Census Houses
763133
Occupied Houses
625,336
Residential houses
509,819
Residential cum commercial
8,810
Shops / Offices
65951
School
10.1Introduction
10.1.1 The economy of the Pune city has been transformed over the past few decades. The technologies have changed. PMC’s budget has multiplied many folds. Per capita income of the citizen, their expenditure pattern and life style have seen huge changes in the last few decades. Mindsets of people including those of the policy makers have changed. Development of the City is now considered a joint exercise where expertise, technological edge and financia involvement of the private sector are encouraged in the interest of development of the city. For sound planning of the congested parts of the city, it is necessary to know the magnitude of congestion in addition to locating the pockets of congestion.
10.1.2 In order to ensure that our city continues to look beautiful, it is necessary to widen its roads, to redesign its residential areas by removing insanitary conditions and decongesting some of the wards. In other words, it is necessary to know the ages of all structures in different wards in the city and to know the extent of mixed uses of housing in a ward. It is also necessary to know the per capita availability of living space and the extent to which facilities like bathroom, latrine, direct municipal tap etc. are available to the residential areas in different wards in order to plan for their improvement. This information, which is essential for social planning of the city, can be known only through a well-designed and comprehensive sample survey of the housing conditions.
In addition to all the TPS mentioned above, the PMC undertook various road schemes in order to achieve proper connectivity as follows:
Scheme of Tilak road running from Swargate to Lakdi bridge ( Sambhaji bridge)
Scheme of Laxmi road running from Lakdi Bridge to Quarter Gate through the heart of the town. This was an east-west road.
Ganesh Road Scheme which joined the Jijamata Baug to the Phadke Howd.
Phule Market Road from Phule Market to the Govind Halwai Chowk.
Bajirao Road from Parvati Naka to Vishrambaug Wada.
Mankeshwar Road from Ram baug to Omkareshwar.
In addition, the PMC also undertook work of shifting of Timber market from Gultekadi to presently located timber market in Bhavani Peth. This is an ambitious scheme implemented in the outer area. The present timber market is an area planned for building material business.
The Pune Municipality had thus not only controlled the development of the out-laying open areas but also provided new avenues for traffic and development in the city. This development had proceeded on the systematic lines of urban development. The old city of Pune was however very congested and despite the developments of new roads and road widening schemes, it was realized that the town proper could not be improved to the standards laid down in the Town Planning norms or to those standards which were followed in the schemes of Town Planning which were in hand at that time. The Municipality had prescribed regular lines of streets for practically all the roads in old city. This, partially regulated the construction of buildings.
It was proposed to carry out the implementation of the Development Plan of 1966 in the following manner :
Widening of Roads :
Under regular line of streets as per BPMC Act 1949
Under the Land Acquisition Act,1984
Under the provisions of Bombay Town Planning Act of 1954, by preparing schemes.
Acquisition of sites reserved for various public purposes under Land Acquisition Act1894
By provisions of amenities such as construction of schools , dispensaries, libraries, markets , theatres, parks ,gardens etc.
Improvement of the various congested localities and slum areas.
Out of the 459 sites designated in the sanctioned Development Plan of 1966, only 110 sites were proposed in the plan submitted to the Government by the Pune Municipal Corporation, while 349 sites were introduced at the Government level, while sanctioning the Plan. Total area admeasuring 1559 Ha was reserved under the various 458 public sites.
The total cost of acquisition of all these sites was estimated to be Rs 1,15,63,400=00. If we consider the extent to which the proposals in this Development Plan were implemented, we find that out of the 26,84,166 sq. m of roads that were proposed in the Development Plan, only 11,05,470 sq. m of roads were actually implemented. Also, out of the 37,34,964 sq. m of reservations that were proposed in the Plan, only 7,57,212 sq. m of the reservations were actually implemented on site. If we consider the
implementation of reservations, it has been only 7.27 %. The following table gives the details regarding the implementation of reserved sites.
Table No 4-2 Sites Reserved And Implemented In 1966 Development Plan
Sector
No. of Sites designated
No. of Sites deleted later
No. of Sites implemented
Balance Sites
I
114
8
5
101
II
110
11
7
92
III
87
12
9
66
IV
30
1
5
24
V
36
6
1
29
VI
82
8
3
71
Total
459
46
30
383
Out of 413 sites, only 30 sites were implemented. This picture would have been very different if TPS were undertaken in sufficient numbers to implement the proposals of the Plan. However, no new TPS was undertaken.
4.2.2.2. Implementation of road proposals of 1987 DP .
Table No.
4-3 Implementat
ion Of Roads In 1987 DP
Width of road
Length proposed
Length of road
(M)
in 1987 DP (km)
implemented (km)
Widening Up to 6 m
1.789
0.532
9
12.038
3.804
12
29.548
15.423
15
13.401
6.277
18
17.839
12.352
20
23.99
15.069
21
0.290
0.036
24
39.588
27.349
27
1.89
1.89
30
50.14
33.852
36
23.24
22.308
42
2.716
2.716
45
14.617
12.123
60
11.929
11.929
It can be seen, that about 68.30 % of road length proposed in DP of 1987 have been implemented, which is fairly satisfactory as compared to the implementation of reservations for social amenities.
Table No 4-4 Sites Reserved And Implemented In 1987 Development Plan
Sector
No. of Sites designated
No. of Sites deleted
No. of Sites implemented
Balance Sites
I
95
6
16
73
II
138
3
37
98
III
116
2
34
80
IV
78
4
17
57
V
70
4
16
50
VI
110
3
14
98
Total
607
20
134
453
Out of 609 sites, only 134 sites were implemented. If we consider the both fully and partly developed reservations, the overall implementation of the reservations has been 22%.
2
PSP Zone (M/78)
380 To 382 & 721, Narayanpeth
0.726
37 (2)
Residential Zone
0.726
TPS-1889/1898/CR-191/89/UD-13, dt. 07/03/1995
3
MK- 4
F.P. No 53/1, Mangalwarpeth
0.1177
37 (2)
Residential Zone
649 sqmt (partly)
TPS/1892/432/92/UD-13, Dt-21/5/96
4
Burial Ground
95 (pt) Sadashivpeth
37(2)
PSP -Zone
TPS-1897/848/CR-18/2000/UD-13.dt01/03/2000
5
M-53 (Extn. To KEM)
553,558,559 & 589,Rasta Peth
0.7807
50 (2)
Residential
0.725
TPS-1887/1793/CR-263/87/UD-7, dt. 22-11-1988
5
M-53 (Extn. To KEM)
553,558,559 & 589,Rasta Peth
0.7807
50 (2)
K.E.M. Hospital's Staff Quarter
0.0557
TPS-1887/1793/CR-263/87/UD-7, dt. 22-11-1988
6
50' Road widening
383 & 403 , Narayanpeth
37 (2)
Reduction of Road Widening from 50' to 30'
-
TPS-1888/1688/CR-264/88/UD-13, dt. 29/07/1989
7
HDH ( M-10)
715 To 717,755To 760, Guruwarpeth
0.6883
37 (2)
Residential Zone
0.6883
TPS-1800/167/UD-13. dt. 28-10-2004
8
P - 11
1349,1350.Shukrawarpeth
0.0922
37 (2)
Residential Zone
0.0922
TPS-1887/673/CR-74/87/UD-13. dt. 16-12-1991
9
PO-2
434, Shaniwar peth
0.0319
Purchase Notice
Residential Zone
0.0319
-
10
Slum Improvement Zone (M - 69)
1044, Nanepeth
1.1184
37 (2)
Residential Zone
TPS-1888/2467/CR-368/88/UD-13. dt. 24-04-1992
11
P - 10
1328,1329.Shukrawarpeth
0.0885
37 (2)
Residential Zone
0.0885
TPS-1887/673/CR-74/UD-13. dt. 22-04-1991
12
9.mt. Road
365,367,368 & 401.Sadashivpeth
37 (2)
Residential Zone
-
TPS-1800/522/UD-13.dt.29/09/2001
13
HDH-1
F.P. No 29-A-2, TPS-III
0.2027
37 (2)
Residential Zone
0.2027
TPS-1889/1457/CR-136/89/UD-13. dt. 29/10/1991
14
Public Semi Public Zone
931,607, Khadakmal, Shukrawar Peth
-
37(2)
Residential Zone
TPS/1801/UOR/55/UD -13, Dt-22/06/2003
TOTAL NO-14
TOTAL NO-14
TOTAL NO-14
TOTAL NO-14
SOURCE: Town Planning Dept (Central Bldg) & D.P.B.P.(PMC)
SOURCE: Town Planning Dept (Central Bldg) & D.P.B.P.(PMC)
SOURCE: Town Planning Dept (Central Bldg) & D.P.B.P.(PMC)
SOURCE: Town Planning Dept (Central Bldg) & D.P.B.P.(PMC)
LIST OF MODIFICATIONS DURING 1987 TO 2008 U/S 37, 50 OF MRTP ACT
LIST OF MODIFICATIONS DURING 1987 TO 2008 U/S 37, 50 OF MRTP ACT
LIST OF MODIFICATIONS DURING 1987 TO 2008 U/S 37, 50 OF MRTP ACT
LIST OF MODIFICATIONS DURING 1987 TO 2008 U/S 37, 50 OF MRTP ACT
LIST OF MODIFICATIONS DURING 1987 TO 2008 U/S 37, 50 OF MRTP ACT
LIST OF MODIFICATIONS DURING 1987 TO 2008 U/S 37, 50 OF MRTP ACT
LIST OF MODIFICATIONS DURING 1987 TO 2008 U/S 37, 50 OF MRTP ACT
LIST OF MODIFICATIONS DURING 1987 TO 2008 U/S 37, 50 OF MRTP ACT
SECTOR-II
SECTOR-II
SECTOR-II
SECTOR-II
SECTOR-II
SECTOR-II
SECTOR-II
SECTOR-II
Sr. No.
Reservation as per DP
Address
Area(Ha) as per DP
37(1)Directives Intial or50(2)
Reservation as per Modification
37(1) fully or Partly reservation changes and Area
Government sanction
1
Hill Top Hill Slope
S.No.631(pt),Bibwewadi
0.2
37 (2)
PSP -Zone
TPS-1894/862/UD-13, dt. 15-03-1995
2
EWS-12
S.No.672/11(pt),Bibwewadi
0.31
37(2)
Residential Zone
500 sqmt
TPS-1891/1850/CR-203/91-UD-13.dt.04-03-1994
2
EWS-12
S.No.672/8, Bibwewadi
0.25
50(2)
Residential Zone
0.25
TPS-1889/1616/CR-146/UD-13.dt.01-08-1991
3
G-9
F.P.No. 540/1 Parvati
1.94
37(2)
Fire-Brigade (FB-2)
0.32
TPS-1801/488/UD-13. dt.13-02-2004
3
G-9
F.P.No. 540/2 Parvati
1.94
37(2)
Civic & Cultural Centre
0.32
TPS-1801/488/UD-13. dt.13-02-2004
3
G-9
F.P.No. 540/3 &4 Parvati
1.94
37(2)
PSP Zone
TPS-1801/488/UD-13. dt.13-02-2004
4
FB-2
F.P.No541, Parvati
0.66
37(2)
Sewage Treatment Plant
0.66
TPS-1801/488/UD-13. dt.13-02-2004
5
Hill Zone
S.No.87/1/A/1,Parvati
37(2)
Residential Zone
TPS-1887/88/CR-257/UD-13, Dt- 28/05/1992
5
Hill Zone
S. No. 86(pt), Parvati
37(2)
Residential Zone
TPS-1887/1980/CR-257/88/UD-13.dt.04-04-2002
6
Hill Zone
S.No.11 Hiss no. 1A/1/1/2, 12,
0.9
37(2)
Residential Zone
0.30
TPS-1895/480/CR-58/95/UD-13,dt.02-03-1996
6
Hill Zone
S.No.11 Hiss no. 1A/1/1/2, 12, Dhankawadi
0.9
37(2)
Residential Zone
0.60
TPS-1895/480/CR-58/95/UD-13,dt.02-03-1996
7
Sr. no.19, Dhankawadi (G-17)
Dhankawadi
1.38
37(2)
Residential Zone
Partly
TPS-1894/1856/CR-114/94/UD-13. dt.13/07/2006
8
Agriculture Zone
Katraj
7A, 7B, 8& 9,Katraj
37(2)
Residential Zone
TPS-1899/606/CR-139/99/UD-13, dt-27/6/2000
9
PS-46
S.No.585 (pt), Munjeri
0.87
50(2)
Residential Zone
0.87
TPS-1885/3429/CR-350/UD-13. dt.29-08-1990
10
PS-49
S.No. 673 (pt), Bibwewadi
0.88
37(2)
Residential Zone
0.6772
TPS-1803/1104/CR-334/06/UD-13,dt.14-09-2007
11
Hill Top Hill Slope
S.No.76 to 81,Plot No.927 to 941,Parvati
Residential Zone
TPS-1887/830/CR-151/87/UD-13. dt.28-12-1989
12
HS-8
F.P.No. 498,TPS-iii
0.56
37(2)
Residential Zone
0.56
TPS-1888/2690/CR-393/88/UD-13.dt.5-10-1991
13
G-14
F.P.No.438,P.No. 1-3 &8-9
1.49
37(2)
Residential Zone
Partly
TPS-1892/1286/CR-88/92/UD-13.dt.12-02-1993
14
PK-6
Sv No 87 (pt) Parvati
0.2
47
Residential Zone
Partly
TOTAL NO-14
TOTAL NO-14
TOTAL NO-14
TOTAL NO-14
SOURCE: Town Planning Dept (Central Bldg) & D.P.B.P.(PMC)
SOURCE: Town Planning Dept (Central Bldg) & D.P.B.P.(PMC)
SOURCE: Town Planning Dept (Central Bldg) & D.P.B.P.(PMC)
SOURCE: Town Planning Dept (Central Bldg) & D.P.B.P.(PMC)
LIST OF MODIFICATIONS DURING 1987 TO 2008 U/S 37, 50 OF MRTP ACT
LIST OF MODIFICATIONS DURING 1987 TO 2008 U/S 37, 50 OF MRTP ACT
LIST OF MODIFICATIONS DURING 1987 TO 2008 U/S 37, 50 OF MRTP ACT
LIST OF MODIFICATIONS DURING 1987 TO 2008 U/S 37, 50 OF MRTP ACT
LIST OF MODIFICATIONS DURING 1987 TO 2008 U/S 37, 50 OF MRTP ACT
LIST OF MODIFICATIONS DURING 1987 TO 2008 U/S 37, 50 OF MRTP ACT
LIST OF MODIFICATIONS DURING 1987 TO 2008 U/S 37, 50 OF MRTP ACT
LIST OF MODIFICATIONS DURING 1987 TO 2008 U/S 37, 50 OF MRTP ACT
SECTOR-III
SECTOR-III
SECTOR-III
SECTOR-III
SECTOR-III
SECTOR-III
SECTOR-III
SECTOR-III
Sr. No.
Reservation as per DP
Address
Area(Ha) as per DP
37(1)Directives Intial or50(2)
Reservation as per Modification
37(1) fully or Partly reservation changes and Area
NOTE: PARTLY DEVELOPED RESERVATIONS ARE CONTINUED WITH THE RESPECTIVE REMAINING AREA
Table No. 4-7
Table No. 4-7
Table No. 4-7
Table No. 4-7
Table No. 4-7
Table No. 4-7
Table No. 4-7
Table No. 4-7
Implementation of Reservations - SECTOR II
Implementation of Reservations - SECTOR II
Implementation of Reservations - SECTOR II
Implementation of Reservations - SECTOR II
Implementation of Reservations - SECTOR II
Implementation of Reservations - SECTOR II
Implementation of Reservations - SECTOR II
Implementation of Reservations - SECTOR II
TOTAL RESERVATIONS
TOTAL RESERVATIONS
FULLY DEVELOPED RESERVATIONS
FULLY DEVELOPED RESERVATIONS
NOT DEVELOPED RESERVATIONS
NOT DEVELOPED RESERVATIONS
Sr No
Reservations
No
Area
No
Area
No
Area
1
PS
25
18.21
7
5.07
14
13.14
2
HS
9
14.57
2
3.42
5
11.15
3
PS&HS
0
0
0
0
0
0
4
D/MH/H/HC/FPC
4
10.58
0
0
4
10.58
5
SC
10
2.35
6
1.73
0
0.62
6
CPG
24
5.56
4
1.04
20
4.52
7
PG
11
13.04
5
2.44
6
10.6
8
G
9
11.16
2
2.69
7
8.47
9
PARK
4
129.35
1
0
3
129.35
10
FB
3
2.26
0
0
3
2.26
11
P
11
3.86
4
0.87
7
2.99
12
PMPML
4
4.29
0
0
3
4.29
13
MK
0
0
0
0
0
0
14
MP
0
0
0
0
0
0
15
PO
0
0
0
0
0
0
16
PUMPING STATION
1
0.11
0
0
0
0.11
17
C-2
1
2.14
0
0
1
2.14
18
CC
2
6.57
0
0
2
6.57
19
EWS
7
55.96
4
35.85
3
20.11
20
HLW
0
0
0
0
0
0
21
BU&CR
0
0
0
0
0
0
22
AIR
0
0
0
0
0
0
23
DB
0
0
0
0
0
0
24
WH
0
0
0
0
0
0
25
CP
0
0
0
0
0
0
26
GOVT OFFICE
0
0
0
0
0
0
27
HDH
0
0
0
0
0
0
28
MSEB/EXTN TO MSEB
0
0
0
0
0
0
29
ITI
0
0
0
0
0
0
30
EXTEN TO COEP
0
0
0
0
0
0
31
VM
0
0
0
0
0
0
32
TW
0
0
0
0
0
0
33
APMC
2
13.98
1
12.78
0
1.2
34
ON
1
1.04
0
0
0
1.04
35
MWO/CH/LIB
0
0
0
0
0
0
36
PC
0
0
0
0
0
0
37
CART STAND
0
0
0
0
0
0
38
BIRD SANCTURY
0
0
0
0
0
0
39
TE
1
1.2
0
0
0
1.2
40
CH&SC
0
0
0
0
0
0
41
TRUCK PARKING
0
0
0
0
0
0
42
EXTEN TO T M
2
2.274
0
0
2
2.274
43
STADIUM
1
0.54
1
0.54
0
0
44
RGY
1
6.75
0
0
1
6.75
45
TIMBER INDUSTRY
1
21
0
0
1
21
46
STEEL YARD
1
40.52
0
0
0
40.52
47
MUSEUM
0
0
0
0
0
0
48
PUBLIC HOUSING
0
0
0
0
0
0
TOTAL
135
367.314
37
66.43
82
300.884
NOTE: PARTLY DEVELOPED RESERVATIONS ARE CONTINUED WITH THE RESPECTIVE REMAINING AREA
NOTE: PARTLY DEVELOPED RESERVATIONS ARE CONTINUED WITH THE RESPECTIVE REMAINING AREA
NOTE: PARTLY DEVELOPED RESERVATIONS ARE CONTINUED WITH THE RESPECTIVE REMAINING AREA
NOTE: PARTLY DEVELOPED RESERVATIONS ARE CONTINUED WITH THE RESPECTIVE REMAINING AREA
NOTE: PARTLY DEVELOPED RESERVATIONS ARE CONTINUED WITH THE RESPECTIVE REMAINING AREA
NOTE: PARTLY DEVELOPED RESERVATIONS ARE CONTINUED WITH THE RESPECTIVE REMAINING AREA
NOTE: PARTLY DEVELOPED RESERVATIONS ARE CONTINUED WITH THE RESPECTIVE REMAINING AREA
NOTE: PARTLY DEVELOPED RESERVATIONS ARE CONTINUED WITH THE RESPECTIVE REMAINING AREA
Table No. 4-8
Table No. 4-8
Table No. 4-8
Table No. 4-8
Table No. 4-8
Table No. 4-8
Table No. 4-8
Table No. 4-8
Implementation of Reservations - SECTOR III
Implementation of Reservations - SECTOR III
Implementation of Reservations - SECTOR III
Implementation of Reservations - SECTOR III
Implementation of Reservations - SECTOR III
Implementation of Reservations - SECTOR III
Implementation of Reservations - SECTOR III
Implementation of Reservations - SECTOR III
TOTAL RESERVATIONS
TOTAL RESERVATIONS
FULLY DEVELOPED RESERVATIONS
FULLY DEVELOPED RESERVATIONS
NOT DEVELOPED RESERVATIONS
NOT DEVELOPED RESERVATIONS
Sr No
Reservations
No
Area
No
Area
No
Area
1
PS
15
11.01
7
3.25
8
7.76
2
HS
6
9.03
2
3.89
4
5.14
3
PS&HS
0
0
0
0
0
0
4
D/MH/H/HC/FPC
7
5.6
2
2.94
5
2.66
5
SC
14
3.04
6
1.33
8
1.71
6
CPG
15
4.62
5
1.83
10
2.79
7
PG
10
9.59
2
1.46
8
8.13
8
G
7
5.49
1
0.87
6
4.62
9
PARK
2
20.69
0
0
2
20.69
10
FB
1
1
0
0
1
1
11
P
6
5.42
1
0.6
5
4.82
12
PMPML
3
3.61
0
0
3
3.61
13
MK
1
0.4
0
0
1
0.4
14
MP
0
0
0
0
0
0
15
PO
2
0.12
0
0
2
0.12
16
PUMPING STATION
2
1.96
1
1.04
1
0.92
17
C-2
11
16.69
5
7.82
6
8.87
18
CC
1
12.14
0
0
1
12.14
19
EWS
5
55.47
0
0
5
55.47
20
HLW
1
0.4
0
0
1
0.4
21
BU&CR
2
7.41
0
0
2
7.41
22
AIR
1
1.42
1
1.42
0
0
23
DB
0
0
0
0
0
0
24
WH
0
0
0
0
0
0
25
CP
0
0
0
0
0
0
26
GOVT OFFICE
0
0
0
0
0
0
27
HDH
0
0
0
0
0
0
28
MSEB/EXTN TO MSEB
0
0
0
0
0
0
29
ITI
0
0
0
0
0
0
30
EXTEN TO COEP
0
0
0
0
0
0
31
VM
0
0
0
0
0
0
32
TW
0
0
0
0
0
0
33
APMC
0
0
0
0
0
0
34
ON
0
0
0
0
0
0
35
MWO/CH/LIB
0
0
0
0
0
0
36
PC
0
0
0
0
0
0
37
CART STAND
0
0
0
0
0
0
38
BIRD SANCTURY
0
0
0
0
0
0
39
TE
0
0
0
0
0
0
40
CH&SC
0
0
0
0
0
0
41
TRUCK PARKING
0
0
0
0
0
0
42
EXTEN TO T M
0
0
0
0
0
0
43
STADIUM
0
0
0
0
0
0
44
RGY
0
0
0
0
0
0
45
TIMBER INDUSTRY
0
0
0
0
0
0
46
STEEL YARD
0
0
0
0
0
0
47
MUSEUM
0
0
0
0
0
0
48
PUBLIC HOUSING
2
27
1
0.5
1
26.5
TOTAL
114
202.11
34
26.95
80
175.16
NOTE: PARTLY DEVELOPED RESERVATIONS ARE CONTINUED WITH THE RESPECTIVE REMAINING AREA
NOTE: PARTLY DEVELOPED RESERVATIONS ARE CONTINUED WITH THE RESPECTIVE REMAINING AREA
NOTE: PARTLY DEVELOPED RESERVATIONS ARE CONTINUED WITH THE RESPECTIVE REMAINING AREA
NOTE: PARTLY DEVELOPED RESERVATIONS ARE CONTINUED WITH THE RESPECTIVE REMAINING AREA
NOTE: PARTLY DEVELOPED RESERVATIONS ARE CONTINUED WITH THE RESPECTIVE REMAINING AREA
NOTE: PARTLY DEVELOPED RESERVATIONS ARE CONTINUED WITH THE RESPECTIVE REMAINING AREA
NOTE: PARTLY DEVELOPED RESERVATIONS ARE CONTINUED WITH THE RESPECTIVE REMAINING AREA
NOTE: PARTLY DEVELOPED RESERVATIONS ARE CONTINUED WITH THE RESPECTIVE REMAINING AREA
Table No. 4-9
Table No. 4-9
Table No. 4-9
Table No. 4-9
Table No. 4-9
Table No. 4-9
Table No. 4-9
Table No. 4-9
Implementation of Reservations - SECTOR IV
Implementation of Reservations - SECTOR IV
Implementation of Reservations - SECTOR IV
Implementation of Reservations - SECTOR IV
Implementation of Reservations - SECTOR IV
Implementation of Reservations - SECTOR IV
Implementation of Reservations - SECTOR IV
Implementation of Reservations - SECTOR IV
TOTAL RESERVATIONS
TOTAL RESERVATIONS
FULLY DEVELOPED RESERVATIONS
FULLY DEVELOPED RESERVATIONS
NOT DEVELOPED RESERVATIONS
NOT DEVELOPED RESERVATIONS
Sr No
Reservations
No
Area
No
Area
No
Area
1
PS
12
6.34
5
2.09
7
4.25
2
HS
3
6.15
0
0
3
6.15
3
PS&HS
3
5.5
1
1.8
2
3.7
4
D/MH/H/HC/FPC
4
1.72
1
0.55
3
1.17
5
SC
4
0.675
2
0.3
2
0.375
6
CPG
10
2.61
2
0.36
8
2.25
7
PG
8
10.14
2
2.5
6
7.64
8
G
1
3.14
0
0
1
3.14
9
PARK
3
8.87
0
0
3
8.87
10
FB
1
0.48
0
0
1
0.48
11
P
3
1.06
1
0.375
2
0.685
12
PMPML
4
4.65
1
0.315
3
4.335
13
MK
0
0
0
0
0
0
14
MP
0
0
0
0
0
0
15
PO
2
2.6
0
0
2
2.6
16
PUMPING STATION
2
0.37
0
0
2
0.37
17
C-2
1
0.7
0
0
1
0.7
18
CC
1
3.885
0
0
1
3.885
19
EWS
3
35.15
0
0
3
35.15
20
HLW
0
0
0
0
0
0
21
BU&CR
1
1
0
0
1
1
22
AIR
0
0
0
0
0
0
23
DB
0
0
0
0
0
0
24
WH
0
0
0
0
0
0
25
CP
0
0
0
0
0
0
26
GOVT OFFICE
0
0
0
0
0
0
27
HDH
0
0
0
0
0
0
28
MSEB/EXTN TO MSEB
0
0
0
0
0
0
29
ITI
1
1.87
0
0
1
1.87
30
EXTEN TO COEP
1
1.8
0
0
1
1.8
31
VM
1
0.2
0
0
1
0.2
32
TW
1
2.185
1
2.185
0
0
33
APMC
0
0
0
0
0
0
34
ON
2
2.94
0
0
2
2.94
35
MWO/CH/LIB
1
0.42
0
0
1
0.42
36
PC
1
0.02
1
0.02
0
0
37
CART STAND
0
0
0
0
0
0
38
BIRD SANCTURY
0
0
0
0
0
0
39
TE
0
0
0
0
0
0
40
CH&SC
0
0
0
0
0
0
41
TRUCK PARKING
0
0
0
0
0
0
42
EXTEN TO T M
0
0
0
0
0
0
43
STADIUM
0
0
0
0
0
0
44
RGY
0
0
0
0
0
0
45
TIMBER INDUSTRY
0
0
0
0
0
0
46
STEEL YARD
0
0
0
0
0
0
47
MUSEUM
0
0
0
0
0
0
48
PUBLIC HOUSING
0
0
0
0
0
0
TOTAL
74
104.475
17
10.495
57
93.98
NOTE: PARTLY DEVELOPED RESERVATIONS ARE CONTINUED WITH THE RESPECTIVE REMAINING AREA
NOTE: PARTLY DEVELOPED RESERVATIONS ARE CONTINUED WITH THE RESPECTIVE REMAINING AREA
NOTE: PARTLY DEVELOPED RESERVATIONS ARE CONTINUED WITH THE RESPECTIVE REMAINING AREA
NOTE: PARTLY DEVELOPED RESERVATIONS ARE CONTINUED WITH THE RESPECTIVE REMAINING AREA
NOTE: PARTLY DEVELOPED RESERVATIONS ARE CONTINUED WITH THE RESPECTIVE REMAINING AREA
NOTE: PARTLY DEVELOPED RESERVATIONS ARE CONTINUED WITH THE RESPECTIVE REMAINING AREA
NOTE: PARTLY DEVELOPED RESERVATIONS ARE CONTINUED WITH THE RESPECTIVE REMAINING AREA
NOTE: PARTLY DEVELOPED RESERVATIONS ARE CONTINUED WITH THE RESPECTIVE REMAINING AREA
Table No. 4-10
Table No. 4-10
Table No. 4-10
Table No. 4-10
Table No. 4-10
Table No. 4-10
Table No. 4-10
Table No. 4-10
Implementation of Reservations - SECTOR V
Implementation of Reservations - SECTOR V
Implementation of Reservations - SECTOR V
Implementation of Reservations - SECTOR V
Implementation of Reservations - SECTOR V
Implementation of Reservations - SECTOR V
Implementation of Reservations - SECTOR V
Implementation of Reservations - SECTOR V
TOTAL RESERVATIONS
TOTAL RESERVATIONS
FULLY DEVELOPED RESERVATIONS
FULLY DEVELOPED RESERVATIONS
NOT DEVELOPED RESERVATIONS
NOT DEVELOPED RESERVATIONS
Sr No
Reservations
No
Area
No
Area
No
Area
1
PS
12
14.02
5
6.56
7
7.46
2
HS/HS&HE
4
11.65
2
1.27
2
10.38
3
PS&HS
0
0
0
0
0
0
4
D/MH/H/HC/FPC
6
2.68
2
0.38
4
2.3
5
SC
7
1.18
1
0.11
6
1.07
6
CPG
7
1.05
2
0.41
5
0.64
7
PG
9
9.03
2
2.01
7
7.02
8
G
5
8.9
1
1.76
4
7.14
9
PARK
2
7.8
1
3.66
1
4.14
10
FB
1
0.28
0
0
1
0.28
11
P
0
0
0
0
0
0
12
PMPML
2
1.46
0
0
2
1.46
13
MK
0
0
0
0
0
0
14
MP
0
0
0
0
0
0
15
PO
0
0
0
0
0
0
16
PUMPING STATION
2
0.47
0
0
2
0.47
17
C-2
0
0
0
0
0
0
18
CC
0
0
0
0
0
0
19
EWS
3
34.45
0
0
3
34.45
20
HLW
0
0
0
0
0
0
21
BU&CR
0
0
0
0
0
0
22
AIR
0
0
0
0
0
0
23
DB
0
0
0
0
0
0
24
WH
0
0
0
0
0
0
25
CP
0
0
0
0
0
0
26
GOVT OFFICE
0
0
0
0
0
0
27
HDH
0
0
0
0
0
0
28
MSEB/EXTN TO MSEB
0
0
0
0
0
0
29
ITI
0
0
0
0
0
0
30
EXTEN TO COEP
0
0
0
0
0
0
31
VM
0
0
0
0
0
0
32
TW
1
1.7
0
0
1
1.7
33
APMC
1
6.98
0
0
1
6.98
34
ON
0
0
0
0
0
0
35
MWO/CH/LIB
0
0
0
0
0
0
36
PC
1
0.6
0
0
1
0.6
37
CART STAND
0
0
0
0
0
0
38
BIRD SANCTURY
1
9.36
0
0
1
9.36
39
TE
1
0.23
0
0
1
0.23
40
CH&SC
1
0.59
0
0
1
0.59
41
TRUCK PARKING
0
0
0
0
0
0
42
EXTEN TO T M
0
0
0
0
0
0
43
STADIUM
0
0
0
0
0
0
44
RGY
0
0
0
0
0
0
45
TIMBER INDUSTRY
0
0
0
0
0
0
46
STEEL YARD
0
0
0
0
0
0
47
MUSEUM
0
0
0
0
0
0
48
PUBLIC HOUSING
0
0
0
0
0
0
TOTAL
66
112.43
16
16.16
50
96.27
NOTE: PARTLY DEVELOPED RESERVATIONS ARE CONTINUED WITH THE RESPECTIVE REMAINING AREA
NOTE: PARTLY DEVELOPED RESERVATIONS ARE CONTINUED WITH THE RESPECTIVE REMAINING AREA
NOTE: PARTLY DEVELOPED RESERVATIONS ARE CONTINUED WITH THE RESPECTIVE REMAINING AREA
NOTE: PARTLY DEVELOPED RESERVATIONS ARE CONTINUED WITH THE RESPECTIVE REMAINING AREA
NOTE: PARTLY DEVELOPED RESERVATIONS ARE CONTINUED WITH THE RESPECTIVE REMAINING AREA
NOTE: PARTLY DEVELOPED RESERVATIONS ARE CONTINUED WITH THE RESPECTIVE REMAINING AREA
NOTE: PARTLY DEVELOPED RESERVATIONS ARE CONTINUED WITH THE RESPECTIVE REMAINING AREA
NOTE: PARTLY DEVELOPED RESERVATIONS ARE CONTINUED WITH THE RESPECTIVE REMAINING AREA
Table No. 4-11
Table No. 4-11
Table No. 4-11
Table No. 4-11
Table No. 4-11
Table No. 4-11
Table No. 4-11
Table No. 4-11
Implementation of Reservations - SECTOR VI
Implementation of Reservations - SECTOR VI
Implementation of Reservations - SECTOR VI
Implementation of Reservations - SECTOR VI
Implementation of Reservations - SECTOR VI
Implementation of Reservations - SECTOR VI
Implementation of Reservations - SECTOR VI
Implementation of Reservations - SECTOR VI
TOTAL RESERVATIONS
TOTAL RESERVATIONS
FULLY DEVELOPED RESERVATIONS
FULLY DEVELOPED RESERVATIONS
NOT DEVELOPED RESERVATIONS
NOT DEVELOPED RESERVATIONS
Sr No
Reservations
No
Area
No
Area
No
Area
1
PS
15
8.89
1
0.84
14
5.76
2
HS
7
7.31
0
0
7
7.31
3
PS&HS
0
0
0
0
0
0
4
D/MH/H/HC/FPC
4
1.69
4
1.69
0
0
5
SC
12
5.15
4
2.1
8
3.05
6
CPG
4
2.29
0
0
4
1.65
7
PG
22
16.71
1
0.61
21
16.1
8
G
17
25.98
2
2.88
15
22.6
9
PARK
4
9.54
0
0
4
9.54
10
FB
1
1
0
0
1
1
11
P
6
1.29
1
0.113
5
1.1775
12
PMPML
3
4.33
0
0
3
4.33
13
MK
0
0
0
0
0
0
14
MP
0
0
0
0
0
0
15
PO
1
0.900
0
0
1
0.9
16
PUMPING STATION
1
0.22
0
0
1
0.22
17
C-2
0
0
0
0
0
0
18
CC
2
6.54
0
0
2
6.54
19
EWS
5
29.25
0
0
5
29.25
20
HLW
0
0
0
0
0
0
21
BU&CR
1
1.95
1
1.95
0
0
22
AIR
0
0
0
0
0
0
23
DB
0
0
0
0
0
0
24
WH
0
0
0
0
0
0
25
CP
0
0
0
0
0
0
26
GOVT OFFICE
0
0
0
0
0
0
27
HDH
0
0
0
0
0
0
28
MSEB/EXTN TO MSEB
0
0
0
0
0
0
29
ITI
1
3.11
0
0
1
3.11
30
EXTEN TO COEP
0
0
0
0
0
0
31
VM
0
0
0
0
0
0
32
TW
1
3.4
0
0
1
3.4
33
APMC
0
0
0
0
0
0
34
ON
0
0
0
0
0
0
35
MWO/CH/LIB
1
0.06
0
0
1
0.06
36
PC
0
0
0
0
0
0
37
CART STAND
1
0.8
0
0
1
0.8
38
BIRD SANCTURY
0
0
0
0
0
0
39
TE
0
0
0
0
0
0
40
CH&SC
0
0
0
0
0
0
41
TRUCK PARKING
0
0
0
0
0
0
42
EXTEN TO T M
0
0
0
0
0
0
43
STADIUM
0
0
0
0
0
0
44
RGY
0
0
0
0
0
0
45
TIMBER INDUSTRY
0
0
0
0
0
0
46
STEEL YARD
0
0
0
0
0
0
47
MUSEUM
0
0
0
0
0
0
48
PUBLIC HOUSING
0
0
0
0
0
0
TOTAL
109
134.75
14
10.18
95
123.082
Table No. 4-12
Table No. 4-12
Table No. 4-12
Table No. 4-12
Table No. 4-12
Table No. 4-12
Table No. 4-12
Table No. 4-12
Implementation of Reservations - SECTOR I TO VI
Implementation of Reservations - SECTOR I TO VI
Implementation of Reservations - SECTOR I TO VI
Implementation of Reservations - SECTOR I TO VI
Implementation of Reservations - SECTOR I TO VI
Implementation of Reservations - SECTOR I TO VI
Implementation of Reservations - SECTOR I TO VI
Implementation of Reservations - SECTOR I TO VI
TOTAL RESERVATIONS
TOTAL RESERVATIONS
FULLY DEVELOPED RESERVATIONS
FULLY DEVELOPED RESERVATIONS
NOT DEVELOPED RESERVATIONS
NOT DEVELOPED RESERVATIONS
Sr No
Reservations
No
Area
No
Area
No
Area
1
PS
101
62.19
32
18.96
69
43.23
2
HS
31
49.07
7
8.823
24
40.247
3
PS&HS
3
5.87
1
1.8
2
4.07
4
D/MH/H/HC/FPC
33
23.7
9
5.56
24
18.14
5
SC
51
12.825
20
5.64
31
7.185
6
CPG
72
18.67
14
3.79
58
14.88
7
PG
65
60.65
13
9.13
52
51.52
8
G
45
57.09
7
9.03
38
48.06
9
PARK
15
176.25
2
3.66
13
172.59
10
FB
8
5.345
0
0
8
5.345
11
P
35
13.39
9
2.4275
26
10.9625
12
PMPML
17
18.5
1
0.315
16
18.185
13
MK
3
0.55
0
0
3
0.55
14
MP
0
0
0
0
0
0
15
PO
8
3.8007
0
0
8
3.8007
16
PUMPING STATION
8
3.13
1
1.04
7
2.09
17
C-2
13
19.53
5
7.82
8
11.71
18
CC
6
29.135
0
0
6
29.135
19
EWS
23
210.28
4
35.85
19
174.43
20
HLW
1
0.4
0
0
1
0.4
21
BU&CR
4
10.36
1
1.95
3
8.41
22
AIR
1
1.42
1
1.42
0
0
23
DB
2
0.34
0
0
2
0.34
24
WH
1
0.02
0
0
1
0.02
25
CP
1
0.028
0
0
1
0.028
26
GOVT OFFICE
1
0.552
0
0
1
0.552
27
HDH
4
0.96
0
0
4
0.96
28
MSEB/EXTN TO MSEB
2
0.907
1
0.355
1
0.552
29
ITI
2
4.98
0
0
2
4.98
30
EXTEN TO COEP
1
1.8
0
0
1
1.8
31
VM
2
0.34
0
0
2
0.34
32
TW
3
7.285
1
2.185
2
5.1
33
APMC
3
20.96
1
12.78
2
8.18
34
ON
3
3.98
0
0
3
3.98
35
MWO/CH/LIB
2
0.48
0
0
2
0.48
36
PC
2
0.62
1
0.02
1
0.6
37
CART STAND
1
0.8
0
0
1
0.8
38
BIRD SANCTURY
1
9.36
0
0
1
9.36
39
TE
2
1.43
0
0
2
1.43
40
CH&SC
1
0.59
0
0
1
0.59
41
TRUCK PARKING
1
0.11
1
0.11
0
0
42
EXTEN TO T M
2
2.274
0
0
2
2.274
43
STADIUM
1
0.54
1
0.54
0
0
44
RGY
1
6.75
0
0
1
6.75
47
MUSEUM
1
0.281
0
0
1
0.281
48
PUBLIC HOUSING
2
27
1
0.5
1
26.5
TOTAL
587
936.06
134
133.71
453
802.36
NOTE: PARTLY DEVELOPED RESERVATIONS ARE CONTINUED WITH THE RESPECTIVE REMAINING AREA
NOTE: PARTLY DEVELOPED RESERVATIONS ARE CONTINUED WITH THE RESPECTIVE REMAINING AREA
NOTE: PARTLY DEVELOPED RESERVATIONS ARE CONTINUED WITH THE RESPECTIVE REMAINING AREA
NOTE: PARTLY DEVELOPED RESERVATIONS ARE CONTINUED WITH THE RESPECTIVE REMAINING AREA
NOTE: PARTLY DEVELOPED RESERVATIONS ARE CONTINUED WITH THE RESPECTIVE REMAINING AREA
NOTE: PARTLY DEVELOPED RESERVATIONS ARE CONTINUED WITH THE RESPECTIVE REMAINING AREA
NOTE: PARTLY DEVELOPED RESERVATIONS ARE CONTINUED WITH THE RESPECTIVE REMAINING AREA
NOTE: PARTLY DEVELOPED RESERVATIONS ARE CONTINUED WITH THE RESPECTIVE REMAINING AREA
Figure No 7-3 Pie diagram for Existing Landuse Sector-I.
Table No 7-4 EXISTING LANDUSE SURVEY DETAILS . SECTOR II
ZONE
%
ZONE
%
Agriculture(A)
0.16%
Residential(R)
25.25%
Commercial(C)
4.54%
Recreational Spaces(RS)
6.03%
Defence(D)
0.00%
Slum(SL)
4.87%
Hill slope(HL)
12.84%
Transport & Comm(TC)
1.15%
Industrial(I)
0.84%
Under Construction(UC)
0.41%
Mix Land use(ML)
6.12%
Vacant (VL)
6.37%
Public-Semi Public(PSP)
8.22%
Water bodies (WB)
4.55%
Public Utilities(PU)
1.83%
ROADS (RD)
16.83%
Figure No 7-4 Pie diagram for Existing Landuse Sector-II
Table No 7-5 EXISTING LANDUSE SURVEY DETAILS SECTOR III
ZONE
%
ZONE
%
Agriculture(A)
0.29%
Residential(R)
28.85%
Commercial(C)
2.45%
Recreational Spaces(RS)
2.99%
Defence(D)
2.63%
Slum(SL)
4.14%
Hill slope(HL)
18.26%
Transport & Comm(TC)
0.02%
Industrial(I)
1.36%
Under Construction(UC)
0.15%
Mix Land use(ML)
6.47%
Vacant (VL)
4.62%
Public-Semi Public(PSP)
9.04%
Water bodies (WB)
8.49%
Public Utilities(PU)
0.50%
ROADS (RD)
9.74%
Figure No 7-5 Pie diagram for Existing Landuse Sector-III
Table No 7-6 EXISTING LANDUSE SURVEY DETAILS . SECTOR IV
ZONE
%
ZONE
%
Agriculture(A)
0.20%
Residential(R)
21.42%
Commercial(C)
1.82%
Recreational Spaces(RS)
2.22%
Defence(D)
1.96%
Slum(SL)
3.08%
Hill slope(HL)
13.56%
Transport & Comm(TC)
0.02%
Industrial(I)
1.01%
Under Construction(UC)
0.11%
Mix Land use(ML)
4.80%
Vacant (VL)
3.43%
Public-Semi Public(PSP)
6.71%
Water bodies (WB)
6.31%
Public Utilities(PU)
0.37%
ROADS (RD)
32.97%
Figure No 7-6 Pie diagram for Existing Landuse Sector-IV
Table No 7-7 EXISTING LANDUSE SURVEY DETAILS . SECTOR V
ZONE
%
ZONE
%
Agriculture(A)
19.10%
Residential(R)
9.94%
Commercial(C)
1.56%
Recreational Spaces(RS)
3.45%
Defence(D)
30.55%
Slum(SL)
2.49%
Hill slope(HL)
0.32%
Transport & Comm(TC)
0.07%
Industrial(I)
0.69%
Under Construction(UC)
1.59%
Mix Land use(ML)
1.55%
Vacant (VL)
7.77%
Public-Semi Public(PSP)
12.65%
Water bodies (WB)
2.36%
Public Utilities(PU)
0.29%
ROADS (RD)
5.62%
Figure No 7-7 Pie diagram for Existing Landuse Sector-V
Table No 7-8 EXISTING LANDUSE SURVEY DETAILS . SECTOR VI
ZONE
%
ZONE
%
Agriculture(A)
5.44%
Residential(R)
20.78%
Commercial(C)
2.76%
Recreational Spaces(RS)
5.80%
Defence(D)
3.83%
Slum(SL)
1.93%
Hill slope(HL)
2.71%
Transport & Comm(TC)
3.32%
Industrial(I)
5.00%
Under Construction(UC)
0.14%
Mix Land use(ML)
2.99%
Vacant (VL)
11.63%
Public-Semi Public(PSP)
8.28%
Water bodies (WB)
11.16%
Public Utilities(PU)
2.30%
ROADS (RD)
11.92%
Figure No 7-8 Pie diagram for Existing Landuse Sector-VI
Table No 7-9 EXISTING LANDUSE SURVEY DETAILS . SECTORS I TO VI
ZONE
%
ZONE
%
Agriculture(A)
5.52%
Residential(R)
20.48%
Commercial(C)
2.54%
Recreational Spaces(RS)
3.89%
Defence(D)
8.41%
Slum(SL)
3.01%
Hill slope(HL)
8.38%
Transport & Comm(TC)
0.92%
Industrial(I)
1.82%
Under Construction(UC)
0.49%
Mix Land use(ML)
5.26%
Vacant (VL)
6.70%
Public-Semi Public(PSP)
9.19%
Water bodies (WB)
6.37%
Public Utilities(PU)
1.04%
ROADS (RD)
15.99%
Figure No 7-9 Pie diagram for Existing Landuse Sector-I – VI
The total area of the city has been worked out by the actual total station survey carried out on site, which is exactly as per city survey boundaries. A difference can be found between the area statement calculations in 1987 DP report and the actual calculations carried out now.
CHAPTER 8
Demographic Projections
1951
4.88
90.00 (+)
1961
6.07
24.00 (+)
1971
8.56
41.00 (+)
1981
12.03
41.00 (+)
1991
15.67
30.00 (+)
2001
25.38
62.00 (+)
2011
31.15
22.73
The population of the city in 1991 was 15.66 lakhs, 38 villages were added to the old PMC area in 1997. The population in 2001 was 25.38 lakhs. Natural growth and moderate amount of migration and territorial expansion were the main contributors for population growth. The population growth in 1991 was 30.2% and in 2001 was 62.0%.
The population of the old city in 2001 was 18,55,476. In the future, it is expected that the urban core population will actually decrease, while the growth rate of the suburban and urban fringe population will accelerate.
Female
73.5
75.0
75.5
76.0
76.5
Figure No. 8-2 Mortality pattern
8.2.1.3 Migration
Migration is the most crucial component for growth of any city. The nineties witnessed huge changes on the economic front on account of New economic Policies, which were reflected in the speedy expansion of the Information Technology sector. Initially, Hyderabad and Bangalore took the lead, but Pune has been moving rapidly in the last decade. Large-scale IT parks are mainly functioning at Hinjewadi, Talawade, Kharadi and Hadapsar.
Pune is growing with an expanding IT sector. It was observed that during 1981-91, there were 3.1 lakh in-migrants in the urban agglomeration, while during 1991-2001, the figure went up to 7.4 lakhs, amounting to about 13 to 20 percent of the total population. It was also observed that the proportion of intra-state migrants coming for employment was 32% for 1991-2001, while the same was 22% for 1981-91. Proportion of migrants coming for employment has risen significantly. Among others reasons, movement of family for work is prominent, accounting for 41% of the intra-state migrants. It is stated that during 1991-2001, 3.6 lakhs of migrants came to Pune City i.e @ 23% for the recent decade, taking into account the expansion of IT activities in Pune during last 7 years & the probable impact on migration.
Table No 8-4 Migration Projections
Year
2001-06
2006-11
2011-16
2016-21
2021-26
Migration %
12%
12%
10%
10%
8%
Figure No. 8-3 Projected Migration .
8.2.1.4 . Territorial expansion
Jurisdictional changes do contribute to the population growth. This factor had a noticeable contribution in growth during 1991-2001. In future also, jurisdictional changes in PMC limit are expected. In 1997, 38 villages were included in PMC. However, in the year 2001, 15 complete villages and 5 part villages were de-linked. It is possible that these villages may be merged in PMC, in next few years during 2012-17. The new townships developing along the periphery may also sooner or later be included in PMC limits.
Considering the major aspects of fertility, mortality and migration, the projection of population by Gokhale Institute with the help of software DEMPROJ is as follows:
Table No. 8-5 Projection of population by Gokhale Institute
Year
Population
Male
Female
2001
25,38,473
13,20,438
12,16,410
2007
31,48,041
16,42,049
15,05,992
2012
37,29,694
19,51,413
17,78,281
2017
44,55,574
23,40,923
21,14,651
2022
51,37,671
27,08,460
24,29,211
2027
57,14,890
30,20,329
26,94,561
8.2.1.5 Growth rate
Cities do not grow at the same higher rates for longer periods. Cities, such as Bangalore & Hyderabad which are comparable to Pune have also slowed down.
The annual growth rate % for Pune for the coming years is as follows:
Table No. 8-6 Growth rate Alternative I (high)
Year
Growth rate
1991-2001
4.82
2001-2007
3.6
2007-2012
3.39
2012-2017
3.99
2017-2022
3.23
2022-2027
2.95
Figure No. 8-4 Growth rate as per alternative I
Table No. 8-7 Growth rate Alternative II (realistic)
Year
Growth rate
1991-2001
4.82
2001-2007
3.6
2007-2012
3.39
2012-2017
3.56
2017-2022
2.85
2022-2027
2.13
Figure No. 8-5 Growth rate as per alternative II
8.2.1.6 AGE Distribution and SEX Ratio of Projected Population
Table No 8-8 Age distribution and sex-ratio of projected population for the Old City, 2002-27
2002
Total
Male
Female
2007
Total
Male
Female
0 - 9
327,953
170,525
157,428
0 - 9
370,675
194,341
176,334
10-19
371,383
194,477
176,906
10-19
366,999
189,681
177,318
20-29
393,659
206,834
186,825
20-29
416,262
223,962
192,300
30-39
308,174
158,293
149,881
30-39
368,156
190,248
177,908
40-49
219,245
114,940
104,305
40-49
265,038
137,584
127,454
50-59
138,451
73,023
65,428
50-59
176,575
91,571
85,004
60-69
87,374
41,871
45,503
60-69
100,166
49,105
51,061
70-79
42,515
20,460
22,055
70-79
60,312
26,835
33,477
80+
13,080
6,123
6,957
80+
14,060
6,335
7,725
Total
1,901,834
986,546
915,288
Total
2,138,243
1,109,662
1,028,581
2012
Total
Male
Female
2017
Total
Male
Female
0 - 9
393,855
207,377
186,479
0 - 9
392,131
207,808
184,321
10-19
368,126
192,654
175,473
10-19
426,172
224,946
201,225
20-29
426,996
226,796
200,202
20-29
445,572
235,320
210,252
30-39
437,398
229,606
207,791
30-39
473,720
254,016
219,703
40-49
311,517
161,054
150,463
40-49
374,170
194,784
179,384
50-59
211,847
109,945
101,902
50-59
257,821
132,445
125,376
60-69
127,617
64,307
63,309
60-69
164,537
81,369
83,168
70-79
74,337
32,510
41,827
70-79
89,519
39,925
49,593
80+
19,970
8,393
11,577
80+
26,840
10,620
16,220
Total
2,371,663
1,232,642
1,139,023
Total
2,650,482
1,381,233
1,269,242
2022
Total
Male
Female
0 - 9
412,077
218,887
193,190
10-19
470,597
249,782
220,815
20-29
476,465
255,815
220,651
30-39
511,402
271,143
240,258
40-49
447,947
237,269
210,677
50-59
304,802
156,205
148,597
60-69
199,819
98,983
100,835
70-79
118,029
53,962
64,066
80+
34,582
13,749
20,833
Total
2,975,720
1,555,795
1,419,922
2027
Total
Male
Female
0 - 9
448,493
238,693
209,799
10-19
490,623
262,284
228,338
20-29
563,991
305,308
258,683
30-39
554,197
292,573
261,623
40-49
488,987
264,838
224,150
50-59
367,890
190,042
177,848
60-69
245,535
120,548
124,987
70-79
152,408
68,654
83,754
80+
43,997
17,933
26,064
Total
3,356,121
1,760,873
1,595,246
Figure No 8-6. Age –Sex Ratio Year 2002
Figure No 8-7. Age –Sex Ratio Year 2017
Figure No 8-8 Age –Sex Ratio Year 2027
The broad indicators of the age pattern are as below
Table No 8-9 Age pattern Alternative I
2001
2007
2012
2017
2022
2027
Percentage 0-14 Age group
27.45
25.56
24.96
23.87
22.34
21.18
percentage 65+ Age group
4.85
5.89
6.42
7.13
7.70
8.27
median age in years
26
28
29
30
31
32
dependency ratio
0.48
0.46
0.46
0.45
0.43
0.42
Figure No 8-9 Age pattern alternative I
Table No. 8-10 Age pattern Alternative II
Table No. 8-10 Age pattern Alternative II
Table No. 8-10 Age pattern Alternative II
Table No. 8-10 Age pattern Alternative II
Table No. 8-10 Age pattern Alternative II
Table No. 8-10 Age pattern Alternative II
Table No. 8-10 Age pattern Alternative II
2001
2007
2012
2017
2022
2027
Percentage 0-14 age group
27.45
25.56
24.93
23.74
22
20.83
percentage 65+ age group
4.85
5.89
6.41
7.08
7.65
8.16
median age in years
26
28
29
30
31
33
Dependency ratio
0.46
0.46
0.46
0.45
0.43
0.41
Figure No. 8-10. Age pattern alternative II
Table No. 8-11 Net in-migration
Year
Net In-migration
1991-2001
3,66,983
2001-2007
3,64,263
2007-2012
3,61,488
2012-2017
3,74,930
2017-2022
4,26,304
2022-2027
4,09,413
Figure No. 8-11. Net-in-migration
8.2.1.7 Labour Force
The trend in the worker-rate (%) among males & females for 1961-2001 is as follows.
Table No 8-12 Trend in the worker-rate (%) among males & females
Year
1961
1971
1981
1991
2001
Male
47.06
47.44
47.42
48.03
48.81
Female
10.37
8.11
10.30
12.30
13.67
Figure No 8-12 Trends in worker-rate
Taking into consideration the past trend and the availability of the labour-force, the future trend is assumed.
Table No. 8-13 Future trend of labour force
Year
Male
Female
2007
49.20
14.60
2012
49.40
15.20
2017
49.60
16.00
2022
49.80
16.80
2027
50.00
17.80
Applying the above rates to the predicted population, we can get the expected number of male and female workers.
Table No. 8-15 Projected Growth Rate.
Year
Growth rate
1991-2001
4.82
2001-2007
3.6
2007-2012
3.39
2012-2017
3.56
2017-2022
2.85
2022-2027
2.13
Figure No 8-16. Projected Growth Rate.
190,042
177,848
60-69
245,535
120,548
124,987
70-79
152,408
68,654
83,754
80+
43,997
17,933
26,064
Total
3,356,121
1,760,873
1,595,246
Figure No. 8-19. Age and Sex distribution projection for 2027.
Population Projection for Sectors I to VI
Figure No. 8-20. Sectorwise distribution of wards
Figure No. 8-21. Sectorwise projected population.
Figure No. 8-23. Working & Non-working Population
The occupation of the primary sector is declining day by day within the Pune region. Noticeable increases is observed in the workers’ proportions in secondary and tertiary sectors. These are the areas where the Information Technology has entered directly or indirectly. Hospitality, Health, Banking & Insurance, Education are the areas with significant impact of IT. Significant employment growth in the large cities is likely to take place through a process of sub-contracting, using casual and self-employed workers.
According to the Environment Status Report 2008-2009, PMC, 3 percent of the city’s population is dependant directly or indirectly on agriculture, while 97 percent is dependant on other sources of income. About 23 percent of the working population is involved in the IT sector.
Note:
Primary sector: This sector is involved with gathering the raw materials from which everything else is made and includes in farming, mining, fishery, forestry, etc.
Secondary sector: The secondary sector includes industries related to processing the raw materials from the primary sector. In short, it deals with manufacturing.
Tertiary sector: The tertiary sector comprises of all the service industries like banking, insurance, medical, education, hospitality, trade and commerce, etc
Work is defined as participation in any economically productive activity with or without compensation, wages or profit. Such participation may be physical and/or mental in nature. Work involves not only actual work but also includes effective supervision and direction of work. It even includes part time help or unpaid work on farm, family enterprise or in any other economic activity.
Non-Worker is a person who did not work at all during the reference period.
8.9.1 The non-workers broadly constitute
Students who did not participate in any economic activity paid or unpaid, persons engaged in daily household chores like cooking, cleaning utensils, looking after children, fetching water etc., Persons not even helping in the unpaid work in the family cultivation or in family enterprise or mulching etc., dependent such as infants or very elderly people not included in the category of worker, Pensioners drawing pension after retirement and not engaged in any economic activity, beggars, vagrants, prostitutes and persons having unidentified source of income and with unspecified sources of subsistence not engaged in any economically productive work during the reference period, and other non-workers who may not come under the above categories such as renters, persons living on remittances, agricultural or non-agricultural royalty, interest or dividend; convicts in jail or inmates of penal, mental or charitable institutions doing no paid work and persons who were seeking/available for work.
STATEMENT NO 8-1
DEMOGRAPHIC PROJECTION GIVEN BY GIPE FOR REVISION OF DEVELOPMENT PLAN FOR OLD PMC LIMIT
Year
2001
2007
2012
2017
2022
2027
Population
1855476
2138243
2371663
2650482
2975720
3356121
Sector
%
Population
%
Population
%
Population
%
Population
%
Population
%
Population
I
16
296876
16
342119
16
379466
16
424077
15
446358
15
503418
II
25
463869
25
534561
23
545482
22
583106
20
595144
18
604102
III
19
352540
19
406266
18
426899
17
450582
16
476115
15
503418
IV
11
204102
11
235207
12
284600
12
318058
13
386844
14
469857
V
12
222657
12
256589
14
332033
16
424077
18
535630
19
637663
VI
17
315431
17
363501
17
403183
17
450582
18
535630
19
637663
Total
100
1855476
100
2138243
100
2371663
100
2650482
2975720
100
3356121
Chapter NO 9 Socio-economic Study
Sr. no.
Year
Population
Sector II
%
population
area in ha
Gross density
2001
as per 87 DP report
317211.00
1948
162.84
2001
1855476
25
463869.00
2007.22
231.10
2007
2138243
25
534560.75
2007.22
266.32
2012
2371663
23
545482.49
2007.22
271.76
2017
2650481
22
583105.82
2007.22
290.50
2022
2975718
20
595143.60
2007.22
296.50
2027
3356121
18
604101.78
2007.22
300.96
Sector III
Table No. 8-20. Projected population for sector III
Sr. no.
Year
Population
Sector III
%
population
area in ha
Gross density
2001
as per 87 DP report
250032
2278
109.76
2001
1855476
19
352540.4
2156
163.51
2007
2138243
19
406266.2
2156
188.43
2012
2371663
18
426899.3
2156
198.00
2017
2650481
17
450581.8
2156
208.98
2022
2975718
16
476114.9
2156
220.82
2027
3356121
15
503418.2
2156
233.48
Sector IV
Table No 8-21. Projected population for sector IV
Sr. no.
Year
Population
Sector IV
%
population
area in ha
Gross density
2001
as per 87 DP report
214923
2589
83.01
2001
1855476
11
204102.4
3154.18
64.71
2007
2138243
11
235206.7
3154.18
74.57
2012
2371663
12
284599.6
3154.18
90.23
2017
2650481
12
318057.7
3154.18
100.84
2022
2975718
13
386843.3
3154.18
122.64
2027
3356121
14
469856.9
3154.18
148.96
Sector V
Table No. 8-22. Projected population for sector V
Sr. no.
Year
Population
Sector V
%
populati on
area in ha
Gross density
2001
as per 87 DP report
202451
3060
66.16
2001
1855476
12
222657.1
3036.87
73.32
2007
2138243
12
256589.2
3036.87
84.49
2012
2371663
14
332032.8
3036.87
109.33
2017
2650481
16
424077
3036.87
139.64
2022
2975718
18
535629.2
3036.87
176.38
2027
3356121
19
637663
3036.87
209.97
Sector VI
Table No 8-23 Projected population for sector VI
Sr. no.
Year
Population
Sector VI
%
populati on
area in ha
Gross density
2001
as per 87 DP report
233028
3516
66.28
2001
1855476
17
315430.9
3516
95.17
2007
2138243
17
363501.3
3516
10338.49
2012
2371663
17
403182.7
3516
11467.09
2017
2650481
17
450581.8
3516
12815.18
2022
2975718
18
535629.2
3516
15234.05
2027
3356121
19
637663
3516
18136.03
118790
1961
606777
1901
153320
1971
856105
1911
158856
1981
1203351
1921
198523
1991
1566651
1931
198078
2001
2538473
The population of Pune during the last four decades grew at an average annual rate of over 3.4 % against the national average of 2.1 % and state average of about 3.3 %.
9.2.2 Density of population and average family size
The density of population in Pune city in the year 1951 was 18.29 persons per acre. The most densely populated areas were the central areas like Raviwar Peth, Rasta Peth and Nihal Peth where the density was almost 300 persons per acre. In the newly added areas such as Guruwar Peth, Budhwar Peth, Sukhrawar Peth, Ghorpadi, Gultekdi, Bopodi, etc, the per acre density was less than 11 persons per acre. The density of population according to the Census 2001 was 10412 per sq.km. Currently, the most densely populated wards in the city are Bhavani Peth followed by Kasba Peth and Vishrambaug Wada wards.
The city appears to be growing in the southeast and southwest directions. As per the 2005 population estimates, the Tilak Road ward on the southwest side of the city is experiencing a rapid growth of 50%. The Karve Road is also growing at a rate of 32%. In the southeast direction, the Bibwewadi ward with its proximity to the Solapur bypass is growing at a rate of 38 % followed by Hadapsar at 26 %.
In the year 1951, in about 82 percent families, the average family size was 5 members. Around 13 percent families had an average family size of 7-9 members and only 5 percent families had 10 members and above. This number has gone down to 4.5 members according to 2001 Census.
9.3 Economic Profile of Pune City
Pune is the eighth largest city in India; it has the sixth largest metropolitan economy and the second highest per capita income in India, with the least income disparity between the rich and poor. The economy of Pune city is one of the fastest growing in India. Pune ranks 7 t h in top 10 towns in India, with highest family income. It ranks 6 t h in top 10 wealthiest cities in India.
d) Pune as an auto-hub:
One of the first notable milestones in the industrial history of Pune was the entry of Kirloskar Oil Engine Ltd. In 1960, MIDC set up a huge industrial estate on 4000 acres of land at Bhosari. This development led to a large number of engineering-ancillary industries being set up in Pimpri-Chinchwad and the city started developing. Later, the city also witnessed the entry of auto majors such as Tata Motors, Bajaj Auto and the world's second largest forging company Bharat Forge Ltd. It is also home to Kinetic Engineering and Force Motors (previously known as Bajaj Tempo). Also, Daimler Chrysler has an assembly line for its Mercedes Benz brand in Pune. Cummins Engines Co Ltd has a Research & Technology India centre in Pune. The establishment of the commercial motor vehicle unit of Telco in Pimpri-Chinchwad transformed the pace and rhythm of Pune. Availability of skilled manpower and later, supply of ancillary development based entrepreneurs in and around Pune became the major drivers of Pune’s industrialization.
e) Pune as an Agro Business Centre:
Pune has also emerged as a business centre. The hinterland of Pune witnesses intense farming of sugar and grapes, horticulture, and floriculture. Given the distinctive characteristics of this industry, many value-added industries like food processing have flourished in and around Pune. Pune has a locational advantage, being close to several demand driven markets such as Mumbai, Nasik, Nagpur, and Aurangabad. Consequently, Pune is fast evolving as a sunrise city; already some big names in this sector have established their presence, namely Gits Food Products, Weikield Products, and Chitale Bandhu.
f) Pune as a tourism center
Pune City is not an exception to the phenomena of growth of a traditional city in to a prosperous Metropolis city which was ruled by many dynasties in past centuries.
Pune is the cultural capital of Maharashtra. The city is known for various cultural activities like classical music, spirituality, theater, sports, and literature. These activities and job opportunities attract migrants and students from all over India and abroad, which makes for a city of many communities and cultures. There are historical attractions in and around Pune include the rock-cut Pataleshwar cave temple, Aga Khan Palace, Shaniwarwada, Lal Mahal, Shinde Chhatri and Sinhagad fort. Prominent museums in Pune include the Raja Dinkar Kelkar Museum, Mahatma Phule Museum, Babasaheb Ambedkar Museum and the Pune Tribal Museum. Pune has a number of public gardens, such as the Kamala Nehru Park, Sambhaji Park, Shahu Udyan, Peshwe Park, Saras Baug, Empress Garden, Taljai Hills and Bund Garden. The Pune-Okayama Friendship Garden, now renamed Pu La Deshpande Udyan, is a replica of the Korakuen Garden in Okayama, Japan. The Rajiv Gandhi Zoological Park is located at Katraj,
Chapter NO. 10
Housing Study
1,615
Hotel, Lodge, Guest House
3,318
Hospital
3,603
Factory, Workshop
10,265
Place of Worship
2,935
Other non Residential
19,650
(Source : Household assets and amenities, H – Series tables, Census of India 2001)
Figure No. 10-1. Percentage Distribution Of Occupied Houses
10.2.3 Housing Typology
Pune consists of maximum number of slums as housing typology followed by Bungalows and Wada. Presently, the percentage of Bungalows and Wada is decreasing as these units are getting redeveloped into apartment units.
Figure No. 10-2. Housing typology
Housing distribution by tenancy
Figure No. 10-3. Ward wise distribution by tenancy (Source: MASHAL, Pune)
Table No. 10-3. House hold conditions
Sr No
Category
Census 2001
MASHAL Non Slum Slum
1
Good
358, 900
68.45%
60%(Pakka)
33% (Pakka)
2
Liveable
152, 923
29.17%
14%(SemiKaccha)
18%(SemiKaccha)
3
Dilapidated
12, 496
2.38%
26%(Kaccha)
49% (Kaccha)
4
Total
524, 319
100%
Figure No. 10-4. Type of Household
conditions
Table No.10-4. Household Tenure
Sr No
Category
Census 2001
MASHAL
1
Household by ownership
524, 319
100%
2
Own
351, 569
67.05%
67%
3
Rented
151, 414
28.88%
27%
4
Others
21, 336
4.07%
6%
Housing Distribution by Tenure: -
Figure No. 10-5. Housing Tenure.
10.3Housing Types in Pune
Like any other developing city, Pune has also got the diversified development in housing. Since Pune is a historical city, the traditional look is maintained in some parts of the city. About 40% population is the slum population in the city.
Figure No. 10.6 Housing systems Pune
(Source: MASHAL)
10.3.1 Traditional Housing
a) Wada/ Chawl
Wada/ Chawls symbolizes the tales of Pune's rich culture and heritage. They are historical symbols of Pune. They are famous for their typical architectural character and the traditional character. Wadas were used mainly for residential purpose. They were elaborately planned in which minute attention was paid to all functions and requirements of the women folk without compromising their privacy and security. Wadas are huge massive structures in which material used in construction is mainly stone, limestone and bricks. These are normally load bearing structures.
The age of structure, tenancy, lack of maintenance, legal litigations are some of the hurdles for development /redevelopment of wadas/chawls. There is a need of a new incentivised development policy for redevelopment of wadas/chawls.
9.3.2 Formal /Planned Housing
a) Private housing
There are many privately developed bungalows, societies in different parts of the city, like Matruchhaya society on Nagar road,Sindh Society at Aundh etc. Each Bungalow has an individual water tap connection as well as individual parking and other facilities.
b) Group housing
Some parts of the city have developed as group housing. Plots are developed by private developers for tenements more than 100 with recreational, parking and amenity facilities provided in the scheme itself.
c) Institutional Housing
There are many places owned by government / semi government organisations in the city,like the Research and development organization Kalas on Alandi road, Pashan, Aundh, National Chemical Laboratory Pashan, CID,Police dept etc. which have their offices as well as there residences in the same premises.
d) Public housing
The Pune Housing and Area Development Board, Pune is a regional unit of MHADA. It was established on 5th December 1977 as per the provisions of section 18 of the Maharashtra Housing and Area Development Act, 1976.
MHADA has completed 27 schemes, accommodating 16,909 MHADA households, agglomerating total area of 167.49 ha at Pune. Total 167.49 ha area of land is distributed over PMC, PCMC limit at Pune.
e) Townships
Pune is now coming up with many township projects under Maharashtra township policy 2005. This is resulting in an increase in housing stock of Pune by foreign direct investment through a subsidised way. But as this policy has certain constraints of having a consolidated land parcel of 100 acres, these townships are coming in the periphery of PMC or outside the PMC limit. Till date, around 25 townships are expected to come up in Pune, out of which six townships have already started taking shape in Pune.
f) Municipal Housing
Pune Municipal Corporation like other institutions has developed residential accomodations for their workmen mainly, the fourth class workmen. They have rented accommodation for other class of workmen termed as Municipal housing, in Hanuman nagar, Pandavnagar, ghorpade peth, wakdewadi, etc. PMC has also developed housing for EWS at Upper Indiranagar Bibvewadi and Dhankawadi.
10.3.3 Informal / unplanned housing
10.3.3.1 Slums
As per the census of 2001, a slum is defined as, ‘a compact area of at least 300 people in poorly built congested tenements surrounded by unhygienic environment, usually with inadequate infrastructure and lacking proper drinking water and sanitary facilities’
Under the Maharashtra slum improvement and clearance act 1971, a slum is loosely defined as a congested, unhygienic area or buildings that are public hazard. The act declares the Pune municipal corporation (PMC) as the administrative authority to implement projects under the Act, mainly the provision of basic services in slums. In order to provide these improvements, the PMC ‘declares’ an area as slum, which it thinks adheres most to the definition of the slum.
When a settlement is recognized by the local municipality as one where living conditions are below a specified standard, it is ‘declared’ under the Maharashtra Slum Improvement Act (1971) as ‘slum dwelling’
a) Problems and issues of Slums in Pune
The growth rate of slum population is higher than the growth rate of Pune city for the last decade.
Approximately 40% of Pune population resides in slums spread over 10% of the city area as per the data of 2009, thereby creating very high density development i.e. approx 1100 persons/ha. As per the projections of 2027,
more than 50% population will be residing in slums, if no adequate housing provisions are made.
There is adequate Housing supply by Government Agencies. Hence, improvement in scheme formulation and implementation is lacking. Increasing land values and construction cost has made housing unaffordable leading to increasing slums in the city.
Most of the slums have poor environmental conditions causing various health hazards, resulting in inefficiency in work due to poor health & lack of affordable health facilities. Haphazard layouts of the slums with narrow lanes makes it difficult to access these areas specially during calamity
b) Slums in Pune City
Slums are solutions found by urban poor for satisfying their housing needs. Urbanization and slums in Pune is going hand in hand. In Pune bigger the growth, higher is the proportion of people living in slums. This situation is mainly due to the fact that urbanization in Pune leads to mass migration of rural poor who have low skills and are not in position to meet their demand for formal housing from the given market.
Slum at Parvati
11.1Introduction
Increased level of urbanization has accompanied India’s rapid economic growth in the last two decades. Our cities, which are engines of economic growth, are under great strain to meet the growing demands and aspirations of their citizens. Recognizing the growing importance of improving efficiency in delivery of basic services in our city, this plan contains series of initiatives aimed at enabling PMC to meet the unprecedented challenges that the PMC is facing today.
In addition to ensure orderly development of the city by prescribing the proposed land uses and development control, a Development Plan also aims at creating an environment to enable the residents to enjoy the desirable standards of living conditions. The social amenities and the basic infrastructure facilities play an important role in this regard.
As per the departmental manual of Town planning department, a Development Plan should be implementable rather than idealistic. The Government has accordingly laid down certain norms or standards for various social amenities comprising of educational, health, recreational facilities, etc. in terms of area and the number of sites to be provided for the projected population of the next ten years, to be distributed among the different sectors in the planning area. In addition to this, provision of additional social amenities such as youth guidance center, spastic and handicapped centers also need to be made in the City.
10.4Housing Demand in Pune City.
Housing demand is a product of “Household formation” as a consequence of net population growth. Demand has two aspects “Absolute” and “Effective” Absolute demand is a physical phenomena of number of homeless households, while the “Effective demand” is a consequence of the Household affordability. While the Developers are primarily interested in latter, Policy makers cannot ignore former as they have to cater to the group that has no affordability.
It is the lack of attention to the former that leads to the growth of slums and housing shortage.
Table No. 10-7. Total housing demand by 2027 in Old PMC limit
Table No. 10-7. Total housing demand by 2027 in Old PMC limit
Table No. 10-7. Total housing demand by 2027 in Old PMC limit
Total no. of households in 2007
475165
Projected
No. of residential units in 2007
384884
Estimated
Total Numeric Shortage (HH) till 2007
90281
Calculated
Total number of Dilapidated houses
11309
Primary Survey, MASHAL
Total number of Kutchha houses
123543
Primary Survey, MASHAL
Up gradation need for slum (HH)
76026
40% slum removal till 2027
Total shortage up to 2007
301160
Projected population
3,356,121
(2027)1
Total housing need in 2027
734381
Estimated
Total housing stock up to 2007
384884
Estimated
Total housing required in 2007-2027
349497
Calculated
Total number of Dilapidated houses that are to be added during 2007-2027
8318
Estimated
Total housing need from 2007-2027
357815
Calculated
Total housing need in 2027 (Nos.)
658975
658975
(Source: MASHAL, Pune)
10.5Land Requirement for Projected Housing.
Based upon primary survey, future housing requirement for different housing group is studied by Mashal in housing study considering the projected population as given in Table above.
Table No.10-8. Housing requirement by income group
Income Group
% Distribution
HH units in Nos.
EWS
44.14
290873
LIG
20.03
132022
MIG
26.24
172977
HIG
9.58
63103
(Source: Primary Survey, MASHAL, Pune)
Table No.10-9. Housing requirement in different typology
Income Group
Plotted development in %
Group development in %
Total no. of Plotted Development
Total no. of Group development
EWS
10%
90%
29087
261786
LIG
15%
85%
19803
112218
MIG
25%
75%
43244
129733
HIG
40%
60%
25241
37862
(Source: MASHAL, Pune)
Table No.10-10. Land area required
I Gnrcooumpe
Total no. of
Area of Plot size ( p Pselqo fr.otm DtretUd.)
Net density c ho gondruso fisoduirneprge (DU/ha)
Area Required for
DevPellootptemdent
devGelroopumpent
DevPel (lohotapte)mdent
DevGe (lrhooapu)mpent
EWS
29087
261786
30
550
87.262
475.974
LIG
19803
112218
100
450
198.033
249.374
MIG
43244
129733
225
350
972.995
370.665
HIG
25241
37862
400
250
1009.65
151.447
TOTAL LAND AREA REQUIRED (ha)
2267.94
1247.46
(Source: MASHAL, Pune)
Therefore, net area required for housing is 3515.4 ha. Adding the total area required for amenities, gross residential area required to be reserved to cater to the future housing demand is 4745.79 ha.
This area will reduce down substantially with the implementation of new development policies introduced in the development control regulations like giving additional FSI for development of affordable housing of household size 30sqm, higher additional FSI particularly for EWS and LIG. Policies like, MHADA, policy for redevelopment of MHADA colonies and on vacant land will also contribute to affordable housing. Also, major land is made available by converting agriculture land to residential land. eg Sangamwadi, Pashan, Lohegoan, Mundhawa. The agricultural area & vacant pockets in the Pune old limit area will cater the need of this housing stock. Policies of densification along MRTS corridor i.e metro corridor is also proposed in development control regulations. There are also places where there will be redevelopment in existing properties due to old structures aged from 30 and above years and dilipalated structures. Additional housing stock shall be available with new policies of redevelopment. In addition to this TDR generated against proposed reservations/roads and premium FSI shall also contribute to fulfill the need of housing for the projected population
10.6Recommendations for housing
I. The stock of affordable housing can be enhanced by introduction of new policies such as increase in FSI particularly for the EWS group, like additional FSI for EWS, Slum redevelopment, MHADA policies etc.
II. Vision of slum free city can be achieved through implementation of Rajiv awas yojana, BSUP schemes, policies for Slum rehabilitation/redevelopment schemes through SRA rules and D.C. regulations.
III. Policies for providing rental housing need to be introduced taking into consideration the demand for the same.
IV. Cluster development for dilapilated wadas/chawls in the old parts of the city needs to be introduced.
V. Policies for promotion of Integrated development of townships, densification along MRTS corridors needs to be introduced.
VI. With an intention to make affordable housing available for the EWS/LIG group provision have been made regarding handing over 20% area in the form of 30 to 40 sqm and 10% area in form of 41 to 60 sqm for MIG tenements compulsory in layouts.
CHAPTER NO. 11
Social Amenities and Utility Services
11.3Amenities
The 1987 sanctioned Development Plan had made provisions of certain sites for different amenities. Some of these sites have been acquired and the facilities already made available. These sites have been considered along with the other existing facilities. Some of the sites have been excluded and the modified sites have been considered in their modified form in the Revised Draft Development Plan. It is seen that even the existing amenities together with the remaining sites earmarked in the 1987 sanctioned Development Plan would not provide all the amenities to the standards adopted for the Revised Draft Development Plan. As a result, some new sites for different amenities have been added in the Draft Development Plan.
The following statements give details of the amenities as provided in the Revised Draft Development Plan.
Annexure E shows in a nutshell, the amenities provided in the Revised Draft Development Plan.
The total provision is compared against the area requirement according to the Planning Standards and the resulting achievement of the Standards after all proposals are implemented, has been shown against each category of the amenities.
The existing amenity, the sites retained from the 1987 sanctioned Development Plan. The additional sites proposed with same purpose in the Revised Development Plan in each of the Sectors and the resulting amenity at the city level, have been added in the proposed land use.
11.3.1 Each of the sites reserved in the Revised Draft Development Plan has been distinctly shown on the proposed Land Use Plan with a red verge and with the purpose of the amenity and site number. Similarly those sites showing amenities/reservations of 1987 DP developed fully are shown in same colour with black verge, sites partly developed or developed under appendix R-7, are shown in same colour and in red verge. Also sites, which have been acquired as per 1987 DP but not developed, are shown in same colour and in red verge. Sites developed fully under Appendix R-7 have been shown in same colour with black verge so that in future, redevelopment may be allowed as per the existing user.
Reservation sites of 1987 DP continued and redesignated, which have been proposed in draft development plan have been given in STATEMENT No 11.1.
11.3.2 The amenities have been provided taking into consideration the prevailing practice observed in the city, as described below:
The 1987 sanctioned Development Plan had made provisions of certain sites for various amenities. While preparing revised development plan of 1987, some of these sites were continued. These sites have been considered along with the other existing facilities. Some of the sites have been excluded and the modified sites have been considered in their modified form in the Revised Draft Development Plan. It is seen that even the existing amenities together with the undeveloped sites of 1987, would not suffice the standards adopted for the Revised Draft Development Plan for the projected population in 2017. Some new sites for various amenities have therefore been added in the Revised Draft Development Plan.
11.2Planning for Sectors
The total planning area is divided into six sectors, as has already been described in the earlier chapter. Some of the pockets, which had been shown as agricultural zone in 1987 DP, have been considered for the micro planning. While preparing the micro-plan for these pockets, various sites have been reserved for the basic amenities meant for the citizens.
Some additional proposals have also been suggested in these sectors keeping in mind the projected population for the year 2017 based on approved planning standards. Due to scarcity of vacant land, fulfillment of the planning standards is difficult to achieve to its fullest.Taking into consideration the sector-wise population distribution, site conditions, proper spatial distribution of the amenities, their spread in the city, an honest attempt has been made to achieve the standards as far as possible
11.4Educational Facilities
11.4.1 Primary Schools:
As per section 63 of BPMC Act 1949, it is the obligatory duty of the Planning Authority to provide primary education to children.
However, primary schools are also run in Pune by the private institutions, which cater to about 60% of primary school going student. It is
observed that PMC run primary schools are the best options available to the children coming from poor families, slums, etc. It is utmost important that each school should have a playground of its own.
The sites for Primary schools have been so located that students will have to travel a distance of not more than 0.6 km or a travel time of not more than 10 to 12 min by walk. In 1987 sanctioned DP, Sites reserved for primary school were allowed to be developed by owner or institute. Now this provision has been continued by reservation of 10% of total seats for students belonging to economically backward class, as recommended by the Municipal Commissioner.
Sites acquired by PMC may be developed, by inviting tenders, from reputed institutions. In such cases, 30% of total seats shall be reserved for students belonging to economically backward class, as recommended by the Municipal Commissioner.
11.4.2 High Schools
It has been found that about 10% of the total population will avail the facility of high school. Since the 1987 sanctioned DP, several sites designated in the DP, as also on private plots have been developed. It has been proposed that sites reserved for high school shall be developed by PMC or, if PMC so wishes, by private institutes. In the latter case, proper tendering process shall be followed. For sites acquired by PMC and allowed to be developed by institutes, it shall be ensured that 30% of the total seats shall be reserved for students belonging to the economically backward class as recommended by the Municipal Commissioner. For sites developed by owners/private institutions (without PMC acquiring them), 10% of the total seats shall be reserved for students belonging to the economically backward class as recommended by the Municipal Commissioner.
There is cut throat competition in the field of education. This, coupled by the fact that both the parents are working, makes it difficult for them to devote time towards the studies of their children. This has resulted in the mushrooming of the coaching classes all over the city.
It is found that some of private coaching classes are run in residential area and many a times prove to be a nuisance to the neighborhood. Taking this into consideration, these uses shall permit the PMC to allow running of private coaching classes in the premises of schools run by both, the PMC and private institutions, after the school hours. In such cases, 15% of total intake shall be for students belonging to economically backward class, as suggested by the Municipal Commissioner.
11.4.3 Hostels
Pune city is known as the “Oxford of the east”. There are lots of students coming into the city for the education purposes. It is a fact that there are inadequate accommodation facilities for students in the education campus. In many housing colonies, students are not allowed to reside. Hence separate accommodation is needed.
To tackle this situation, any landowner may be allowed to develop his property wholly for hostel purpose with an additional FSI of one in lieu of premium, provided his property lies within 500m radius from the boundary of educational institute and the owner executes a Contract with the concerned educational institutions.
Minimum 10% rooms shall be kept reserved for students belonging to economically backward class/ LIG/socially backward class nominated by the Municipal commissioner. These rooms shall be made available free of charge.
11.4.4 Industrial Training Institute
There is only one industrial training Institute in Pune which is in Aundh area and Sholapur Road area. No new sites have been proposed.
11.6Recreational Facilities:
Creation of a sustainable physical and social environment for improving quality of life is one of the major objectives of the plan. The almost unprecedented scale and speed of urbanisation in Pune has resulted in enormous pressure on the physical environment with a severe adverse impact in terms of pollution. Today, Pune is considered to be among the most polluted cities in India. With a view to address these situations, it is necessary to reserve sites in sufficient numbers for Children’s Play-Ground, Play-Ground, Parks, and Gardens.
Sites for Children Playgrounds have been provided with easy access to small children within 5 to 10 minutes walking distance or 0.2 to 0.3 km. Number of suitable sites have been proposed, wherever possible, for this purpose.
The playgrounds should be well distributed suitably to make them available for maximum number of residents, with easy accessibility. The Playgrounds, which have been attached to the schools, would be restricted only to the school going children.
Parks provide recreation to the citizens who can enjoy the thematic eco-friendly environment and the scenic beauty of the area. Some of these sites have already been earmarked on large area of hills, and since this is a city level amenity, for obvious reasons, no standard of accessibility can be applied to such sites.
Gardens act as the major lung spaces for the city. Till date, 103 small and large gardens have been developed by PMC in the city and about 25 new gardens are likely to come up in the coming 3 years. Various theme gardens such as palm garden, bamboo garden, blind garden, moghul garden, nalla garden, Japanese garden, Spice garden, etc are being developed in the city. Taking into consideration the need of gardens as breathing spaces for the city,
few more gardens have been proposed in this revised development plan. New proposals like amusement parks, floriculture, Traffic Park, adventure sports parks, etc. are introduced in the revised development plan.
11.7Commercial Zone:
As per the aims and objectives defined earlier, in order to generate more employment in the city and to step up the work force ratio from 37% to 60%, an attempt has been made to motivate the tertiary sector by encouraging development in finance sector like banking, IT, service industries, hospitality etc. Commercial zone /district commercial zone is shown in the plan. The congested zone is the main commercial centre in the city. The commercial zones are identified and shown as C-1 zone in congested area and C-2 zone in non-congested zone. Laxmi Road has been earmarked as commercial zone and policies have been framed for the same.
11.9CIVIC & Cultural Centers:
The 1987 Development Plan had an adequate provision of civic and cultural centers. Some of the designated sites have already been developed. In the revised plan, the remaining sites have been continued and few more, newly designated. One site is designated for civic and cultural centre which can be developed as multi-drama theatres. This is a new concept on the line of multiplexes. On this site, four to five drama theatres of small and big
capacities will be constructed. This will be the cultural hub for amateur as well as professional dramas. Full-fledged activities for all age groups will be provided. Provision has been made in the Development Control Regulations for construction of multipurpose hall in educational campus, and the same is to be made available for rehearsal of dramas in halls of municipal school, after the school hours. In order to give opportunities to amateur artists to present their skills, small open stages will be allowed in large parks.
In the revised DP, provision for sites reserved may be allowed to be developed by the planning authority/owner or institute, is continued with modification.
11.10 Public & Semi Public Use:
Lands owned by Government or other public authorities or institutions, charitable trust and under existing use for some or the other public purpose have been zoned for public and semi-public use. Since these are not the reserved sites, a verge does not bind them.
It is desirable that the facilities available on such sites should be continued. Uses in this zone are specified in the Development control regulations.
11.12Utility Services
11.12.1 Crematoriums and burial grounds:
It has been observed, that the existing cremation or burial grounds are not conveniently located from some of the developed areas in the city. Additional sites have been reserved in order to make this facility available within a reasonable distance from all parts of the city. These sites have been shown on the Proposed Land Use Plan accordingly. (Karvenagar GB and Hadapsar 91 variation, katraj)
11.12.2 Dhobi Ghat:
Considering the need of dhobi ghats, site for the same have been reserved at different location in draft development plan.
11.11Other Facilities:
Under this category, sites for public purposes such as Municipal Purposes, telephones, posts, police chowky, old age homes, school for handicapped & spastics, public toilets, ward offices etc. have been included.
11.11.1 Parking places:
With the phenomenal increase in personalized motor vehicles, one of the major problems being faced today is an acute shortage of parking space. In the absence of adequate organized parking space and facilities, valuable road space is being used for vehicular parking.
Sites have been included under Traffic Transportation proposals and shown on the proposed Land Use Plan. Private owners are promoted to develop unreserved and unencumbered plots for parking within 200m from
Metro, Bus Depot, BRT stations, Railway stations, Existing Government organisations, important religious and tourist places or plots on the periphery of the congested area.
11.11.2 P.M.P.M.L, Interchange/Bus Terminus etc.
The sites reserved for the bus station terminals or depots, the sites for interchange associated with the proposed High Capacity Mass Transportation Route, interchange, truck terminus, vehicle depot and metro stations etc. have been included under the transportation proposals and shown on the Proposed Land Use Plan.
11.12.3Sewage Generation and Treatment Scenario in Pune City:
11.12.3.1 Sewage System:
At present there are sewage treatment plants located at Bhairoba,Tanajiwadi,Bopodi,Erandawane,Naidu,Vittalwadi,Mundhawa,Baner, Kharadi, Kalyaninagar,Vishrantwadi mental hospital etc.
Table No 11-1 : Existing Sewage Treatments Plants
Sr. No.
Location
Process
Capacity, MLD
1.
Bhairoba
Activated Sludge process followed by Anaerobic digestion
130
2.
Tanajiwadi
Bio-tower and extended aeration Process
17
3.
Bopodi
Extended aeration Process
18
4.
Erandwane
Activated Sludge process
50
5.
Naidu - I
Activated Sludge process followed by anaerobic digestion
90
Total
305
11.12.3.2 Collection & Conveyance System:
Conveyance Lines- For collection & conveyance of sewage generated in Pune City, Conveyance mains are laid for carrying sewage to various Sewage Treatment Plants. The total length of conveyance lines laid along the rivers & nallas is 300 Km. The total length of Sewer lines in the city is about 1900 kms. The Sewage Network covers about 95% of the developed area of the city.
The following table shows the phasing of the works that have been carried out:-
Table No 11-2 : JNNURM Funded- Sewage Treatment Plants
Sr. No.
Location
Process
Capacity, MLD
Remark
1.
Naidu - II
Activated Sludge process
115
Commissioned in April 2010
2.
Vittalwadi
Activated Sludge process
32
Commissioned in March 2009
3.
Mundhwa
Cyclic Activated Sludge Technology
45
Commissioned in March 2009
4.
Baner
Cyclic Activated Sludge Technology
30
Commissioned in Dec 2010
5.
Kharadi
Cyclic Activated Sludge Technology
40
Commissioned in Jan 2012
Total
262
Table No. 11-3: Recompilation Sheet
Table No. 11-3: Recompilation Sheet
Table No. 11-3: Recompilation Sheet
Sr. No.
Particulars
Estimated cost (lakhs)
I
Capital cost
A
Collection system and trunk mains
1
Collection system in Baner and Balewadi
1748.67
2
Trunk sewer and conveyance mains
7790.34
Total A
9539.01
B
Cost of STP
3
Masty Beej Kendra STP-8 MLD (MBR)
1038.32
4
Mundhwa STP - 45 MLD (SBR)
3789.16
5
Bhairoba STP - 70 MLD (SBR)
7429.06
6
Naidu STP - 125 MLD (SBR)
10800.6
7
Vadgoan STP - 20 MLD (ASP)
1960.44
8
Warje STP - 25 MLD (EA)
1521.69
9
Tanajiwadi STP - 19MLD (EA)
1118.61
10
Botanical Garden STP- 21 MLD (SBR)
2235.93
11
Dhanori - 36 MLD (ASP)
2956.56
12
Kharadi STP - 14 MLD (SBR)
1263.69
TOTAL B
34414.07
C
IPS (Intermediate Pumping Stations)
470.4
D
Land Acquisition
3151.08
E
Public Awareness and Public Participation
35.5
F
Capacity Building Cost
5.75
SUB TOTAL (A+B+C+D+E+F)
47615.8
G
Other
Preliminary Work (3%)
1428.47
Establishment and Supervision (6.75%)
3214.07
Special T & P (1%)
476.16
Audit and Account Charges (0.25%)
119.04
Contingency (3%)
1428.47
TOTAL G
6666.21
TOTAL (I)
54282.01
II
O&M COST FOR 5 YEARS
17223.4
TOTAL PROJECT COST (I+II)
71505.41
11.12.4Water Treatment & Supply Scenario in Pune City:
11.12.4.1 Introduction
Water Supply and Sewerage are the basic facilities, which serve as catalysts for organized development and add on to the economic importance of Pune city. With a progressive approach, PMC developed a Master Plan for Water Supply and Sewerage for the year 2025. The planning area considered was Pune Cantonment area, Khadki Cantonment area and 36 villages merged within PMC in September 1997.
Wadgoan Treatment plant
11.12.4.2 Existing Treatment, Transmission, Storage and Distribution Facilities Existing treatment plants
Table No. 11-4 : Existing treatment plants.
Table No. 11-4 : Existing treatment plants.
Table No. 11-4 : Existing treatment plants.
Sr. No.
Water Treatment Plants
Working at (MLD)
Table No. 11-4 : Existing treatment plants.
Table No. 11-4 : Existing treatment plants.
Table No. 11-4 : Existing treatment plants.
Sr. No.
Water Treatment Plants
Working at (MLD)
1
Cantonment
360
2
Parvati
535
3
New Warje
100+86
4
Wadgoan
125
5
Holkar Phase - I
40
6
Others [Warje , Wagholi and Holkar (old)]
60
Total
1306
The phase-wise implementation programme of water supply scheme is as given below:
Phase
Year
Water (MLD)
Phase I
2005
791
Phase II
2015
1047
Phase III
2025
1506
Table No 11-5 : Capacity of Water Treatment Plant
WTP
Phase wise- Additional Capacity
Cumulative Capacity
I
II
III
I
II
III
Parvati
..
..
..
534
534
534
Cantt
..
..
80
280
360
360
Warje
100
68
218
100
168
386
Holkar
40
..
40
66
66
106
Vadgaon
125
90
125
125
215
340
11.12.4.3 Extent of the Water Supply Area
The Pune Municipal Corporation limits till 1997 was only about 147 sq. km. Recently it has increased to 243 sq. km. due to the inclusion of 23 fringe villages. This was a major boost for the outgrowth of the city. Corporation presently supplies water to some of the fringe villages, Pune and Khadki cantonment area.
11.12.4.4 Sources of Water
11.12.4.4.1 Existing Sources:
Khadakwasla Dam is a live storage across river Mutha constructed in Mawal taluka of Pune district. This dam is located at a distance of 12 km from the project area of Pune. This is the existing source of water supply for Pune city since long period of time. This dam has replenishment from dams such as Panshet, Warasgaon and Temghar, which are located upstream of this dam. The Irrigation department has already granted a supply of 11.50 TMC water from this dam.
11.12.4.4.2 Distribution network: Approximate total distribution networks within the city – about 2400 Km., out of which, the approximate aging of pipe is as below:
Age > 40 years Length About: 750 km about 30%
Age 25- 40 years Length About: 625 km about 25%
Age 10- 25 years Length About: 625 km about 25%
Age 00- 10 years Length About: 500 km about 20%
There are 7 Water Treatment plants catering to the need of treated water for the city. Within the city, there are 53 Water Storage Reservoirs and 20 Pumping Stations. The PMC area has been divided into 48 distribution zones based on ESR, GSR and pumping stations. Total length of the Water Lines , which are functioning, is about 2400 km.
11.12.4.4.3 Master Planning
The master plan needs to be prepared considering immediate requirement for the year 2026 and design year 2041 as per JNNURM toolkit.
Master Plan shall be prepared considering following points;
1
Head work at
Present facility is sufficient for 2026 requirement and
2
Khadakwasla Transmission system for raw water
it requires augmentation for year 2041 with additional pipeline from Khadakwasla. The existing system requires augmentation to cater to 2041 demand of about 1300 MLD
3
Water Treatment facility:
Old treatment plant can be augmented or redeveloped. In addition to that, recirculation of the wash water may be considered.
4
The raw water transmission for feeding
Cantonment WTP (CWTP) need to be considered for the year 2041. Additional raw water line has been planned directly from the source up to CWTP.
5
Bhama Askhed Project
This needs to be supplemented by an additional source. This will surely help in reallocation of available water to other parts of the city from existing Khadakwasla source.
6
Remodeling of distribution system
The immediate improvement in existing distribution network for reduction of NRW to achieve equitable distribution along with the provision for distribution network to the recently merged villages. This requires rigorous distribution, modeling and amalgamation with the existing network after carrying out detailed distribution analysis, pressure monitoring and sufficiency analysis for year 2026 and year 2041.
11.12.4.5 Ground Water Survey
Study of the shallow groundwater regime in the Pune Municipal Corporation area is carried out by the Research and Development Cell of Groundwater Surveys and Development Agency, Water Supply and Sanitation Department Government of Maharastra. The detailed study like assessment of groundwater resources in urban watersheds, groundwater characteristics, groundwater as alternative source etc has been carried out.
11.12.4.5.1 Groundwater- an important alternative source
Groundwater continues to be an important constituent in supplying urban populations with sizeable quantities of drinking water and is an ‘unsung hero’ in large and small cities of India. The competing demands for water in different sectors are ever increasing and groundwater of suitable quality can substitute for surface water in this regard.
There is an ample scope in the present study area to encourage dual systems for use of raw groundwater and potable drinking water. Presently, treated potable pipe water is being used for all activities. Raw, untreated groundwater can be used for gardening, flushing toilets, bathing, washing and recreation. This will reduce the quantity of potable pipe water required for drinking and related commercial purposes, thereby saving on purchase, treatment and storage of potable water.
11.12.4.5.2 Potential Recharge zones
The study of hydrographs of typical unconfined phreatic aquifers from the study area also highlight the fact that recharge is primarily from the monsoon rains. Pattern of rise and fall of water levels is directly related to the amount and duration of precipitation, seasonal fluctuation and water abstraction for different water uses.
11.12.4.5.3 Roof top Rainwater Harvesting
Rainwater harvesting is a deliberate collection of rainwater within the catchment for the purpose of drinking, irrigation, etc. Collection and storage of
rainwater can be made in manmade structures or natural depressions in the catchments. Catchment includes rocky surfaces, hill slopes, and rooftops or artificially prepared impervious or semi-pervious land surface. Storage is generally done in man-made tanks, lined pits and small dams or in the sand beds of seasonal rivers. The collection and storage generally begins and ends with the rainy season. Users are left with a fixed volume of water until the next rainy season comes. Thus the amount of water harvested (collected and stored) depends on the frequency and intensity of rainfall, the catchment characteristics, amount of water need and capacity of the storage tanks.
11.12.6Implementation of Biomethanation-cum-Power Generation Plants in Pune
Hadapsar plant
Mundhwa plant
Pune Municipal Corporation is the first Municipal Corporation in India, to implement the decentralized MSW treatment plants. The number of projects under various stages of implementation is as follows;
Table No. 11-6 : Municipal Solid Waste Management plants and capacity.
Sr No.
Name of Ward Office
Sector
Capacity (TPD)
Output
1
Kasba - Vishram
1
1X5 Tonnes/day
Electricity & Manure
2
Dhankawadi
2
2X5 Tonnes/day
Electricity & Manure
3
Bibvewadi
2
1X5 Tonnes/day
Electricity & Manure
4
Karve Rd.
3
1X5 Tonnes/day
Electricity & Manure
5
Ghole Rd.
3
1X3 Tonnes/day
Electricity & Manure
6
Aundh
4
1X5 Tonnes/day
Electricity & Manure
7
Yerawada
5
1X5 Tonnes/day
Electricity & Manure
8
Hadapsar
6
2X5 Tonnes/day
Electricity & Manure
9
Hadapsar
6
1X2 Tonnes/day
Electricity & Manure
11.12.7 POWER SCENARIO IN THE CITY
A city like Pune which is growing or expanding very fast, needs energy for its development. Energy is needed for residential, commercial, industrial fields and other fields.
11.12.7.1 Pune – Facts and Figures
Total Consumers (HT + LT)
:
16, 70,042
HT Consumers
:
2,628
LT Consumers
:
16, 67,414
Residential Consumers
:
12, 76,555
Commercial Consumers
:
1, 61,035
Agricultural Consumers
:
1, 61,598
Metered
:
46,094
Un-metered
:
1, 22, 504
Others
ST Light
:
7,750
Power Loom
:
53
PWW (U)
:
74
PWW (R)
:
2,326
Poultry
:
2,389
Pune Electric Supply Company , a private company was formed after taking the permit under the Electricity Act of 1910
Oil driven units for producing electricity were installed at Rasta Peth Power House
• This company was nationalised and taken over by the MSEB in 1964
Basically, MSEB was formed only for the management of the Grid, but for different reasons, the nationalisation of more than 100 permitholding companies was done by MSEB.
Power Shortage in Maharashtra is about 6000 M.W, Losses and Non-recovery of charges is very high
In Pune Zone, losses amount to about 39 %
11.12.7.2 Pune Model
Initiative taken by the Industrialists
Electricity generation by using Oil driven units
• Compensation for power shortage
42 Paise per unit is the additional charge borne by the citizens for this initiative
House-hold Consumers using less than 300 units are exempted from this additional charge
Even though the percentage of losses in Pune is less as compared to the other cities and towns, Puneites have to pay extra charge in addition to the 42 paise, on account of cross-subsidization.
The demand of electrical energy for Pune city is as follows.
Year
Electrical demand in Million Units (MUs)
2007-08
4700
2008-09
4980
2009-10
5295
(Source :- Samarth Pune 2020)
The overall no of users in the city are as follows:-
Table No. 11-7 : Overall electricity users
Residential User
Commercial User
Industrial User
Other Users
Total
Consumer Nos.
1138720
165496
25227
11573
1341016
Percentage of total
85%
12%
2%
1%
100%
Source: ESR, 2009-10
Figure No. 11-1 : No. of Consumers of electricity uses
The following table gives details regarding the % of the total energy consumption in the city:
Table No. 11-8 : Total energy consumption.
Industrial
Residential
Commercial
Public work
Street light
Total
% of total energy consumption
42%
32%
21%
4%
1%
100%
11.12.7.3 Use of Non-Conventional Energy
Pune city is taking the lead in demonstrating the applications of solar energy for its various activities, such as for heating water.
Taking advantage of the various schemes and subsidies provided by MNRE/ MEDA, the residential, commercial, and industrial sectors are using solar energy on a large scale.
To promote the usage of non-conventional energy among the housing projects, the municipal corporation has introduced ―eco-housing projects.
11.12.7.4 Future Requirement of power
Present Requirement of Pune is 700 MW
Projected requirement of Pune in 2020 is 2500 MW
The above figures indicate that the energy requirement is likely to increase by more than three times in the next decade.
11.12.7.5 Initiatives undertaken by Pune Municipal Corporation for energy management
In light of the energy crisis in Maharashtra, Pune Municipal Corporation is trying to enhance the energy efficiency. To achieve energy conservation, basically energy audit and implementation of the energy saving projects suggested in audit report is necessary. Pune Municipal Corporation has prepared an action plan for the same.
11.12.7.5.1 The Electrical department of PMC is working on street lights, garden lighting, various art galleries, Auditoriums, illumination of various buildings & crematoriums. The average yearly electrical consumption is as follows:
For street lights
33.81 mwh / year
For garden lights
1.05 mwh / year
For Building lights
3.67 mwh / year
For water supply and drainage
189.70 mwh / year
Since Pune city is expanding, the street light requirement is also increasing. PMC’s electrical department has concentrated on energy management for street lights. In 2007-08, number of energy meters was 1430 & in 2009-10 the number has increased to 1578.This means that on an average, there is an increase of 150 no. of meters. 1500 KW load has increased in the last 2 years.
11.12.7.5.2 Provisions in Development Control Regulations
(A) Provision of solar panels on roof tops has been made mandatory for all constructions in the city. Concessions are offered in the property tax.
(B) Eco housing program has been launched by PMC. The provisions include steps to reduce energy usage by the use of energy saving fittings, fixtures and lighting system. Developers are encouraged to adopt the eco housing program and are incentivised based on the performance of their project.
(C) Provisions have been included in the development control regulations making it mandatory for all residential and commercial schemes having an area more than one acre to provide LED fittings and fixtures in all internal common areas such as staircase, passage, parking etc. within the buildings and solar fittings & fixtures in external areas such as on streets
11.12.7.3.2 An Energy Park has been established in Peshave Park in co-ordination with MEDA which is meant to explain to the general public, the nuances of renewable energy, its importance on the backdrop of the depleting resources and the pollution associated with them.
11.12.7.5.3 An energy park of a different type has been proposed on Ram Tekadi hill in Hadapsar, where non-conventional energy will be produced.
11.12.5Solid Waste Management
11.12.5.1 Existing solid waste management practices in Pune.
Municipal Solid Waste Management (MSWM) has been a crucial issue while planning a growing city like Pune. Municipal Solid Waste generation in Pune is among the highest in Indian cities with an average 0.450 kg per person per day of waste being generated. Currently, about 1200-1300 metric tonnes solid waste is generated per day. The source-wise broad composition of solid waste generated in the city is Commercial 25%, Market Area 5%, Hotels & Restaurants 25%, Vegetable Market 5% and Household 40%. Organic and bio-degradable portion of solid waste is about 50% and therefore can contribute significantly in solid waste management.
Out of the total solid waste generated i.e. 1200 to 1300 MT/day, about 50% contains the bio-degradable solid waste and remaining is non-recyclable waste. Out of total 650 MT of bio-degradable waste, 50 MT is treated in Biomethanation plants, about 400 MT is segregated and treated at Urali Devachi and about 200 MT biodegradable wastes is treated at Hadapsar Industrial Estate No. I using vermin-composting on a plot, admeasuring 4 Acres. On this same plot, the work of erecting another vermin-composting plant of 100 MT is in progress and will be commissioned shortly. Out of this, 50% about waste is of non-recyclable waste and this is treated at Urali Devachi by adopting Residual Derived Fuel technology and plastic pallatisation technology.
11.12.5.2 Various methods of solid waste management are
1. Biomethanation-cum-Power Generation Plants
The major portion of urban solid wastes is the organic fraction (@ 50%) which can be easily treated by anaerobic digestion. Apart from this, the solid wet waste generated in urban areas from vegetable markets, hotels, hostels, community/individual kitchen wastes etc. are best suited for this process due to the presence of high moisture and organic fractions (up to 90%).This biogas can then be used as a source of renewable energy to produce electricity. The solid residue, which remains after bio-methanation process, can be separated and utilized as manure.
2. Vermiculture treatment
Solid waste can also be treated by providing vermicuture pits in the building premises.The solid waste, mainly the wet waste is collected daily from households and stored in pits provided as per week days, which is further treated and converted into compost /manure.
12.2Urban Morphology:
The ward Bhamburda i.e. present Shivajinagar rose to importance in the post 1911 period.Water supply to the town was brought from the Katraj reservoir built in 1750. Parvati Lake was built in l755 at the southwest corner of the town by Balaji Bajirao as a feeder to the Katraj reservoir. Ambil Odha stream was dammed and diverted (with sluices provided in the dam) to fill the lake from the floods of the stream. In 1782, the city was provided with drainage. For the City's water supply, two more reservoir were built- one in 1778 by Sardar Raste at Kondhawa and another in 1790 by Nana Phadanawis at Narhe Ambegaon to the south of Pune.
12.1Existing Situation
Pune City is not an exception to the phenomena of growth of a traditional city in to a prosperous Metropolis city, which was ruled by many dynasties in past centuries. The earliest evidence found in copper plates of 758 A.D. and of 768 A.D. reveals that the Rashtrakootas ruled this region then. At that time, Pune was referred to as Punaka Vishya and Punya Vishaya. Copper plates of 960 A.D. refer to it as Punaka Wadi and Punaka Desha. Here Vishaya means region. The Pune Gazetteer explains the term Pune as Punya – a holy place. In Hindu tradition, confluence of two rivers is sacred. Hence, this city where there is a confluence of two rivers is Punyanagari.
12.4Projects supporting Economic Development, Culture, Heritage and City beautification
While PMC doesn’t have a direct role to play in the economic development of the city or the region, it proposes to play a proactive role in facilitating and supporting the same through identified projects, from time to time. While the infrastructure development initiatives are in this direction, other initiatives like; revitalisation of the old city by decongesting the core area through relocation of specific economic infrastructure like markets, wholesale and trade centers etc to appropriate locations on the periphery, have been proposed. PMC proposes to lend a helping hand to the heritage of the city through various initiatives so as to aid the tourism activities in the city.
These initiatives include development of heritage walks and restoration works on heritage sites etc. The details are presented below.
Heritage list for Grade I, II & III updated from time to time by heritage committee PMC.
Documentation of heritage structure like photograph, models, videos, microfilming etc.
Through a joint venture between Deccan College (Archaeological dept.) and PMC, a Heritage Park is proposed to be developed.
In the first phase, the Heritage Structures of Vishrambaug wada, Nanawada, Kasba ganpati and Mahatma Phule wada have been identified for restoration and beautification through DPDC funds.
A Heritage Walk as a guided tour is proposed to be developed covering Shaniwarwada, Lal Mahal, Nanawada, Kasba Ganapati, Muzumdar wada, Tambat Alli, Shitolewada, Mahatma Phule Mandai, Vishrambaug, Tulsibaug and Belbaug.
At identified locations like Pashan Lake, Peshwabaug and Katraj Lake, display areas are proposed to be developed for display of paintings by amateur artists.
12.3Urban Elements:
Diverse activity pattern in the historic area has given rise to different types of Urban Elements. These elements have typologies that have evolved over several generations. The various urban elements existing in the historic area are: Wada, Bazaars, Temples, Alis, Ghats, and Caves.
Major Historical Places in the City
Shaniwar Wada
Nana Wada
Kasba Ganpati Mandir and Kasba Peth
Mahatma Phule Mandai
Vishrambaug wada
Belbaug Mandir
12.5Heritage Walk
The Pune Municipal Corporation has prepared a list of heritage properties that need to be preserved and conserved. With the help of Central Government, the P.M.C. has been successful in the conservation and preservation of Shaniwar wada and the adjoining surroundings along with Vishrambag Wada, Nanawada, Kasba Ganpati Mandir and Mahatma Phule Mandai. If the construction of roads, railing and street light arrangement is done in resemblance with the historical heritage properties, it will attract a lot of tourists that come to Pune to see these Historical places.
In respect of the above points, P.M.C. has prepared a project named “HERITAGE WALK”. The motive of this particular project is to preserve and conserve the old monument in the congested area and attract tourist. This project will help the tourists and visitors to view the old historical places in city by taking a walk along the Heritage path. To view these historical monuments, a walking way namely “HERITAGE WALK” has been finalized in this project.
The tourists, visitors and the citizens will be given information regarding the historical, traditional and cultural importance of Pune. The project “HERITAGE WALK” consists of site-seeing of historical monuments like Shaniwarwada, Tambat Ali. Kasba Ganpati Mandir, Lal Mahal, Nanawada, Nagar Vachan Mandir, Bhide Wada, Mahatma Phule Mandai, Vishrambgwada, Tulshibag, Belbag, Amruteshwar Mandir. Before quoting an appropriate budget for this project and to start its implementation, it is necessary to prepare detailed master plan and to undertake a detailed analysis.
12.6Tourism in Pune City:
12.6.1 Introduction:
Tourism can be defined as travel undertaken for recreational, leisure or business purposes. The World Tourism Organization defines tourists as people who "travel to and stay in places outside their usual environment for more than twenty-four hours and not more than one consecutive year for leisure, business and other purposes not related to the exercise of an activity remunerated from within the place visited. Tourism has become a popular global leisure activity.
Tourism sector has contributed to the economic growth of Pune city. Factors related to Tourism are industrialization, education, higher number of qualified professionals, opening up of foreign markets, liberal trade policies and better advertising, cultural activities and strategic marketing.
The above factors have been collectively responsible for boosting Pune city’s economic reserves and the impact of economic growth on tourism is increasingly being felt in specialty sectors like spiritual tourism, spa tourism, student/senior citizen or family vacation plan segments in tourism as well as adventure tourism, Medical Tourism, Sports Tourism etc. Better amenities and modernization of roads, infrastructure in hotels, local lodging options, accreditation of genuine travel operators and guides etc., training being imparted by government and private sector individuals interested in developing specific regions for tourism promotion and encouraging global gains, will surely boost tourism in city.
12.6.2 Recommendations and scope in Tourism for Pune city:
Cultural and Heritage Tourism, Eco-Tourism, Medical tourism, Educational tourism, Sports tourism.
CHAPTER NO. 13
Traffic and Transportation Plan for the Pune City
13.2National Urban Transport Policy Framework:
The National Urban Transport Policy (NUTP) is formulated to transform the current urban transport system into a safe, convenient and efficient transportation system across all urban areas in India. It is necessary to ensure that the various urban transport projects that are being developed by the cities are NUTP compliant i.e they focus on mobility of people rather than vehicles and accordingly give priority to pedestrians, non-motorized transport (NMT), all modes of public transport and IPT.”
The objective of the National Urban Transport Policy is to ensure safe, affordable, quick, comfortable, reliable and sustainable access for the growing number of city residents to jobs, education, recreation and such other needs within the city.
The objectives of NUTP can be approached through a affirmative approach that would revolve around the following issues:
1. Pedestrian Facilities and pathways
Non Motorized Vehicles
Priority to the use of public transport
Integrating landuse and transport planning
Integrated public transit system
Parking
Freight Traffic
Capacity building
Pollution Reduction etc.
This chapter attempts to present the evolution of the Development Plan for Pune City within the NUTP Framework.
13.1Introduction:
Traffic & Transportation is the lifeline of city metabolism. Transportation Planning is an integral part of development planning. Pune city is an important urban center in Maharashtra and a rapidly growing metropolis of the country. The metropolitan area of Pune extends over 2100 sq. km. The Pune Metropolitan Area (PMA) consists of Pune Municipal Corporation (PMC), the Pimpri -Chinchwad Municipal Corporation (PCMC), Cantonment Boards of Pune and Kirkee and some villages. The total length of road network in PMC area is about 2250 Km, out of which 243km roads were proposed as DP roads in 1987 Development Plan. Out of these, about 166 km i.e 68% roads have been developed.
13.3Present Scenario in the City:
As per 2011 census of Pune, this city is a home to 31,15,454 people.
Pune has about 21 lakhs vehicles in the city. (source ESR 2011 PMC ) The city has experienced a steep enormous population growth due to inward migration of both skilled and unskilled labour on account of rising industrial activity and service sector.
For the last two decades, Pune has registered a steep growth in the number of public-private vehicles. But the road infrastructure and the utilities have not expanded commensurate with the increase in number of vehicles.
The City manifests all the problems of a metropolis like-
Increase in traffic congestion, speed reduction, environmental pollution and degradation in the quality of life.
Urban congestion due to unprecedented growth in motorized vehicles which is further aggravated by the interstate truck movement that cuts through the Pune City
Existing public bus service falls short while catering to rising demand.
Central City is experiencing capacity gaps, parking problems, lowspeed travel, congestion and urban decay
Road safety problems are on the rise due to lack of footway and safe crossing facilities, encroachments, bottlenecks and stressful travel etc.
One thing which will have greatest influence on urban life all over the world in next 100 years is CAR.
a. 1900 – 100,000 cars in the world
b. 1950 – 50 millions cars in the world
c. 2000 – 500 million cars in the world
d. 2050 – Likely to exceed 1000 million
Finding Balance between Car, other motorized transport and Pedestrians in the city poses a serious challenge before the city planners.
i. Lack of traffic management.
ii. Delay in development of integrated road and rail terminals are increasing pressure on roads
iii. Lack of development of full cross section of roads.
To address these issues and concerns and to efficiently cater the increased traveling demand, an imminent need to formulate a “Comprehensive Traffic and Transportation Plan for the Pune City” was recognized and the plan was accordingly prepared by the PMC.
This plan recognizes the synergy between landuse, transport and urban economy to improve urban transport through balanced development strategies.
13.4Challenges and Opportunities in Pune Urban Transport
Transport demand has increased substantially, due to increase in population as a result of the natural increase in population and migration from rural areas and smaller towns. Availability of motorized transport, increase in household income, and increase in commercial and industrial activities have further added to the transport demand. Pune City‟s economy and transportation has continued to evolve since the last development plan. Some of the key challenges are as follows:
13.4.1 Growth :
Pune has been experiencing tremendous growth, and is fast transforming into one urban complex. In 1997, 38 fringe villages were merged in the Pune city limits.Further in 2001, 15 entire villages and 5 part villages were delinked from the city limits. DP for the next 20 years was exclusively prepared for these 23 fringe villages (valid till 2021). The total population in the PMR region considered in Traffic & Transportation Policies and Strategies in Urban Areas in India by Ministry of Urban Development & WSA is 42 lakhs (2007). The projected population of the PMR is 11.41 millions by 2031. ( Source: CMP 2008 ). Some of the upcoming employment and industrial centres have emerged beyond the PMR boundary. While the existing roads that emanate from close to core area may be developed as radial arterials, clear ring roads are not available in the transport network of Pune.Another challenge for Pune is to organise its landuse pattern.
13.4.2 Socio Economics :
The influx of IT sector has resulted in change in the life style preferences. Incomes are increasing and homes and workplaces are becoming more spread out from the core area. Each month 10,000 – 13,000 new vehicles are registered (a rate of over 400 to 500 per day). Inadequate public transportation system has resulted in people finding it more convenient to use the private vehicles. The number of vehicles in the city is increasing at an alarming rate. Number of vehicle in the city is more than 20.91 lakhs. Every month about 12000 to 15000 new vehicles are registered (Source: Traffic & Transportation Policies and Strategies in Urban Areas in India by Ministry of Urban Development & WSA )
Figure No. 13-1 : Vehicles registered in Pune
Table No. 13-1 : Number of registered vehicles in Pune 2001- 2011
Year
2001
2002
2003
2004
2005
2006
Total
967960
977113
10,50000
1166309
1192489
1317368
Year
2007
2008
2009
2010
2011
Total
1538787
1662730
17,50,000
19,00,000
21,00,000
(Source:- ESR PMC-2011. )
As a result of the tremendous increase in the number of personal vehicles, the city is facing growing vehicular traffic on the roads.
13.4.3 Pubic Transit :
Public transport systems have not been able to keep pace with the rapid and substantial increases in demand over the past few decades. Bus services in particular have deteriorated and their relative output has been further reduced as passengers have turned to personalised modes and intermediate public transport (such as three-wheelers and taxis), adding to traffic congestion which has had its impact on bus operations. The existing bus fleet/lakh population is 30 .(Source CMP report 2008), where as the norm is 40.
13.4.4 Non Motorized Transport:
Pune is known for its use of bicycles. Over the recent years, the use of bicycles has come down significantly due to the rise in motorized vehicles. Due to the significant slum population and student population, there is still a significant continued usage of bicycles in Pune. Walking and cycling constitute approximately 33-35% of the total trips in Pune.(Source CMP report 2008) It is important that initiatives need to be taken to not only preserve but to enhance the share and safety of the NMT.
13.4.5 Funding:
Recent advances in technology, such as Intelligent Transportation Systems, electronic toll collection, smart-card technologies etc., have introduced new ways of improving the system efficiencies as well as new ways of funding strategies. It is evident that a persistent funding gap exists for city transportation needs and therefore it is imperative that Pune City needs to embrace new funding and financing strategies that support the Mobility Plan. Further the JNNURM provides an opportunity to seek assistance for city funding needs.
Working to achieve such a vision would make transportation more multimodal, efficient, and economic and will aid in linking the investment decisions in a better way, to achieve the goals set for Pune city.
13.5.1Traffic and Transportation Plan for Pune Metropolitan Area- 2001 by department of Town Planning, Maharashtra, 1984
A comprehensive Traffic and Transportation Plan for Pune Metropolitan Area 2001 was prepared in the year 1984.Various surveys and studies were carried out to establish the characteristics of the existing traffic and the ability of the different parts of the existing transportation network and systems to accommodate the traffic. Based on the studies carried out and the proposals framed, the following recommendations were made :
Development of an independent cycle network.
Development of a High Capacity Mass Transportation Route (HCMTR), with essential facilities for interchange between road and rail
Development of areas along the river banks and nallahs.
Priority for bus transport system with necessary infrastructure facilities to augment the road based mass transportation services and their coordination with the rail based system.
Development of additional terminal facilities on the rail system.
Improvement of intersections to achieve level segregation of pedestrians and slow moving vehicles from fast vehicles.
Improvement of Sight Distance.
13.5Brief Review of Earlier Traffic and Transportation Studies:
To improve the traffic and transportation situation of the Pune region, the traffic authorities of Pune have carried out feasibility studies from time to time and implemented the recommended measures to a great extent. The major transportation studies carried out for Pune region include :
Cycle Network Project for Pune, Town Planning Dept., Pune, 1981
Traffic and Transportation Plan for Pune Metropolitan Area-2001 by Dept. of Town Planning Maharashtra, 1984.
Traffic and Transportation Flows for Selected Cities in India by CRRI,1986
Transport in Pune Metropolitan Region by CRRI,1987
High Capacity Mass Transit System for Pune : Feasibility Study by MTP(Railways),1988
Report of the Pune Action Plan, 1991
Deshmukh Committee Report for Long Term Measures for Pune Agglomeration, 1994
Report of the Committee appointed by Divisional Commissioner, Pune Division, Pune to recommend “short Term Measures for Improvement of Traffic in Pune City” 1994
Pune Traffic 2000 „Parking‟, 1996
Project Report : Mega City of Pune, 1997
Feasibility Report on Construction of Flyover, Traffic Planning Cell, Pune,1998
Mass Rapid Transit System for Pune Metropolitan Area by RITES,1998
Sharing of Inter-City Services Operated by PMC & PCMC, CITR,2000
Final Report on “Study on the Working of Pune Municipal Transport” CIRT, 2000
A study on Traffic and Economic Analysis of Road Improvement Project in Pune by CIRT, 2001
Comprehensive Traffic and Transportation Study for Pune City, Span Travers Morgan, 2003
Comprehensive Mobility Plan by PMC in consultation with IL&FS and Wilber Smith Associates.
Brief details on some of the major studies are presented in the following sections:-
11.8Fire Brigade Stations:
To enable the firefighting squad to speed off from the stations in different directions within the shortest possible time, adequate number of sites for Fire-Brigade stations have been provided in different parts of the city at suitable locations. The facility has been provided, as required as per the standards, i.e. 1 station for 2 lakh populations within 3 km radius. In addition to the existing sites, few more sites have been designated in the proposed Land Use Plan. In the revised DP, provision of development of sites reserved for fire brigade by the owner, has been continued on the lines of the provision in 1987 DP.
13.5.2Traffic and Transportation flows for Selected Cities in India,CRRI,1986:
The objectives of the study were to carry out limited traffic and transportation flow studies on corridors of selected cities in India and analyze flows to bring out salient features. For Pune city, the road corridors identified were Satara Road, Yervada Bridge, Karve Road and kennedy Road (R.B. Motilal Road) Some of the salient observations are :
Cycles and two-wheelers together constitute 60% of total vehicles
The corridors displayed distinct peaking characteristics
Buses carried nearly 60% of the total passengers followed by Cycles (16%) and Two-Wheelers(8%) respectively.
Transport in Pune Metropolitan Region by CIRT,1987
After conducting the necessary surveys, the following improvement measures were recommended :
Urban transport improvement directions
Road improvement aspects
Bus route planning for PMT (Mass Transport)
Emphasis on merging PMT and PCMT
Segregation of pedestrian and cycle movement
11.5Health Facilities
As per section 63 of BPMC Act 1949, it is the obligatory duty of the Planning Authority to provide primary health facilities.
Dispensaries and maternity homes have been considered under health facilities. It is important to note that private institutions play a big role in providing health facilities to the general public. Taking this into consideration, the health facilities to be catered by the planning authority have been considered for 50% of the population. Thereby, it has been ensured that the sites for dispensaries (run by private institute or PMC) shall be available to the people within an influence zone of radius of 0.6 km to 0.8 km. The same, for maternity home and hospital shall be about 1.6 km.
The sites reserved for hospital and maternity home may be allowed to be developed by private owners/institutions. Due to scarcity of urban land to provide citizens with medical facilities, additional FSI will be given to such institutions by charging premium. Sites reserved for hospital and maternity home may be acquired by planning authority, which may be allowed to be developed, by the planning authority or by private institutions. In latter case, development shall be done by inviting tenders. In cases where sites for hospitals are developed by owner/private institutes, free medical treatment to the extent of at least 10% of the total number of beds, of the additional FSI shall be given to persons from economically weaker sections of society or to persons below the poverty line, referred by Municipal Commissioner. In addition, 10% of the total number of patients in OPD shall be provided treatment at concessional rates i.e. rates that are being charged in Government hospitals.
If any Owner/Charitable Institute proposes to develop a hospital on an unreserved plot, he/it may be allowed to do so with a maximum FSI of 4.0 and on conditions mentioned above.
Note: In cases where no additional FSI in lieu of premium is proposed by owner/institute, the condition of free medical treatment to the extent of at least 10% of the total number of beds and concessional rates to 10% of the total number of patients in OPD, shall not be applicable.
In cases of severe trauma, it becomes a priority to transport patients suffering from severe trauma as fast as possible to specialists, most often found at a hospital trauma center, for definitive treatment. In emergency medicine, the golden hour refers to a time period lasting from a few minutes to several hours following traumatic injury being sustained by a casualty, during
which there is the highest likelihood that prompt medical treatment will prevent death. Giving consideration for such worst situations, sites have been reserved for trauma hospitals along highways passing through city limit or major spine road, carrying high traffic volume.
13.5.3Feasibility Study of High Capacity Mass Transit System, MTP (Railways), 1988
In the Traffic and Transportation Plan for Pune Metropolitan Area-2001 prepared by Dept. of Town Planning. Maharashtra, a high capacity mass transit corridor was identified. PMC has carried out the feasibility study through MTP (Railways) in order to confirm the suitability of the alignment and take steps to freeze the required land. The principal recommendations outlined in the study were :
A more comprehensive study should be carried out for deciding on the best High Capacity Mass Transportation System (HCMTS) route and
connected network taking into account influence of the industrial development in the Pimpri-Chinchwad and Hadapsar area.
Since the high capacity system will be required on the modified route, steps will have to be taken for finalizing the alignment.
The land should be reserved or preferably acquired at this stage itself
Detailed cost-benefit analysis and cost-effective analysis of the alternative system will have to be carried out on the suggested corridor.
As a medium term solution, the possibility of providing a Magnetic levitation (Mag-Lev) link, across the core area may be gone into.
13.5.4Mass Rapid Transit System for Pune Metropolitan Area by RITES, 1998 (RAIL INDIA TECHNICAL AND ENGINEERING SERVICES)
The objective of this study was to examine the feasibility of a High Capacity Mass Transport System for Pune Metropolitan Area (BOOT)basis.
The recommendations of the study were as follows:
MRT network of approximately 85.92 km. length consisting of 6 Lines have been proposed and their commissioning was proposed in 3 phases. In each phase, 3 lines have been included. A joint venture company owned by PMC and PCMC named Pune Mass Rapid Transit Authority be incorporated with the responsibility of implementation of the project and operation of the system.
Enact enabling legislation empowering Pune MRT Authority in the matter of carriage of the commuters by Pune MRTS.
Land identified for Line (1) and (2) to be reserved immediately and action to acquire the land be initiated.
MSEDCL be approached for firm commitment to supply power at the requisite points.
Identify the cross-subsidy schemes to make the project financially viable so that private capital can be attracted.
Initiate action for administrative approval of various concessions to be made applicable for this project.
Initiate action to pre-qualify the parties / firms so that private sector participation can be expendited.
Table No.13-2 : Reco
mmended MRT Network
Length(Km.)
Proposed Year of commissioning
Line 1 : Agricultural College - TELCO
12.54
2002
Line 2 : Agricultural College - Warje
10.10
2006
Line 3 : Karve Road-Swargate-Hadapsar
11.56
2011
Line 4 : Agricultural College - TELCO
22.84
2016
Line 5 : Agricultural College - Loni Road
16.11
2021
Line 6 : Agricultural College - Chinchwad
12.76
2021
Total
85.91
(Source : Mass Rapid Transit System for Pune Metropolitan area by RITES, 1998)
Table No.13-3 : Traffic Speeds (Km/hr.) on Major Roads
Table No.13-3 : Traffic Speeds (Km/hr.) on Major Roads
Table No.13-3 : Traffic Speeds (Km/hr.) on Major Roads
Table No.13-3 : Traffic Speeds (Km/hr.) on Major Roads
Table No.13-3 : Traffic Speeds (Km/hr.) on Major Roads
Table No.13-3 : Traffic Speeds (Km/hr.) on Major Roads
Section/Road
Section/Road
Morning Peak
Morning Peak
Evening Peak
Evening Peak
Up
Down
Up
Down
1
Maldhakka-Lakshmi Road (JL Nehru)
15
16
19
23
2
Lakshmi Road - 7 Loves (JL Nehru)
18
21
18
18
3
7 Loves - Jedhe Chowk (shankarsheth)
24
20
14
15
4
Dengale Bridge - Sambhaji Park
23-26
25-28
12-21
4-23
5
Sambhaji Park - Sambhaji Bridge
4-17
3-24
4-20
3-4
6
Aundh - Sancheti Bridge
28-36
29-50
8-38
20-24
7
Sancheti- ZP Pune RS
18-30
11-24
11-20
10-33
8
Pune RS - ROB
26-43
32-43
32-60
20-52
9
Alka - Swargate (Tilak)
5-23
4-18
5-22
5-15
10
Fergusson College Road
22-60
23-58
33-64
30-57
11
Tilak Road - Shivaji Bridge
19-35
21-32
14-23
18-20
12
Lal Bahadur Shastri- Bypass (Singhgad)
20
19
17
16
13
PCMC Buld. TELCO Road
25-36
22-40
24-37
23-40
14
Chapekar Chowk - Bypass
5
6
5
4
15
Bypass - Hinjewadi
5
6
5
4
16
Wanawadi -Kondhva
51
19
25
26
(Source : Mass Rapid Transit System for Pune Metropolitan area by RITES, 1998)
Table No. 13-4 : Critical Peak Hour Volume and V/C Ratios on Major Roads
Table No. 13-4 : Critical Peak Hour Volume and V/C Ratios on Major Roads
Table No. 13-4 : Critical Peak Hour Volume and V/C Ratios on Major Roads
Table No. 13-4 : Critical Peak Hour Volume and V/C Ratios on Major Roads
Table No. 13-4 : Critical Peak Hour Volume and V/C Ratios on Major Roads
Sr.No.
Road Name
Location
Critical Peak hour Volume
V/C Ratio
1
Band Garden
Holiday Inn
5399
0.77
2
J.L.Nehru
Timber market
5002
1.67
3
Shankarsheth
Poornima Towers
4063
1.35
4
Laxmi Road
Pune Central Restt.
3765
1.79
5
J.L.Nehru
Kabir Chowk
3043
2.54
6
Z.P.Chowk-Pune RS
Vaishali hotel
7022
2.42
7
Motilal
Pune Railway station
4120
2.06
8
Shivaji
Pahdgate Police Station
6656
3.70
9
Bajirao
Telephone Exchange
6062
3.37
10
Tilak
Kaka Sweet
4741
2.63
11
Fergusson College
Hotel Sheetal
3897
2.17
12
Karve
Nal Stop
11089
3.7
13
Law College (Chiplunkar)
Law College Road
4240
2.36
14
Bhosari-Krishna Nagar
S B Chowk
3420
1.14
15
RTO Bridge
RTO Bridge
3917
2.18
16
Motilal
Sangam Bridge
3577
1.19
17
Dengale Bridge
Dengale Bridge
4938
2.74
18
Shivaji Bridge
Shivaji Bridge
6126
3.40
19
Shinde Bridge
Shinde Bridge
6241
2.60
20
Saras Baug
Patil Plaza
(Source : Mass Rapid Transit System for Pune Metropolitan area by RITES, 1998)
13.5.5A Study on Traffic and Economic Analysis of Road Improvement Project Pune by CIRT,2001
The objectives of the study were to analyse the existing traffic scenario, to identify the traffic problems and suggest alternative strategies for solving traffic problems, study and evaluate the feasibility of road improvement project, to carry out economic analysis, study the Environmental Impact Assessment of road improvement projects, identify the location of pedestrian subways on major corridors, provide technical standards for various roads, review and suggest schemes to improve traffic situation in the city etc.
Table No. 13-5 : Recommendations of CIRT Study
Sr.No.
CIRT's Recommendations
I
Katraj Kondhwa-Hadapsar Saswad Road should be given high priority The inner ring road is proposed to continue from Wagholi to Lohegaon, Lohegaon to Nirgudi and Nigudi to Charoli‟The outer ring road connecting Loni-Kand to Wadhu Kud and further continuing to Phulgaon, Tulapur and ending at Charoli BK New links have been proposed from Hinjewadi to Rahatne and Kiwale to Dehu Road.
II
In the absence of detailed data on the proposed ROB locations, no specific analysis has been carried out. But the average delay at the proposed ROB location was 25 minutes which will accumulate substantial amount oftime. Considering this point of view, the proposed ROB may be justified.
III
Based on the traffic analysis and guidelines of IRC on Warrants for Flyovers, CIRT has recommended flyovers in stages. Sr. No. 1 to 5 by year 2001 and Jangli Maharaj Road Junction near Modern Café by year 2001.At other locations, flyovers would be required after long time only.
In addition to above, CIRT had recommended pedestrian subways at the following locations. However, CIRT recommended further detailed survey for the feasibility of the subway at these locations.
Bibvewadi
Near Lakshmi Road
Wagholi
Near Wanwadi
Law College Road
Near Mental Hospital
Dapodi
10.Deccan College, Yerwada
Paud Phata
11.Pune Station
Near Mental Hospital Road
13.5.6Traffic Study for Pune City by AAKAR Enterprises, 2003
To provide efficient traffic management system in Pune city, government of Maharashtra, through MSRDC has decided to undertake construction of various flyovers, bridges, ROBS, widening of roads etc. A separate project has been formulated namely “Integrated Road Development Program in Pune Metropolitan Region”. Government of Maharashtra has sanctioned this project at an estimated cost of Rs. 250 crores. The main objective of carrying out traffic surveys and analysis was to assess toll revenue and toll plaza locations. M/s AAKAR Enterprises has been appointed as consultants for carrying out Traffic surveys and analysis.
Classified traffic volume surveys were carried out at 7 major locations, which are the entry points to Pune city and traffic survey locations are baner, Kiwale, Nigadi, Warje, Chandani chowk, Wakad Chowk and Dange Chowk. The survey were carried out for 3 days in the months of February and March, 2003.
For assessing travel characteristics, vehicle registration Number Plate Surveys were carried out at seven locations namely, Dehu Naka, Warje Chowk. These locations are same as those locations for which the traffic volume count survey was carried out. These surveys were carried out for 2 days in the months of February and March, 2003. In addition, survey was also carried out at Nigadi Octrai Post for one day.
Summary of AADT traffic at all the traffic survey locations are presented in Table No 13-6.
13.5.7Major findings of the study are briefly summarized below:
Approximately 42,500 vehicles are entering / leaving the Pune city through the seven survey locations.
Jeeps/Vans constitute about 38.1% and cars constitute about 15.5% Freight traffic i.e. LCV and Trucks constitute about 25.5%
The directional distribution of traffic varies from 58% to 52% which can be treated as almost 50% :50%
Large variation has been observed in Peak hour traffic expressed in percent of AADT and the range is 4.5% to 12%
Increase in car/ jeep traffic during weekend compared to weekday is almost double.
Truck traffic during weekend compared to weekday is lower by 10%
LCV traffic on Saturday is higher by 10%, on Sunday lower by 40% as compared to week day.
The total AADT on Dehu Road is around 11,980 vehicles and this traffic is the highest among all the traffic survey locations.
The estimated total toll from the seven locations is approximately Rs. 4.86 laks/ days.
TABLE NO 13-6. AVERAGE ANNUAL DAILY TRAFFIC (AADT) OBSERVED AT MAJOR ENTRY LOCATIONS OF PUNE CITY
Sr.No
Location
Cars
Jeeps/Vans (Loc)
Jeeps/Vans (PVT)
Six Seated
Auto
LCV
Bus ST
Bus Others
Trucks
MAV
Tractors
Total
1
Dehu
3055
0
1780
625
308
1257
781
795
2724
649
5
11980
2
Baner
2849
19
837
26
97
206
84
127
224
3
1
4473
3
Kiwale-Rawatgaon
30
3
11
1
13
7
0
0
86
1
1
152
4
Dehu-Kiwale Wasti
8
0
8
1
28
5
0
2
25
1
3
81
5
Chandini Chowk
215
502
5863
112
432
529
295
297
479
6
2
8731
6
Wakad Chowk
163
238
3224
102
250
601
102
412
776
15
18
5901
7
Dange Chowk
102
218
2051
474
457
824
12
228
1356
54
18
5796
8
Warje Chowk
157
223
2444
93
706
423
622
152
590
22
12
5445
Total
6579
1203
16218
1434
2291
3852
1896
2013
6260
751
60
42557
13.5.8Comprehensive Traffic and Transportation Study for Pune City 2002
The study was initiated by Pune Municipal Corporation (PMC) and M/s Span Travers Morgan Consultants have been appointed as consultants for the study.
The main objectives of the study were to match the demand and supply in terms of the existing and proposed infrastructure system control and management with optimal utilization of existing infrastructure. The study included the estimation of the existing traffic situation and demand to identify package and develop projects so as to arrive at an action plan which shall primarily lay a thrust on low cost and short term solutions, in addition to outlining the medium and long term measures for safe and efficient traffic and transportation system.
13.5.5.9 Reconnaissance Survey
Reconnaissance survey of the study area (PCMC and PMC) has been made by the Consultants with the following objectives :
To understand the existing condition of road network in terms of road width and capacity encroachments, bottlenecks, adjoining land use, traffic condition importance of various links in the network
To study the feasibility for improving and upgrading the network
Assessing the extent of primary traffic survey to be carried out
Preparing site appreciation report and befitting methodology for the proposed scope of work
The ensuing sections will describe the quantum and methodology proposed to undertake various suryeys.
13.5.10Comprehensive Mobility Plan for Pune City 2008
In order to ensure that the various urban transport projects that are being developed by the cities are NUTP compliant, the ministry has in March 2007 circular indicated that a “Comprehensive Mobility Plan (CMP) be prepared that focuses on mobility of people rather
than vehicles and accordingly give priority to pedestrians, Non-Motorized Transport (NMT), all modes of public transport and IPT.” Comprehensive Mobility Plan was prepared by Pune Municipal Corporation in 2008 in consultation with IL&FS and Wilber Smith Associates.
The Comprehensive City Mobility Plan addresses traffic growth for all modes of transportation and suggests a direction for the multi-modal transport system of Pune. The CMP will improve and emphasize Sustainable Transport Modes.
13.5.10.1 The objectives of this Study are
To understand present day traffic characteristics and prepare forecasts of these characteristics through the development of a transportation model.
To develop a transportation vision for Pune.
To identify specific strategies and measures to address traffic growth for all modes of transportation in an effort to meet the set goals.
Prepare a programe of CMP implementations along with block cost estimates.
13.5.10.2 A methodology for the Study has been evolved giving due consideration to:
• Study Area Demographic and Travel Characteristics
• Project Challenges
• Issues and Concerns of all project stakeholders
Five different stages have been involved in developing the Mobility Plan for the Study.
• Stage1: Mobilization and Reconnaissance
• Stage2: Data Collection
• Stage3: Urban Travel Demand Model Development and Forecast Traffic characteristics
• Stage4: Draft Mobility Plan
• Stage5: Stakeholder Participation & Updation of Draft Mobility Plan.
13.5.10.3 Some of the indices that may be used for the CMP are
Safety
Cyclability
Public Transport
IPT
Bus Transport
On-street Parking
Non Motorized Transport
Accessibility
Walkability
Congestion
Average Speed
Table No. 13-7. Definition, formulation evaluation and targets for the indices in CMP 2008 PMC.
INDEX
DESCRIPTION Formulation
TARGET
Average Speed of
Average Network speed Average Network speed
30
Network
Modal Share of PT
Average category modal Public Transport Trips/Total
80%
Motorized
share Motorized Trips
Modal Share of
Average category modal NMT Trips/Total Trips
50%
NMT
share
VC Ratio
Average category VC (Road Traffic Volume/Road Ratio Capacity)
0.8
Access ibility
%of work trips with (Work trips with Travel Time less TT<15min than 15 min/Total Trips)
60%
Bus Supply
(Bus Fleet in Nos.)/Population in Buses per Lakh Pop Nos.)X100000
55
IPT
(Registered IPT vehicles in IPT vehicles per Lakh Pop Nos./Population in Nos.)X100001
1000
Walkabity
Availability & Usability of (Footpath Length in Km/Road FP Length in Km)X100
100%
Cyclability
Availability & Usability of (Cycle track Length in Km/Road FP Length in Km)X100
100%
Fatality
Fatalities per lakh population
(No.of Fatalities/Population)X101
0
Parking on Mobility Corridors
%of Road Length Used
(Length available for Parking in Km/Road length in Km)X100
0%
(Source –CMP 2008 PMC)
13.5.10.4 Mobility Plan Elements
Based on the aforementioned framework of the plan and the strategy for achieving the vision, Mobility plan action items are summarized as follows:
Mobility Corridor Plan
Traffic Management Plan
Public Transport Plan
Non Motorized Transport Plan
Passenger and Commercial Terminal Plan
Flyovers and Bridges Plan
Travel Demand Management Plan
Road Maintenance & Management Plan
Table No. 13-8 : Summary of Comparisions of different types of Transit Systems
Transit Commuter Metro Mode Rail
Monorall/AGT
LRT
BRT
Exclusive
Exclusive
Exclusive
ROW
Exclusive
Exclusive
ROW Semi-
ROW Semi-
ROW General
ROW Grade
ROW Grade
exclusive
exclusive
Options railroad
separated
separated
Mixed traffic
Mixed traffic
Mixed
lanes
lanes
traffic
Station
2 to 10 miles 1 mile
½ to 1 mile
½ to 1 mile
¼ to 1 Km
Spacing
Vehicles
Locomotive with set of passenger coaches
High platform cars operating in multiple car trains sets
High platform cars operating in multiple car trains sets electric propulsion
Articulated double articulated low floor can operated in multiple car sets electric propulsion
Standard articulated or double articulated, low floor or high platform diesel diesel/hybrid propulsion of ETB
Seated Capacity
90-185 per car
60-80 per car
30-75 per car
65-85 per car
40 standard 65 articulated 85 double art.
Average Speed
25 to 45 mph (40-70kmph)
15-35 mph (25-55 kmph)
15-35 mph (25-40 kmph)
15-30 mph (25-50 kmph)
13.5.12New Route Alignment has been proposed
Corridor -1 : Pimpri Chinchwad (PCMC) – Swargate
Alignment from (-) 450 m to 16589 m From dead end (Ch. – 450 m) of PCMC station to dead end of Swargate station (Ch. 16139m), the length of corridor 1 is 16.589 km, out of which 5. km is underground and remaining 11.570 km is elevated including length of Switch Over Ramp(SWR). Total 15 numbers of stations have been planned along this corridor out of which 9 are elevated and 6 are underground stations.
Corridor -2 : Vanaz (Kothrud) – Ramvadi
Alignment from (-) 684.8 m to 14925 m
From dead end (Ch – 684.8 m) of Vanaz station to dead end of Ramvadi station (Ch. 13790m), the length of corridor 2 is 14.925km. Total 15 number of elevated stations have been planned along this corridor.
Note: The recommendations made in Metro report for traffic and transportation have been considered in the draft development plan.
13.5.11Detailed Project Report for Pune Metro :-
The detailed project report has been prepared for the Pune Metro by Delhi Metro Rail Corporation Ltd in consultation with IIT Bombay.
Public Transport System should be an efficient user of space, with reduced level of air and noise pollution. As the population of a city grows, share of public transport, whether road or rail-based, should increase. Experience has shown that, in cities like Pune where roads do not have adequate widths and which cater to mixed traffic conditions comprising slow and fast moving vehicles, road transport can optimally carry 8,000 persons per hour per direction (phpdt). When traffic density increases beyond this level, average speed of vehicles comes down, journey time increases, air population goes up and commuters are put to increased level, of inconvenience. Thus when on a corridor, traffic density during peak hours crosses this figure, provision of rail-based mass transport, i.e. Metro system should be considered.
13.6Study Area for Traffic Studies.
13.6.1 Area
The study area considered was the area comprising the present Pune Municipal Corporation area, Pimpri Chinchwad Municipal Corporation area and both the cantonment areas namely Pune and Khadki (with major concentration on PMC area). The study area that was adopted in this study will be similar to the one adopted during the Pune metro study by IIT Bombay, but with appropriate modifications as stated above and as per the area decided by the development plan. The map in Figure No 13-2. shows the Pune Metropolitan Region showing the areas mentioned above forming the study area.
Figure No. 13-2 : Study area for traffic studies
13.6.2 Traffic analysis zones
The zoning system considered for the Pune metro study by IIT Bombay comprises of 91 internal zones and 13 external zones. In the present study, it was proposed to redefine these traffic analysis zones (TAZ) to the extent possible as per the administrative units like wards utilizing the available GIS maps with PMC and PCMC. Accordingly, the zoning system of the present study has been adopted based on the City Development Plan (2007-2027) comprising 144 zones in the PMC area, 105 zones in PCMC area and 16 zones in hinjewadi. Pune and Khadki cantonments have been considered as two zones. In addition to these 267 internal zones, 13 external zones are considered. These 13 external zones represent the catchments of the 13 entry points at the outer cordon. This delineation of the study area as adopted in this study is shown in Figure No 13-2.
Figure No. 13-3 : Zonal Map of PMC Region
13.6.3 Screen-lines and Cordon-Lines
Screen lines were established along the natural barriers viz., railway lines and rivers in PMA. Screen line count stations were formed at the intersection of the transport links and the screen lines. The volume counts at screen line stations were utilised for validating the O D matrix as well as the models. All the past studies more or less adopted two screen lines, one along the existing railway line and other along Mula – Mutha River. In this study also the same two standard screen lines were adopted. The boundary of the study area was the outer cordon line. Figure No 13-4. shows the location of these screen lines and screen line stations at which traffic counts were taken in Metro study.Figure No 13-5 shows the external cordon line and the cordon stations where in addition to traffic counts, origin – destination surveys were done.
Figure No. 13-4 : Locations of Screen Lines in Study Area
Figure No. 13-5 : Locations of Screen Lines and the External Cordon.
Table No. 13-9 : PCU Values adopted for the Study
Sr. No
Vehicle Type
Adopted PCU Values
1
Car / Jeep
1.0
2
Bus
3.0
3
Autorickshaw
0.8
4
Two-wheeler
0.5
5
LCV/ Mini-bus
2.5
6
Truck
3.0
7
Truck Trailer
3.5
(Source: Traffic studies by IIT Powai 2010)
13.6.4 Vehicular Growth and Modal Split:
In 2002, 58.8 million vehicles were plying on Indian roads (Table 1). According to statistics provided by the Ministry of Road Transport & Highways, Government of India, the annual rate of growth of motor vehicle population in India has been about 10 percent during the last decade. The basic problem is not the number of vehicles in the country but their concentration in a few selected cities, particularly in metropolitan cities (million plus).
It is alarming to note that 32 percent of these vehicles are plying in metropolitan cities alone, which constitute about 11 per- cent of the total population. During the year 2000, more than 6.2 million vehicles were plying in megacities (Mumbai, Delhi, Kolkata, and Chennai) alone, which constitute more than 12.7 percent of the total number of motor vehicles in the country (Table 2). Interestingly, Delhi, which contains 1.4 percent of the Indian population, accounts for nearly 7 percent of all motor vehicles in India.
Table No.13-10 : Growth trend in Vehicle Population ( in thousands)
City
1995
1996
1997
1998
1999
2000
Annual growth rate (1995 - 2000) in %
Pune
358
412
468
527
568
593
11
Table No.13-11 : Number of Vehicular type in Pune
Type of vehicle
No of vehicles Upto march 2011 (Source RTO Pune)
1
Car
3,86,559
2
Jeep
57,215
3
Two wheeler
17,96,339
4
Autorickshaw
69,946
5
Bus
10,001
Table No. 13-12 : Modal Share in %
Year
Walk
Cycle
Two wheeler
Public Transport
Car
IPT
1
2007 (Source: T& T Policies and Strategies in Urban Areas in India by Ministry of Urban Development & WSA )
25
11
26
21
10
7
Public Transport Share in %
13.6.5 Road Accidents
Following are the data for accidents from 2001-2009 for the Pune Police Commissionerate area including PMC, PCMC , cantonment board and suburban areas.
Table No. 13-14 : Road accident data
Table No. 13-14 : Road accident data
Table No. 13-14 : Road accident data
Table No. 13-14 : Road accident data
Criteria
2006
2007
2008
People involved
4482
4878
4880
Seriously injured
338
462
634
Minor injury
1408
1575
1256
No injury
197
186
195
Death
372
414
477
Total injured
1746
2037
1890
Total accidents
2123
2347
2270
Figure No. 13-6 : Road accident data.
CHAPTER NO 14
Traffic and Transportation Planning – Proposals
Pune is poised for rapid economic growth. It is projected that Pune’s urban population including the 23 fringe villages would grow to about 45.53 lakhs in 2017 (as per demographic projections done by Gokhale Institute 2009 ) and 61 lakhs in 2031.(Source. Pune Metro study by DMRC 2008). This projected future growth is largely attributed to the increased activities in secondary and tertiary sectors. Cities must not only meet the mobility needs of the current population but also provide for the needs of those yet to join the urban population.
14.1Sustainable Transportation Goals
Sustainability reflects the fundamental human desire to protect and improve our earth. It emphasizes the integrated nature of human activities and therefore the need for coordinated decisions among different sectors, groups and jurisdictions. Sustainability generally refers to a balance of economic, social and environmental goals, including those that involve long term, indirect and non-market impacts. They are shown in Figure 49 Sustainability planning (also called comprehensive planning) expands the objectives, impacts and options considered in a planning process, which helps to ensure that individual, short-term decisions are consistent with strategic, long-term goals.
Table 14-1 : Summary of Sustainable Transportation Goals, Objectives and Performance Indicators
Table 14-1 : Summary of Sustainable Transportation Goals, Objectives and Performance Indicators
Table 14-1 : Summary of Sustainable Transportation Goals, Objectives and Performance Indicators
Sustainability Goals
Objectives
Performance Indicators
Economical
Economical
Economical
Economic productivity
Transport system efficiency. Transport system integration. Maximize accessibility. Efficient pricing and incentives.
Per capita GDP Portion of budgets devoted to transport. Per capita congestion delay. Efficient pricing (road, parking, insurance, fuel, etc). Efficient prioritization of facilities
Economic development
Economic and business development
Access to education and employment opportunities. Support for local industries.
Energy efficiency
Minimize energy costs, particularly petroleum imports.
Per capita transport energy consumption Per capita use of imported fuels.
Affordability
All residents can afford access to basic (essential) services and activities.
Availability and quality of affordable modes (walking, cycling, ridesharing and public transport). Portion of low-income households that spend more than 20% of budgets on transport.
Efficient transport operations
Efficient operations and asset management maximizes cost efficiency.
Performance audit results. Service delivery unit costs compared with peers. Service quality.
Social
Social
Social
Equity / fairness
Transport system accommodates all users, including those with disabilities, low incomes, and other constraints.
Transport system diversity. Portion of destinations accessible by people with disabilities and low incomes.
Safety, security and health
Minimize risk of crashes and assaults, and support physical fitness.
Per capita traffic casualty (injury and death) rates. Traveller assault (crime) rates. Human exposure to harmful pollutants. Portion of travel by walking and cycling.
Community development
Help create inclusive and attractive communities. Support community cohesion.
Land use mix. Walkability and bikability Quality of road and street environments.
Cultural heritage preservation
Respect and protect cultural heritage. Support cultural activities.
Preservation of cultural resources and traditions. Responsiveness to traditional communities.
Environmental
Climate stability
Reduce global warming emissionsMitigate climate change impacts
Per capita emissions of global air pollutants (CO2, CFCs, CH4, etc.).
Prevent air pollution
Reduce air pollution emissions Reduce exposure to harmful pollutants.
Per capita emissions of local air pollutants (PM, VOCs, NOx, CO, etc.).Air quality standards and management plans.
Prevent noise pollution
Minimize traffic noise exposure
Traffic noise levels
Protect water quality and minimize hydrological damages.
Minimize water pollution.Minimize impervious surface area.
Per capita fuel consumption.Management of used oil, leaks and stormwater.Per capita impervious surface area.
Openspace and biodiversity protection
Minimize transport facility land use.Encourage more compact development.Preserve high quality habitat.
Per capita land devoted to transport facilities.Support for smart growth development.Policies to protect high value farmlands and habitat.
(Source : IIT Bombay report,2010-11)
14.2Common sustainable transport objectives include:
i. Improved transport system diversity: This generally means improving walking, cycling, ridesharing, public transit, car sharing, and creating more walkable and transit-oriented communities.
ii. Smart growth land use development:. This includes land use policies that create more compact, mixed, connected, multi-modal development, and provide more affordable housing in accessible, multi-modal locations.
iii. Energy conservation and emission reductions: This may include more fuel efficient vehicles, shifts to alternative fuels, and reductions in total motor vehicle travel. This
includes improving the quality of energy efficient modes including walking, cycling, ridesharing, public transit and increase land use accessibility.
iv. Efficient transport pricing: This includes more cost-based pricing of roads, parking, insurance, fuel and vehicles.
14.4Urban Transport Components in Planning
Demand for urban transport components will be specific to suit their requirements. However, the common requirements are listed below:
Urban Roads
Traffic improvements
Non Motorised Transport (NMT) management
Road Safety
Mass transport system
Intermediate Public transport (IPT)
Urban Transport Planning & Operation Data
Terminals
14.4.1 Urban Roads
The urban roads are classified into hierarchy of roads namely
a) National Highways
b) Arterial roads
b) Sub-Arterial roads
c) Local roads
4.4.1.1 National Highways
There are two national highways passing through the city i.e 60m NH-4, NH-9.
14.4.1.2 Arterial roads :-
The inter city roads having width more than 30m are called as major arterial roads. Some new roads have been suggested in the Development Plan. Some of the roads which were shown in the sanctioned 1987 Development Plan, have been further widened. At certain locations, new links have been proposed. Number of roads had been proposed after the sanctioned 1987 Development Plan, under the section 205 of the BPMC Act 1949 and also widened under section 210 of the BPMC Act 1949. Most of them have been shown in the proposed development plan. Those which have not been shown on this proposed development plan will be deemed to be not in force.
Some arterial roads have been proposed to be further widened, as listed in statement no.14-1. These roads can be provided for public mass rapid transport system which may include BRT. Cycle tracks are also considered to be developed along these roads
14.4.1.3 Sub-arterial roads :-
The inter-city roads having width between 15m and 30m are called as sub-arterial or distributor roads. These roads connect major arterial roads, and are intended to collect traffic from local streets within residential units. These roads have been proposed to be further widened, as listed in statement no 14.1. Cycle tracks can be developed on these roads.
14.4.1.4 Local roads
All the roads having widths less than 15m with dominant function to provide local connectivity within the same neighbourhood unit are termed as local Roads. These roads can be developed for pedestrian as also for cyclists having suitable road design.
New missing links have been proposed. Development of major arterial roads in the outer-city area, with capacity augmentation has also been considered as listed in STATEMENT No 14-2. Some new bridges/bypass, flyovers, subways have been developed and also proposed as listed in STATEMENT No. 14-5 and 14-7. New railway over-bridges have also been proposed as listed in STATEMENT No. 14-8.
14.4.2Traffic improvements
Traffic management should be undertaken to ensure that the hierarchy of road that is planned, operates as effectively and safely as possible, in accordance with the needs of all user groups and the functions associated with each street.
14.4.2.1 Junction improvements
Junctions are widened so as to ease vehicular movement. The turning radius is also increased to improve visibility. At some locations, islands have been proposed which will help the traffic move in an orderly pattern. Some junctions identified for development are listed in STATEMENT No. 14-10. Care should however be taken to provide proper storm water drains in order to reduce water logging at junctions.
14.4.2.2 Parking (Off-street / On-street)
Easier access of work places to and from such parking spaces can encourage the use of sustainable transport systems like BRT, Metro etc. Onstreet and off-street parking areas are to be planned after proper design and signage. Authorized parking spaces in public areas must be marked physically on ground in addition to display of signage.
Park and ride facilities for bicycle users with convenient interchange is an useful measure. Parking for Para-transport / feeder modes is to be prioritized and subsidized. Park and Ride areas are to be provided only at terminal MRTS/RRTS/BRTS stations, with a view to reduce the number of commuters driving into the central congested areas along high-demand corridors. Also, parking for cycles has also been proposed. Underground parking facilities can be created under the open spaces without disturbing the green areas on the surface and surrounding environment.
Variable Time-based Pricing – Differentiation in parking fees can be done according to zone, peak hour demand, days of the week, etc. by charging higher rates during peak hour and by progressively increasing the rates per hour.
14.4.2.3 Road Information System
Proper signages should be shown with street furnitures.
14.4.2.4 Intelligent Transport System
Installation of Automatic Traffic Control devices at the junctions will help in synchronizing the junctions in a particular area as proposed.
Installation of Automatic Traffic control devices at the junctions will ensure a continuous flow on the main corridor, thereby reducing the vehicular conflicts at the junctions.
Intelligent transport system can be used to obtain real-time dynamic traffic information online, such as road speed, CCTV, CMS (Changeable Message Signs), weather information, etc., and
various kinds of road events, like traffic block, construction, signal break, disaster, accidents, locations of roads which are affected by water logging. etc.
CCTV cameras can be installed to make parking lots safe for women/ users. Intelligent transport system has been developed at Swargate and is monitored by PMC.
14.4.2.5 One-Way Operations
One way road operations are very helpful in increasing the roadway capacity and reducing the intersection conflicts, paving the way for reduced delay in traffic and increase in safety. The one way operations on Fergusson college road and Jangli Maharaj road have proved very fruitful in this regard.
14.3Studies for Traffic and Transportation
Several studies, relating to traffic and transportation aspects in Pune Metropolitan Area, have been carried out in the recent past by various organisations. These studies covered transport systems like metro, bus rapid transit, tram, non-motorised transport and aspects like mobility, traffic management and road improvement schemes etc which are specified in earlier chapter no 13 Traffic and Transportation planning Part-I.
A comprehensive mobility plan (CMP-2008) was prepared. The CMP suggested several transportation infrastructure and system improvements necessary for the future. Around the same time, IIT Bombay developed a transportation planning model for the study area covering Pune and Pimpri – Chinchwad Areas for the purpose of forecasting passenger demand on the proposed metro rail lines. This exercise was part of the Detailed Project Plan on metro rail corridors in Pune taken up by Delhi Metro Rail Corporation (DMRC, the consultant) for PMC (the client).
IIT Bombay has presently done the consultancy work, with a view to evaluate the development scenarios towards sustainable transport strategy for Pune city, has upgraded the transport planning model developed for the metro study based on the enormous data available from previous transport plans which has been fully integrated with the revised development plan. The work included updation of the transportation planning model and using it for evaluating the alternative transportation scenarios for the envisaged land use development scenarios towards evolving sustainable strategies in the development plan on the Transportation infrastructure. The data on planning variables and the transportation system is listed below. These were collected during previous studies and made available for the present study.
• Planning Variables
• Population
Employment
Transport System data
• Highway network and link attributes
Public transport network and link attributes
• Public transport routes and system data
Generation of alternative transport scenarios based on existing traffic situations, CMP & envisaged land use scenarios as done by IIT Bombay. These are listed as follows:-
14.3.1 Usual Land Use Scenario (Scenario 1):
With the prevailing land us pattern (base year is taken as 2008), forecasting the traffic for future with different transportation network for the horizon year 2011, 2021 and 2031.
14.3.2 Increasing Floor Space Index (FSI) along Metro corridor (Scenario 2):
In this scenario, horizon year is considered as 2021, wherein the transport network consists of metro. FSI of 4 is considered, 500 m along both the side of the metro corridor. The basic variables used in the four stage planning model are the population and the employment. Population and employment has been forecasted for the year 2021 and the distribution is done as per the land use scenario considered. Employment can be worked out with the type of commercial and industrial activity to be increased along the metro corridor.
The zonal map is superimposed on the road network of the PMC region and the area along the metro corridor taking 500 m on both the side. Calculation have been made for the zones through which the metro line is passing, using the ArcGIS software.
Considering the total area of the city area under influence of metro corridor as 32.95 sq km, the population is estimated for the area under the influence of metro by taking the FSI of 4. This scenario is developed for horizon year 2021. 75% of the land is being used as a part of construction. The population for all other zones has been calculated as per the prevailing condition of land use pattern of individual zones.
14.3.3 Considering Public transport share as 80% (Scenario 3) :-
A hypothetical scenario has been developed wherein the share of public transport is considered as 80%. Due to large Public Transport share, its effect on the Public transport has been analysed.
14.3.4 Considering Work Participation ratio of 0.6 ( Scenario 4):-
A hypothetical scenario has been developed wherein the work participation ratio considered is 0.6. Due to increase in work participation ratio, there is an increase in employment which subsequently results in the increase in trips
Table No. 14-2 Estimated Travel for Base year and Forecast Years (Daily passenger trips)
Mode
scenario 1
scenario 2
scenario 3
scenario 4
2021
2031
2021
2031
2021
2031
2021
2031
PT
3050631
3900096
3307700
3941537
5045786
6170485
3639251
4663259
PV
3361606
3985096
3104541
3500441
1366444
1714699
4261023
4981778
CV (PCU)
15338
16005
15395
15548
15395
15548
15395
15548
6427575
7901197
6427636
7457526
6427625
7900732
7915669
9660585
Soucre :- (Final Report on Evaluation of development plan towards Sustainability for Pune Metropolitian Area by IIT Bombay 2011)
Table No. 14-3 Peak Hour Passenger boardings and passenger distance for all modes for horizon year 2021
O TTAL
RAILOON M
O METR
S BRT
N TRAI
IPT
US B
ode M
0 221
420480
35610
216754
32324
326
30807
108799
B o ar di n g
P a ss en g e r
(U s u al l a n d us e)
S c e n a ri o1
2306187
157410
1528152
14.4.3NMT management
Prioritisation for walking, bicycling, and transit by providing safe, accessible, convenient, and comfortable facilities for these modes, particularly on designated routes and at critical network connections is very important for the safety of pedestrians and cyclists.
Continuous and safe NMT lanes with adequate crossings are essential throughout the city. Ample parking facilities will be allotted for NMTs at all MRTS stations, railway stations,ST stands,Bus stands etc. Cycle tracks can be developed on Arterial and Sub arterial roads. New cycle tracks have been proposed along the Mutha right bank canal from race course to Hadapsar. Similar such proposals have been suggested in DP.
14.4.3.1 Pedestrian foot path and safe crossing facilities
Where grade separated facilities cannot be provided,at-grade facilities such as zebra crossings, striping, pedestrian flashing signals etc. would be provided.
To encourage and cater to walking trips, footpaths need to be installed on all roads without any exception. The following is suggested for the installation of footpath:
It is desirable to have a footpath of minimum width 2m on all roads.
Footpath design must discourage two wheelers using the footpath during periods of congestion
Footpaths at all busy intersection must be provided with handrails to enforce pedestrians cross at zebra crossings
Subways/ foot over bridges should be provided at appropriate locations such as at grade separator for safe and smooth passage of pedestrians etc.
14.4.3.2 Pedestrian subways
New subways have been proposed in the plan as listed in STATEMENT No. 14.7 in this chapter. On the mobility corridors, specifically at busy intersections and mid block bus stops (at public transit corridors), pedestrian foot-over-bridges or subways would be required.
14.4.3.3 Pedestrian zones
Commercial crowded areas have been identified and underground subways can be developed with road side shopping provided in subways. Some part may be used for parking, which will aid in minimizing parking on road as, thereby creating space for pedestrians, without disturbing the traffic on road.
14.4.3.4 Encourage and Designate Pedestrianization in Core Area
The core area with its array of high density retail and commercial uses and narrow streets is well suited for pedestrianization. Converting a street or an area for car-free use is called pedestrianization. Well-designed and placed public spaces can enliven an area. M.G. Road in the city has already being made a Pedestrian Plaza on Sundays. One of the pedestrian busy streets in core
area is Laxmi road, as can be seen from the pedestrian survey results. Similarly the surrounding roads also have a very high pedestrian count. On an experimental basis, vehicles may be banned on Laxmi Road and adjoining streets (within 50m to 200m) from 8 am to 8 pm, effectively turning an area of approximately about 0.5~1.0 square kilometers into a vehicle-free zone to ease the air pollution and traffic jams that plague the old city. International experience shows that despite the initial resistance, pedestrianisation has often improved the businesses and economy of the area which is in addition to the social benefits. If the ban proves successful, it could be made permanent.
14.4.3.5 Skywalk
The Pune Municipal Corporation (PMC) has undertaken a feasibility study to ascertain the financial and technical viability of the two skywalks proposed in the annual civic budget. One such skywalk has been suggested from Shivajinagar to Shaniwarwada and the other from Swargate to Mandai.
A lot of people walk from Shivajinagar to Shaniwarwada. A skywalk will help the commuters to avoid congested roads. The project will ensure a hassle- free and safe pedestrian movement from the busy Shivajinagar railway station and Swargate bus station.
The proposed Shivajinagar Station - Swargate Skywalk will join Shivajinagar Station to Swargate via Shaniwarwada, Dagadusheth Halwai Ganapati and Mandai Market. Pune Municipal Corporation has started a feasibility study of this skywalk on the Shivajinagar Station to Shaniwarwada section and Mandai Market to Swargate section.
This skywalk will be constructed on four sides of Mandai Market. This will be made in three parts i.e. from Shivajinagar Station to Shaniwarwada, Swargate to Mandai Market and Mandai Market to Shaniwarwada.
14.4.3.6 Cycle tracks & terminals
Provisions of separate bi-cycle lanes having at least 2m width would improve the overall traffic flow. To provide separate NMT facilities, sometimes the shoulders and carriageway may be needed to be widened within the ROW. Also in some cases, parking may be needed to be relocated to make way for the NMT facilities at certain locations.
Cycle tracks would be proposed with landscaping, cycle stands, water drinking facilities, toilet facilities etc.
The right bank canal is no longer used by the irrigation dept and can be used as the cycle track from race course to Sade Satra nalli in Hadpasar. This track can be developed upto 10 km, thus creating more space for pedestrians and cyclists. A cycle track is also proposed to be developed from Salisbury park to Rajaram bridge overs the service road along the right bank canal.
Cycle track is proposed to be developed along roads having width more than 15 m.
14.4.3.7 Traffic Segregation
To reduce accident risk and increase level of service, central medians need to be provided on mobility corridors. Bicyclists and pedestrians are more efficient users of scarce road space as compared to private motor vehicles, as regards combat congestion. Bicycling and walking are the most efficient and environmentally sustainable means of making short trips.
Figure No. 14-2 : 3D View of BRT Corridor
Pune has already begun implementing Projects of developing bicycle lanes and should continue to do so on all corridors, more specifically, the mobility corridors. Cyclists using the carriageway, along with motor vehicles and other road traffic, cause hazards for themselves. This is particularly true when cycle traffic is more. Under such circumstances, it is necessary to segregate cyclists from other modes of traffic.
14.4.4Road Safety
14.4.4.1 Signage
Marking of zebra crossing, lanes, parking lanes, traffic signages has to be done on roads. Road signs are classified into three categories: Mandatory/Regulatory signs, Cautionary/Warning signs, and informatory signs. It is recommended that signs near schools should be installed on priority basis. Traffic control devices such as: Center line, Traffic lane lines, Stop lines, Pedestrian crossings, Parking space limits, Kerb marking for visibility, Obstruction marking etc. must be provided keeping in view all users of the road and especially for night time driving.
All the traffic signs should be facilitated as per the guidelines provided in IRC publication 67-2001. Proper lighting should be done for night traffic
14.4.4.2 Training & education
To educate people regarding various aspects of safety rules and regulations of traffic planning. Traffic Parks. may be developed at specific identified locations, earmarked as Park in the Development Plan.
14.4.4.3 Accident information system
Surveillance system is proposed to be operated at major junctions / major roads in the city.
14.4.4.4 Trauma care facilities
With a view to address the issues of accidents and other mishaps, sites have been identified for specialty and trauma care centre at key locations in the development plan.
14.4.4.5 Management of accident prone areas
Widening at junctions and by providing adequate chamfers helps in eliminating blind spots at junctions. Also Speed breakers to reduce speed at junctions, may also be provided.
14.4.4.6 Signal Coordination & Optimization
When properly used, traffic control signals are valuable devices for the control of vehicular and pedestrian traffic. They assign the right-of-way to the various traffic movements and thereby profoundly influence traffic flow. Traffic control signals that are properly designed, located, operated, and maintained will have many advantages. Traffic signal type, spacing, phasing, offsets should be optimized for all modes of traffic on all mobility corridors to ensure a speedy thoroughfare. Wherever possible, actuated (demand response) traffic signals must be provided
14.4.7Terminals
14.4.7.1 Rail
The Pune station is the major railway junction in the city.All national and intercity trains are attracting passengers from this junction. There are also other railway stations at Khadki, Shivajinagar and Hadapsar.
14.4.7.2 Bus (Inter-city/intra-city/Tourist etc)
Bus Terminals
There are four major bus terminals in Pune, namely Shivaji nagar, Pune Railway station, Swargate and Pune Municipal Corporation. Some of the major problems associated with these bus terminals can be solved to a certain extent as follows:-
Access roads leading to these bus terminals have been proposed to be widened. However, these should be kept free from encroachment by hawkers, shop keepers and parked vehicles.
Facilities within bus terminals in terms of bus bays, boarding alighting platforms and circulation can be provided.
Following are the seven bus depots/terminals situated in the city.
Swargate Depot
N.T.Wadi (Shivaji nagar) Depot
Kothrud Depot
Katraj Depot
Hadapsar Depot
Market Yard Depot
Pune Station Bus Terminal
Mahatma Gandhi Bus Terminal
Katraj Bus Depot.
Among these seven bus terminals, Swargate, Shivaji Nagar and Pune Station bus terminal are situated in the congested area.
New Bus Terminals have been proposed at Bibwewadi, Parvati, Pashan, Yerawada, Sangamwadi, Lohegoan, Mula road.
14.4.7.3 Truck terminals
The truck terminals have been proposed at some locations in the Development Plan of the 23 villages. In order to reduce congestion due to heavy traffic in the city, truck terminals sites having an area of 100 acres each can be identified along Satara road, Sholapur road, Nagar road and Bombay Pune road, on the periphery of city, along the ring road. These sites shall be developed for Truck parking. These will incorporate godowns for loading and unloading, goods platforms, sorting sheds, facilities like hotels, rest rooms, restaurants etc. They can also be provided with bus terminus. Heavy traffic for transport of freight shall not be permitted to enter the city during day time.
14.4.5Mass transport system
14.4.5.1 Commuter rails/LRTS/ Metro
A detailed project report for the study was submitted by DMRC Delhi and IIT-Mumbai. A travel demand forecast model was developed for the metro project. The study recommended a high capacity rapid transit system on six alignments.
The following alignments have been finalized for the Metro:
Line 1: Agricultural College to Nigdi via Pune Mumbai Rd (length- 16 km)
Line 2: Agricultural College to Warje Via JM and Karve Rd (length- 8.7 km)
Line 3: Agricultural College to Swargate and Katraj via Shivaji Rd (length- 12 km)
Line 4: Agricultural College to Vagholi via Bund Garden Rd (length- 16 km)
Line 5: Agricultural College to Hinjewadi via Aundh (length- 17.5 km)
Line 6: Agricultural College to Hadapsar via Mhatre Bridge (length- 16 km)
Note: The metro routes proposed are shown on the proposed development plan. The alignments are indicative and likely to change slightly depending on the site conditions. The Policies for development of Metro Stations shall be finalized at a later stage.
Those owners, who come forward and hand over their lands, for Metro stations, shall be incentivised by giving them TDR of twice of which is permissible.
14.4.5.2 High Capacity Mass Transportation Route.
The feasibility report of High Capacity Mass transport system for Pune Metropolitan Area has been carried out by RITES. The total HCMTR route is proposed along 34 km length. It has a width of 24m and its alignment is as shown in the RITES study. Any other form of alignment would require land acquisition that is too prohibitive considering the financial and social constraints. The alignment shown is not a closed loop but with the utilization of existing roads and road widening, the loop can be made a closed one.
The route is aligned as a ring to run from the Khadki Railway Station, along the eastern boundary of the Pune University Complex, Senapati Bapat Road, by the side of Hanuman and Law College hills, across SNDT hills, over the nalla through Ganesh Nagar up to the Dattawadi Bridge, along or over Ambil Odha, the Mutha right bank canal upto the Pune Cantonment limits, through the cantonment area and via Lulla Nagar, Netaji Nagar, SRP area, across the river entering Wadgaon- Sheri and via viman Nagar, Central Jail upto Alandi Road within old PMC limit.
The route is proposed to be used only for operating the mass transportation system and hence it will be connected to the existing or proposed road network only at selected interchange points. This route would be developed to operate the rapid bus transport system initially and converted progressively to operate the higher capacity systems, such as the trolleys, trams, monorail and finally the rail based rapid transit system. The interchange stations have been suitably located along the route, where the buses operating on the conventional routes can switch over from the road network to the High capacity route and vice-versa. After conversion of the route into the rail corridor, these inter-changes. Stations would operate as interchanges between the rail system and the feeder bus system.
The alignment has been designed accordingly to suit the operation of the rail-based system and incorporated in the Revised Draft Development Plan
for the first part of 33.90 kms, passing through the area in the Municipal Corporation, Cantonments and Wadgaonsheri village. The proposal has been shown in red lines and washed in grey color.
14.4.5.3 Public Transport
Pune has a low share of public transport and a high share of private transport. PMPML is operating buses in the PMC limits. With a fleet of about 960 buses transporting nearly 5.50 lakh passengers per day, a staff of about six and a half thousand, six depots, eighteen main bus stations and about 200 operational routes PMPML is a very important body in Pune. PMPML has been recently formed by merging PMT and Pimpri Chinchiwad bus corporation. The gap between transport demand and supply is increasing in pune. Mumbai's BEST had a fleet of 1800 buses in 1971 when it had to cater to a population of 27 lakh people. Pune, today has roughly the same number of people [today as Mumbai did back then] but PMPML has only about 960 buses in running condition.
Incorporating public transportation is an important parameter at the urban planning stage rather than being a consequential requirement. This can be achieved by introducing an Intelligent Transport Systems for traffic management. It will result in developing concerns regarding road safety, trauma response and reducing pollution levels within the city.
14.4.5.4. Bus transport system (intra-city / inter-city) /BRTS
The launching of the JNNURM has provided a timely platform for providing significant financial support from the Central Government for investments in urban transport infrastructure.
The main motive of BRTs is to wean people away from the private vehicles to the public transport. The existing bus transport system obviously operates with and subject to the same limitations as the other vehicles, due to conditions prevailing in different sections of the existing road network. The service capacity and the resultant efficiency of the bus system primarily depends upon the turnover from each unit or a bus. Its overall efficiency is greatly affected due to the congestion on roads resulting in lower average speeds, higher fuel consumption, greater wear and tear of the vehicles due to frequent application of brakes and change of gears, and tension on drivers thereby reducing their efficiency.
It is necessary to introduce bus priority measures on the road network by providing bus lanes, either with- flow or contra flow, wherever the width of the existing roads is sufficient, on one way roads and when new roads are designed. This would increase the average operational speed of the buses resulting into extracting greater seat per kilometer and raising the revenue receipts from the same fleet, while keeping the operational costs almost constant. Cost savings associated with BRT can enable the city to focus its resources on other urban improvements. Width of new roads and widening of some of the existing roads have been proposed to make these measures feasible.
14.4.5.5 Inter modal transfer facilities
14.4.5.6 Inland water facilities
Pune city is bounded by two major rivers, namely Mula and Mutha. These rivers can be used for navigation from Rajaram bridge at Karvenagar to Kharadi i.e total length of 16 km. This can be further extended on upstream side i.e Shivane The water level in the river should be maintained for navigation. Also beautification can be proposed along the river bank. This option of water water transport needs to be explored at the earliest.
14.4.5.7 Intermediate public transport (IPT)
As of 2007, about 58916 three wheelers are running on the streets of Pune.(Source CMP 2008).They provide connectivity to the city core, which has a narrow road network. Auto rickshaws tend to serve areas with poor bus
service provision and offer point to point service. According to Pune traffic Control Branch,three wheelers wait for commuters at nearly 500 designated stands on streets..(Source CMP 2008). Rickshaw stands have been suggested at major traffic junctions, townships, neighbourhoods, hospitals, bus stands, railway stations ,airport etc.
14.4.6 Urban Transport Planning & Operation Data
Urban Road Information System
Data Collection
Collation & Management
Planning & research activities
14.5Achievement as per National Urban Transport Planning (NUTP) in Traffic Planning in Development Plan
The National Urban Transport Policy (NUTP) has been kept as the focal document, while preparing various Traffic and Transportation proposals in the revised Development plan. As per the requirement of NUTP, PMC has prepared a comprehensive Mobility plan (CMP) for the city. This plan has been prepared after the study of all the responses pertaining to traffic studies prepared in the past are studied.
14.5.1 Planning for Healthier Transport
Sustainable transportation options rely heavily on promotion of public transport and non- motorised modes.
Buses and non-motorised modes of transport will surely remain the backbone of mobility in mega- cities like Pune. Bus use needs to be increased without increasing the pollution and the rate of road accidents. This can be made possible as the following points have been considered in planning:-
Safe entry and exit procedures for bus passenger. This would include buses equipped with closing doors, low floors, and appropriately designed bus stands.
Operation of buses at safe speeds:- This can help in improving frequency and reduction in the travel time.
Bus stop locations that ensure route changes, convenience and safety of commuters.
Increase in use of public transport also results in increase in the walking/bicycling trips.
Freight traffic is proposed to be restricted in congested part and will be allowed in the city only during the night timings.
Table No. 10-5. Growth of total population and slum population in PMC area
SR. NO.
YEAR
TOTAL POPULATION
SLUM POPULATION
% OF SLUM POPULATION TO TOTAL POPULATION
1
1921
1,33,000
NA
NA
2
1931
1,62,000
NA
NA
3
1941
2,38,000
NA
NA
4
1951
4,81,000
38,500
8
5
1961
6,06,777
92,101
15.18
6
1971
8,56,105
2,39,701
28
7
1981
12,03,363
3,77,000
31.33
8
1991
15,66,651
5,69,000
36.32
9
2001
25,38,473
1,025,000
40.38
(Source: Census of India and ESR 2004-05)
It is observed that 40.38 percent of the total population is residing in slum settlements. Over the years, there has been considerable growth in slum population as is evident from the above table. The very high growth during the 1968-76 period is probably due to the rural conditions when Maharashtra State faced severe droughts in 1966-67 and in 1972-73. It is likely that the drought in rural areas forced migrants to Pune in search of livelihood. From the growth trends, it is evident that almost half of Pune’s population will be in slums over the next 10 years, unless the Govt. agencies act fast as a facilitator, by ensuring adequate supply of developed land, zoning and reservations.
c) Distribution of Slums on government & private land
Slums have encroached on public as well as private lands. By and large, they are located on land judged unsuitable or unattractive for real estate development.
Out of declared 564 slums, 66 slum are on state owned lands contributing 11.70 % of slum land ownership to total slums, followed by lands having various departments ownership like Pune Municipal Corporation, railways land etc.
Figure No 10-7 Land ownership of total 564 slums
(Source: Housing report by MASHAL 2010)
d) Slum improvement schemes
We are envisaging envisage on the vision of “Slum Free City ” by encouraging policies to tackle the problem of slums in a definitive manner. This can be achieved by a multipronged approach focussing on :-
Bringing the existing slums within the formal system and enabling them to avail of the same level of basic amenities as the rest of the town.
Redressing the failures of the formal system that lie behind the creation of slums. Tackling the shortages of urban land and housing that keep shelter out of reach of the urban poor and force them to resort to extra-legal solutions to retain sources of livelihood and employment.
To achieve the above vision many policies have been framed for development of slums
a. Slum redevelopment / rehabilitation schemes.
b. Lok Awas Yojna
c. Valmiki Ambedkar Awas Yojna
d. Basic services for the urban poor (BSUP) under JNNURM
e. Rajiv Awas Yojna.
e) Slum redevelopment/ rehabilitation schemes
There is a key instrument available for slum upgrading and resettlement in Maharashtra, the Slum Rehabilitation Act (SRA). All efforts are, however, underpinned by the law guarantee security of tenure to all those who can establish they were on a piece of land as of 1st January 1995. The key instrument is the Floor- Space Index ratio (FSI), which is used to cross-subsidize housing for the urban poor in the form of TDR.
Table No. 10-6. Slum Rehabilitation/ redevelopment Schemes Developed
Sr. No.
Schemes
Numbers
1
Total proposals for rehabilitated schemes submitted
140
2
Proposals cancelled
11
3
Sanctioned schemes
49
4
Construction in progress
39
5
Schemes completed
10
6
Proposals under legal formalities
80
(Source: PMC, SRA Dept)
f) Lok Awas Yojna
A scheme of 2000 tenements has been proposed for slum dwellers with very low income by MHADA. Under this scheme, the backward class is given a subsidy of INR 11,000 as the National program and an additional INR 9,000 as social work donation. Lok awas Yojna was included in Valmiki Ambedkar Awas Yojna in 2002 under which 149 beneficiaries were selected.
g) Valmiki Ambedkar Awas Yojna
Under this scheme, the central and the state government will be contributing equal amounts for the rehabilitation of backward class slum dwellers. Those slum dwellers, whose name appear in the voters list of 1.1.1995, are still staying in slums and are below the poverty line have been offered an INR 50, 000/- subsidy for maximum 25 sq.mt. house in metro cities. Under this scheme, total 7,875 houses have been constructed. In phase I total 2,328 tenements in-situ and in phase II, 4,447 tenements in-situ and 1,100 under cluster have been developed.
h) The Basic Services for the Urban Poor (BSUP)
The basic aim of BSUP is to provide a garland of 7 entitlements/services – security of tenure, affordable housing, water, sanitation, health, education and social security – in low income settlements in the 63 Mission Cities. The Integrated Housing and Slum Development Programme (IHSDP) seeks to provide the aforementioned garland of 7 entitlements/services in towns/cities other than Mission cities. PMC is constructing 20,528 t/s. for Urban poor out of each 4,000 t/s. are being constructed in-situ. The schemes under BSUP are being undertaken by PMC in at Hadapsar and Warje.
BSUP Project undertaken in Hadapsar.
i) Rajiv Awas Yojana
Rajiv Awas Yojana (RAY) for the slum dwellers and the urban poor envisages a ‘Slum-free India’ by encouraging States/Union Territories to tackle the problem of slums in a definitive manner. It calls for a multi-pronged approach focusing on:
(1)Bringing existing slums within the formal system and enabling them to avail the same level of basic amenities as the rest of the town. (2) Redressing the failures of the formal system that lie behind the creation of slums: and tackling the shortages of urban land and housing that keep shelter out of reach of the urban poor and force them to resort to extra-legal solutions in a bid to retain their sources of livelihood and employment.
Rajiv Awas Yojana envisages that each State would prepare a State Slum-free Plan of Action (POA). The preparation of legislation for assignment of property rights to slum- dwellers would be the first step for State POA.
The POA would need to be in two parts, Part-1 regarding the up gradation of existing slums and Part -2, regarding the action to prevent new slums. In Part – 1, the State would need to survey and map all exiting slums in selected cities proposed by the State for coverage under RAY. In Part- 2 the Plan would need to assess the rate of growth of the city with a 20 year perspective, and based on the numbers, specify the actions proposed to be taken to obtain commensurate lands or virtual lands and promote the construction of affordable EWS houses so as to stay abreast of the demand.
10.3.3.2 Gunthewari
Gunthewari is the type of unauthorized development that has taken place in some parts of the city which has been regularized by the PMC as per the Maharashtra Gunthewari Regularization Act 2001.
7
Metering System
100% metering is envisaged to improve the collection system as well as check on consumption of water by way of telescopic rates. The consumer metering as well as bulk metering system for billing and recovery is essential as per JNNURM toolkit and for funding. This will definitely check the consumption pattern and NRW of water. Installation of the advance water meters in line as per the prevailing practice at other corporations such as Mumbai, KDMC, PCMC etc. can also be adopted.
8
SCADA System
A well defined SCADA system connecting all nodes of water supply system with advancement recording and monitoring facility is necessary.
Figure No. 11-2 : Percentage of total energy consumption
It is observed from the above Pie chart, that even though the no. of residential consumer is 85% of the total no., the energy consumption is 32% and even though the no. of Industrial consumers is only 2%, the energy consumption is 42%, which is substantially high. For commercial users, energy consumption is 21% and for other users, i.e street lights, it is only 1%.
In the light of energy crisis, PMC is trying to enhance energy efficiency for street light energy consumption.
STATEMENT NO 11.1
Details of Reservations from 1987 DP in Proposed Land Use
Sector No.
No. of reservations Continued in proposed land use.
No. of Reservations continued with redesignation in proposed land use
(Source :- For Typical Indian Conditions ( 1-lane BRT)
Note : The recommendations made in CMP regarding traffic and transportation has been considered in the draft development plan.
PT share estimated
Rites 1994
WSA 2007
45.8 to 59.7%
11.2 to 32.1%
Table No.13-13 : Estimated Mode Share in future in %
2007
2011
2021
2031
PT
PV+ IPT
NMT
PT
PV+ IPT
NMT
PT
PV+ IPT
NMT
PT
PV+ IPT
NMT
1. (Source: Traffic & Transportation Policies and Strategies in Urban Areas in India by Ministry of Urban Development & WSA )
22
42
36
21
45
35
15
51
34
12
54
34
2. (Source Metro Study by DMRC and IIT Powai )
36
64
39
61
40
60
41
59
Note: PT- Public Transport, PV- Personal vehicles, IPT- Auto rickshaw, NMT- Non motorised transport including walk and cycles.
93222
4945
100084
422375
D i s ta n c e(k m)
P a s se n g e r
404111
32579
223256
24645
0
19713
108418
B o ar d i n g
P a ss e n g e r
(I n c r e as gin S F)I
S c e n aori2
98 13182
9 11726
37 19080
63288
88.
55304
374379
s Di tan ce(k m)
as P sen ge r
721431
66574
336481
67621
125
35348
218454
B o ar di n g
P a ss en g e r
(P T s h a r e a80%s)
S c e n ari3o
5195524
9 2954
3 298012
8 18874
4291
110742
2293664
Di stacen(k m)
a P gsseen r
877103
43948
256702
42663
477
37081
185702
B o ar din g
P a ss gen er
(W ork p a tr i 0. ci)6 pa ti on r at i o o f
S c e n ari o4
9 543781
9 16852
8 116065
120525
7113
119440
2140429
Di s tan c e(k m)
a P s sen g e r
2031
Mode
(Usual land use)
(Increasing FSI)
(PT share as 80%)
(Work participation ratio of 0.6)
Passenger
Passenger
Passenger
Passenger
Passenger
Passenger
Passenger
Passenger
Boarding
Distance (km)
Boarding
Distance (km)
Boarding
Distance (km)
Boarding
Distance (km)
BUS
119804
456826
112311
394997
234821
2291674
200564
2191081
IPT
36244
114333
24437
69465
49710
150637
46468
140228
TRAIN
372
5610
0.9
135
1438
21027
522
7661
BRTS
49098
140537
27090
68528
97204
252908
63928
175685
METRO
289960
2135564
245623
1533537
401953
2779827
335871
2435751
MONO RAIL
47050
214506
36635
137043
91977
447707
62277
290209
TOTAL
542528
3067376
446096.9
2203705
877103
5943780
709630
5240615
2021
Mode
Scenario 1
Scenario 2
Scenario 3
Scenario 4
(Usual land use)
(Increasing FSI)
(PT share as 80%)
(Work participation ratio of 0.6)
Passenger
Passenger
Passenger
Passenger
Passenger
Passenger
Passenger
Boarding
Distance(km)
Boarding
Distance(km)
Boarding
Distance(km)
Boarding
BUS
107899
422375
104818
374739
214854
2236964
187520
BRTS
32234
93222
24465
62388
67621
184887
42663
METRO
217654
1528152
222356
1370980
336481
2319802
257602
MONO RAIL
35160
157410
32759
119726
66754
29594
43948
2031
Scenario 1
Scenario 2
Scenario 3
Scenario 4
(Usual land use)
(Increasing FSI)
(PT share as 80%)
(Work participation ratio of 0.6)
Mode
Passenger
Passenger
Passenger
Passenger
Boarding
Distance (km)
Distance (km)
Distance (km)
BUS
119804
456826
112311
394997
BRTS
49098
140537
27090
98528
METRO
289960
2135564
245623
1533537
MONO RAIL
47050
214506
36635
137043
Table no 14-7 Peak hour Metro Loading for the year 2021
Scenario 1- Usual Land Use
Scenario 2- Increasing FSI
Scenario 3- PT Share of 80%
Scenario 4 -Work participation ratio 0.6
LINE NAME
Length (km)
Passenger
Passenger
PPHPD
Passenger
Passenger
PPHPD
Passenger
Passenger
PPHPD
Passenger
Passenger
PPHPD
Boardings
km/km
Boardings
km/km
Boardings
km/km
Boardings
km/km
AC to Nigdi
15.86
41133
21861
18418
37255
16811
16160
63971
32520
27662
50262
26406
21777
AC to Hinjewadi
15.65
41711
27950
19521
40813
22633
16221
67332
44334
30378
52083
35109
24205
AC to Katraj
12.01
36449
21157
15992
40558
23201
16860
49567
25622
20906
39091
21807
16943
Chandini Chowk to Ramwadi
17.96
54677
15773
23629
54057
14291
17485
89603
25997
35747
66101
19229
27702
Deccan GymKhana to Yerawada Bridge
13.94
45040
15410
14700
49672
16575
15073
66007
24126
19066
50065
17293
16214
23 8
Table No Peak hour Metro Loading for the year 2031
Scenario 1- Usual Land Use
Scenario 2- Increasing FSI
Scenario 3- PT Share of 80%
Scenario 4- Work participation ratio 0.6
LINE NAME
Length (km)
Passenger
Passenger
PPHPD
Passenger
Passenger
PPHPD
Passenger
Passenger
PPHPD
Passenger
Passenger
PPHPD
Boardings
km/km
Boardings
km/km
Boardings
km/km
Boardings
km/km
AC to Nigdi
15.86
55823
29796
24253
42394
280532
17410
79450
40550
31691
67757
35546
28325
AC to Hinjewadi
15.65
58452
40403
28296
50819
453573
21742
84656
51677
35694
71565
46829
32234
AC to Katraj
12.01
49996
33000
21728
42061
283870
17345
60956
34695
24356
53532
33433
22493
Chandini Chowk to Ramwadi
17.96
68876
20105
29927
57333
271666
20545
99085
27707
37735
81158
23750
33429
Deccan GymKhana to Yerawada Bridge
13.94
56812
19635
18547
53014
243893
15890
77804
29729
21906
61858
22356
18951
Ridership Estimation on Monorail Corridor
Scenario 1- Usual Land Use
Scenario 2- Increasing FSI
Scenario 3- PT Share of 80%
Scenario 4 -Work participation ratio 0.6
YEAR
Length (km)
Passenger
Passenger
PPHPD
Passenger
Passenger
PPHPD
Passenger
Passenger
Passenger
PPHPD
Boardings
km/km
Boardings
km/km
Boardings
km/km
km/km
2021
32
35160
4919
9149
32759
119726
4748
66754
9249
16859
43948
2031
32
47050
6703
11246
36635
137043
5177
91977
13991
21283
62277
Peak Hour Passenger Boarding and Passenger Distance for BRTS
Scenario 1- Usual Land Use
Scenario 2-Increasing FSI
Scenario 3- PT Share of 80%
Scenario 4 -Work participation ratio 0.6
Passenger
Passenger
Passenger
Passenger
Passenger
Passenger
Passenger
Passenger
YEAR
Boardings
Distance (Km)
Boardings
Distance (Km)
Boardings
Distance (Km)
Boardings
Distance (Km)
2021
32234
93222
24465
62388
67621
184887
42663
120255
2031
49098
140537
27090
68528
97204
252908
63928
175685
81332
233759
51555
130916
164825
437795
106591
295940
24 1
Recommendations by IIT-Bombay.
Scenarios considered
Remarks
1
Land use(Do nothing)
Metro Rail, HCMTR & BRTS to be implemented as per Master Plan.
2
Densification along the Metro Corridors
Likelihood of achieving Sustainable Development
3
Share of public Transport - 80%
Public Transport services will get overloaded due to saturation level. In this case, public Transport Services would be required or now metro line to be laid for areas not covered earlier
4
Work participation Ratio-60%
Substantial increase in the number of trips, significant impact on the transport network due to increase in household employment. Metro rail system with proper co-ordination with BRT & Bus system is needed.
5
Specific Condition
i) Implementation of integrated master plan of high capacity Transit systems planned with last mile connection of wake bicycles, bus & IPT mode in that order, for achieving urban transportation system . ii) Transit oriented land use planning with densification along the metro is considered necessary for achieving sustainability. iii) Adoption of concept of mixed land use in the large IT & ITes employment centre and other employment and growth centre and the ones planned in the future, Minimizing commuter trips is recommended.
One of the successful ways of increasing the public transport trips in addition to the fleet augmentation is to increase the speed and capacity of the public transportation system by way of dedicated public transport corridors. A public transport corridor is an alignment mostly on existing transport network system either at grade or grade separated with dedicated carriageway to carry public transport trips. It is important connecting routes should feed the spine routes of BRT, in terms of passengers. The more robust the network, the more useful it will become, and the more likely people will choose to use it.
PMC’s BRTS Report (Network Development for BRT for Pune City under the Scheme of JNNURM – Main Report, July 2006) identifies 21 corridors/routes for BRTS, based on earlier studies and some fresh surveys. Various parameters such ROW, present PMPML ridership etc are considered in the determination of the routes.
The 21 routes thus identified, adding up to about 101.70 km in length are listed in as below :-
Table No. 14-11 : Routes proposed for BRT
Table No. 14-11 : Routes proposed for BRT
Name of Corridor
PMC
Name of Corridor
Length (kms)
Satara Road
5.5
Solapur Road
7.7
Yerwada to Vishranthwadi Road
4.5
Ahmednagar Road
5.2
Singhagadh Road
7.2
Airport Road
2.2
Mundhwa bypass
2.8
Karve Road
6.4
High Capacity River Side Road
10.4
Paud Road
4.6
Vishranthwadi-Dhanori Road
6
Airport to Ramwadi Jakat Naka
1.45
Sancetti Hospital to University Junction
2.73
Baner Road
3.2
Hotel Green Park to Balewadi stadium crossing westerly bypass
5.69
Vishranthwadi Airport
2.4
Kalyni Nagar Junction to Alandhi Road
2.33
Airport Road to Deccan college via hot mix plant
2.55
Westerly bypass-Balewadi road to Baner road
2.83
Bajirao Road Old Mumbai Road
2.3
Old Mumbai Road
5.5
Shivaji Road
3.3
Nehru Road
5
Bhairoba Magarpatta Road
-
L.B. Shastri Road
-
J.M. Road
-
Yerwada - Bhairoba nanla
-
Bibewadi Road
-
Saswad Road
-
Pashan Road
-
Kondhwa Road
-
Aundh Road
-
Alandi Road
-
Total
101.7
Recommendations for improvement in BRT performance
• Modern bus stations with pre-board ticketing and comfortable waiting areas.
• Multi-door buses that dock with bus stations to allow rapid boarding and alighting.
Bus prioritisation at intersections either as signal priority or physical avoidance (e.g., underpasses).
• Real-time information displays on expected bus arrival times.
Excellence in customer service that includes clean, comfortable and safe facilities, good information and helpful staff.
BRT designs for different width of roads have been indicated in STATEMENT NO 14-9.