8.1 Water Supply
For providing drinking water to citizen, the Corporation pumps water from two sources i.e. Gangapur dam and Darna river. Water supply to the Ambad and Satpur industrial areas within corporation limits is provided by M.I.D.C from its own water works, sourced from the Godavari.
8.1.1 Water Source
a) Head works at Gangapur Dam: Gangapur Dam is 13 km away from city centre on Godavari River. It was constructed in 1954. It had a total storage of 7200 mcft. Over a period, the storage has been reduced to 5630 mcft. There is a reservation of water in the dam to the extent of only 1194 mcft. Dam water is also reserved for MIDC in Nashik and Eklahara thermal power station situated near Nashik. Raw Water is pumped at balancing tank situated within the head work premises and from there water is supplied to Nashik WTP, Shivaji Nagar WTP, Panchvati WTP, Gandhi Nagar WTP through pre-stressed concrete gravity lines.
b) Head works in Darna River, at Chehedi: In this Storage Head Work, in Darna River at Chehedi Village, 25 MLD of raw water is pumped and supplied to Nashik Road Filtration Plant.
8.1.2 Filtration and storage
Raw water pumped from sources, is treated in treatment plants located at five different locations as mentioned in the table below.
| Location and Capacities of WTP | ||
| Sr.No. | LOCATION | CAPACITY(MLD) |
| 1 | Shivaji Nagar | 97 |
| 2 | Bara Banglow / Nashik | 81 |
| 3 | Panchvati | 71 |
| 4 | Gandhi Nagar | 26 |
| 5 | Nashik Road | 73 |
| Total | 348 | |
Source : CDP, JNNURM.
After filtration of water in these 5 treatment plants, water is supplied to consumers through Elevated Service Reservoirs (ESR). There are total 69 (ESR) for distribution of water in the city.
8.2 Drainage and Sewerage:
The present sewerage system caters to about 70% of the population. In some area sewerage system is over loaded due to rapid increase of population in vertical direction. Therefore, the system needs to be augmented further. This is being undertaken through underground sewerage system Package-I and Package-II projects. Following table shows existing and proposed sewage treatment plants.
| Existing and Proposed Sewage Treatment Plants | ||||||
| Location | Existing Capacity (MLD) | Capacity as per Package-I | Capacity as per Package-II For 2026 | Capacity of Proposed STP (MLD) | ||
| For 2026 | For 2041 | Total capacity in2041 | ||||
| Tapovan | 130.00 | - | - | - | 9.00 | 139.00 |
| Makhamalabad | - | - | - | 27.00 | 18.00 | 45.00 |
| Agartakli | 70.00 | 70.00 | 40.00 | - | 67.00 | 177.00 |
| Chehedi | 42.00 | - | - | - | 28.00 | 70.00 |
| Panchak | 28.50 | - | 32.00 | - | 43.0 | 103.50 |
| Kamtwada | - | - | - | 36.00 | 18.00 | 54.00 |
| Pimpalgaon Khamb | - | - | - | 32.00 | 22.50 | 54.50 |
| Gangapur | - | - | 18.00 | - | 10.50 | 28.50 |
| Total | 270.50 | 70.00 | 90.00 | 95.00 | 216.00 | 671.50 |
Source - NMC
To extend coverage and to cater future demand, NMC has prepared a master plan for underground drainage system. The projected sewage generation for the year 2041 is 668.75 MLD. The projected capacity for sewage treatment for year 2041 is 671.50 MLD.
8.2.1 Storm Water Drainage
There is no comprehensive storm water drainage system available in the city. The ground slopes are steep in certain areas (Panchavati area), especially near Godavari and its tributaries. The average low lying ground level is 569 m. and the highest ground elevation is at 700 m. The old city is located at low lying areas while the developed area are mostly on higher grounds. There are 3 main river basins in corporation area as under.
-
The Godavari River flows west to east across approx. 18 Kms. of the central area of the city. Nearly 8 nallas meet the river Godavari in this stretch.
-
The river Nasardi also flows west to east and joins the Godavari on south bank at Takali.
-
The river Darana flows at the south eastern boundary of NMC, and its tributary Waldevi flows from the north-west to south-east and meets Darana near Chehedi.
8.2.2 Natural Drainage
Total area of Godavari basin from Nashik Municipal Corporation limit is about 14022 Ha. The drainage basin of Godavari covers major portion of corporation area. Godavari basin is further divided into two sub-basins. Various nallas and streams lying in these sub-basins carry rainwater from the basin area and discharge into respective rivers.
-
Godavari Left Bank Drainage Sub-basin.
-
Godavari Right Bank Drainage Sub-basin.
-
Nasardi Tributary Basin.
4. Valdevi Tributary Basin- It is Darna River's Basin.
Most of these nallas are not trained. NMC have constructed pucca pitching lining in few of the nallas. Rapid urbanization and unplanned building construction activities has caused blocking or reduction in waterways of the nalla. Roadside storm water drains exist at few locations only especially in the highly developed city area. During heavy rains, inundation and flooding are observed at number of locations, where natural course of nalla are contracted due to unplanned development activities.
8.3 Disposal of Urban Waste:
8.3.1 Solid waste generation status:
The Nashik Municipal Corporation is collecting about 370 MT of municipal solid waste per day. All the waste from different areas are collected and transported to MSW facility at Pathardi which is 15 km from core area. The bio hazardous waste generated by hospitals in the city is treated at 1000o C in an incinerating plant located near Kannamwar Bridge (near core area). With better collection and transportation measures, the collection efficiency should increase. It is estimated that the projected quantity of municipal solid waste will be 1200 TPD by the year 2031.
Analysis of city waste carried out recently reveals 47% easily compactable materials, 31% non-bio-degradable and 22% other waste. These, last 2 components have become a major cause of concern. These materials are a negative contributor to the processing plant efficiency and rapidly exhaust available land for land filling. Mounting heaps of high volume of low density waste is common scene around each compost plant.
8.3.2 Municipal solid waste Management:
Nashik Municipal Corporation has abolished the waste bins system and introduced door to door collection of waste through ghanta gadis' from 1996 (Vehicles with bells). Each ward has at least one ghanta gadi. A total of 124 ghanta gadis are on contract, including one driver and two helpers per vehicle. Nashik Municipal Corporation collects garbage from households, hotels and restaurants, commercial establishments, hospitals, etc. following table shows the numbers of establishments.
| Number of Establishment | |
| Establishment type | Numbers covered |
| Household | 2,69,657 |
| Other than residential | 44,634 |
| Mix user | 7,013 |
| Industrial | 3,220 |
| Total | 3,24,524 |
Source - NMC
Nashik Municipal Corporation uses full-size and mini-trucks as well as tractor trailers to transport solid waste collected by Ghanta Gadis to the waste disposal sites. The Municipal Solid Waste (MSW) facility established at Pathardi, about 15 km south of the city towards Mumbai, has a variety of processing units to treat different types of MSW. These processes are:
i) Pre-Sorting Unit :
It is electromechanical segregation system for incoming non segregated MSW with the capacity of 500 TPD and it comprises of two lines with all necessary requirements and materials. After mechanical segregation, compactable material goes to windrow composting, material with calorific value goes to RDF plant and inert will be further processed at inert processing plant.
8.4 Power Supply:
Eklahare Thermal Power Plant located in village Eklahare, near Nashik Road, caters to the power demand. From there, power is fed into the western division grid and subsequently distributed to substations and finally to households.
| Power consumption (MW) in last 5 years | |||||
| Years | 2009-10 | 2010-11 | 2011-12 | 2012-13 | 2013-14 |
| No of consumers | 158900 | 163980 | 209120 | 258980 | 310443 |
| Power in Residential (MW) | 140 | 157 | 179 | 203 | 228 |
| Power in heavy Industries (MW) | 220 | 245 | 271 | 298 | 327 |
| Power in light Industries (MW) | 26 | 29 | 33 | 39 | 47 |
| Power in Commercial (MW) | 35 | 39 | 44 | 51 | 60 |
| Power in Other (MW) | 18 | 20 | 24 | 31 | 41 |
| Total load | 439 | 490 | 551 | 622 | 703 |
| Load Growth (KW) | 10.6 | 11.6 | 12.44 | 12.88 | 13.02 |
Source : MSEDCL
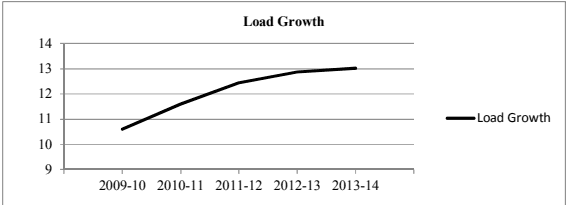
Fig : load growth (power consumption)
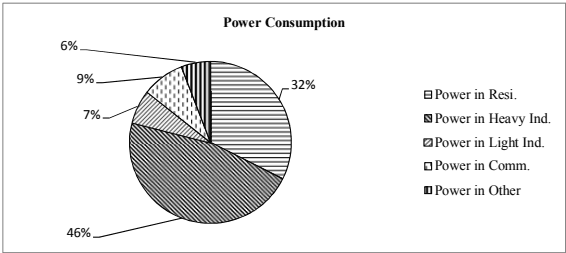
Fig. : Consumption of power in different Sectors
Its seems that power consumption is increasing substantially and share of heavy industries is significant.
8.5 Fire Brigade Station
There are 4 existing Fire Brigade stations at following locations.
1.Head Quarter at Shingada Talav,
2.Panchvati
3.Satpur MIDC
4.Durga Udyan, Deolali gaon.
Considering the spread of the city, more fire brigade stations are required.
8.6 Library & Study Centres
At present there are 14 libraries and study centres in the city.
Above mentioned study of existing amenities / facilities will help in formulating the proposals of the Development Plan.