3.1 Growth of Population
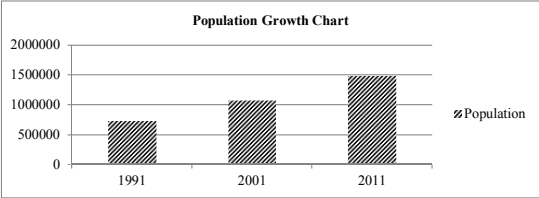
As per the 2011 census, the total population of the entire area of Nashik Municipal Corporation, was 14,86,053 souls as against the 2001 census population of 10,77,236 souls, indicating the growth rate of 37.95% during 2001-2011 decade. Similarly, population for 1991 was 7,33,000 souls indicating decadal growth of 46.96%. Following Table shows decadal population growth.
| Population Growth | |||
| Year | Population | Decennial variation | Percentage Variation |
| 1 | 2 | 3 | 4 |
| 1991 | 733000 | -- | -- |
| 2001 | 1077236 | 344236 | 46.96 |
| 2011 | 1486053 | 408817 | 37.95 |
3.2 Structure of Population
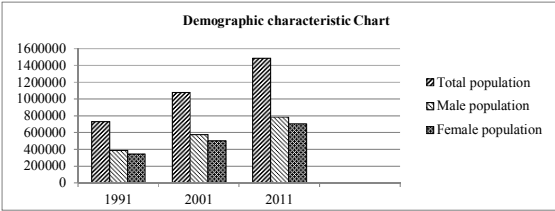
The sex ratio for Nashik Municipal Corporation as per 2011 census works out to be 899 female per 1000 male as against the respective sex ratio figures of 929 for Maharashtra State. Out of total population of 14,86,053 persons, the number of males are 7,82,517 and 7,03,536 are female. Following table shows structure of population for last two decades.
| Demographic characteristic (sex and age composition) | ||||||
| Year | No of person | Males | % of total males | Female | % of total female | No of females per 1000 males |
| 1 | 2 | 3 | 4 | 5 | 6 | 7 |
| 1991 | 733000 | 388000 | 52.93 | 345000 | 47.06 | 889 |
| 2001 | 1077236 | 575737 | 53.44 | 501499 | 46.55 | 871 |
| 2011 | 1486053 | 782517 | 52.66 | 703536 | 47.34 | 899 |
3.3 Distribution of Population
On the basis of 2011 census figures, the population density of Nashik Municipal Corporation is 5556 persons per sq. km. The municipal corporation is divided into 61 wards. Table below gives village wise area & approximate population, gross density as per 2011 census. The highest gross density of 250.13 persons per hectare is in village Kamathwade. The lowest gross density of 4.22 persons per hectare is in village Dadhegaon.
| Distribution of population -Year 2011 | Distribution of population -Year 2011 | Distribution of population -Year 2011 | Distribution of population -Year 2011 |
| Village | Area in hectare | Approx. Population | Gross density per hectare |
| 1 | 2 | 3 | 4 |
| Makhamalabad | 2667.60 | 45917 | 17.21 |
| Mhasarul | 1861.82 | 39463 | 21.20 |
| Adgaon | 3329.65 | 22749 | 6.83 |
| Manur | 370.60 | 5253 | 14.17 |
| Nandur- Dasak | 446.52 | 7796 | 17.46 |
| Nashik | 5080.23 | 663979 | 130.70 |
| Anandwali | 396.15 | 21369 | 53.94 |
| Gangapur | 763.65 | 33085 | 43.32 |
| Pimpalgaon Bahula | 686.83 | 43224 | 62.93 |
| Satpur | 1227.02 | 90313 | 73.60 |
| Kamathwade | 193.79 | 48473 | 250.13 |
| Ambad | 732.06 | 43225 | 59.05 |
| Chunchale | 804.95 | 35292 | 43.85 |
| Pathardi | 1911.67 | 26332 | 13.77 |
| Dadhegaon | 243.63 | 1027 | 4.22 |
| Pimpalgaon Khamb (Part) | 520.00 | 6306 | 12.13 |
| Vadner Dumala (Part) | 697.00 | 10146 | 14.56 |
| Wadala | 790.27 | 56173 | 71.08 |
| Agartakli | 334.42 | 40224 | 120.28 |
| Dasak | 383.26 | 53499 | 139.59 |
| Panchak | 301.53 |
3.4 Occupational Structure and Employment Pattern
Table given below shows the occupational structure within municipal corporation area of Nashik as per census 2011.
The total population of the city i.e. municipal corporation as per 2001 census was 10,77,236 souls out of which 5,75,737 were males and 5,01,499 were females forming ratio of 871 females per 1000 males. The total working population in the city was 3,71,423 both including main and marginal workers which works out to be 34.48% of the total population.
Contribution of females in the working population was comparatively less i.e. about 68,572 females forming only 18.46% of the total working population.
The population as per 2011 census is 14,86,053 souls out of which 7,82,517 are males and 7,03,536 are females forming ratio of 899 females per 1000 males. The total working population in the city is 5,34,821 both including main and marginal workers, which works out to be 35.99% of the total population.
Contribution of females in the working population is comparatively less i.e. about 1,08,670 females forming only 20.32% of the total working population.
It is observed from the census figures of 2001 and 2011 that the work force engaged in primary sector and secondary sector is gradually decreasing and workforce engaged in tertiary sector is considerably increased. Table below shows the statement of occupational structure in the city as per census 2011.
| OCCUPATIONAL STRUCTURE | OCCUPATIONAL STRUCTURE | OCCUPATIONAL STRUCTURE | OCCUPATIONAL STRUCTURE | OCCUPATIONAL STRUCTURE | OCCUPATIONAL STRUCTURE | OCCUPATIONAL STRUCTURE |
| Sr.No. | Sector | Occupation | Male | Female | Total | % |
| 1 | Primary | Cultivator | 9187 | 4400 | 3586 | |
| 2. | Agriculture | 7136 | 53334 | 12470 | ||
| Total | 1322 | 9724 | 26056 | 1.75 | ||
| 3 | Secondary | Houshold Industries | 7964 | 6721 | 14685 | 0.99 |
| 4 | Tertiary | Other workers | 401865 | 92215 | 494080 | 33.24 |
| 5 | Total workers | - | 426151 | 108670 | 534821 | 36.00 |
| 6 | Non workers | - | 356366 | 594866 | 951232 |
3.5 Functional Classification
The occupational categories are grouped in four sub-head viz. (1) Cultivators (2) Agriculture (3) House hold-Industry (4) Other workers. If any of these individual components has more than 40% of the total workers, the area is classified as Mono-functional. If it is not so and if the total of the percentages of first two important categories is more than 60% of the area, it is said to be bi-functional. As these criteria are not applicable in case of Nashik Corporation area, the same has to be termed as multi-functional town.