Census data on nine fold classification of occupation structure for 1991 and 2001 is presented in Table 7-3. There is a substantial increase in workers in other services, transport and construction, which is in line with share of sectoral contribution.
Table 7-3Nine-Fold Classification of Census Workers 1991 and 2001
Year
1991
% share
2001
%
Cultivators
96769
5.92
78439
3.28
Agricultural labourers
75314
4.6
38091
1.59
Livestock and Allied
15894
0.97
18766
0.78
Mining & Quarrying
13099
0.8
14766
0.62
HHI
21606
1.32
57799
2.42
Non HHI
492149
30.08
640958
26.8
Construction
133070
8.13
231886
9.7
Trade and Commerce
321086
19.63
418471
17.5
Transport
124240
7.59
212327
8.88
Other Services
342760
20.95
680146
28.44
Main Workers
1635987
100
2391649
100
Source: Primary Census Abstract, Census, 1991, 2001.
7.3Workers
The work force participation rate has increased from 34.27% in 1991 to 44.14% in 2011. This increase in the workforce can be attributed to the growth in employment opportunities and thus inmigration and also increase in the women workforce. The growth trend of WFPR over three census years is presented in Table 7-2.
AUTHORITY ★
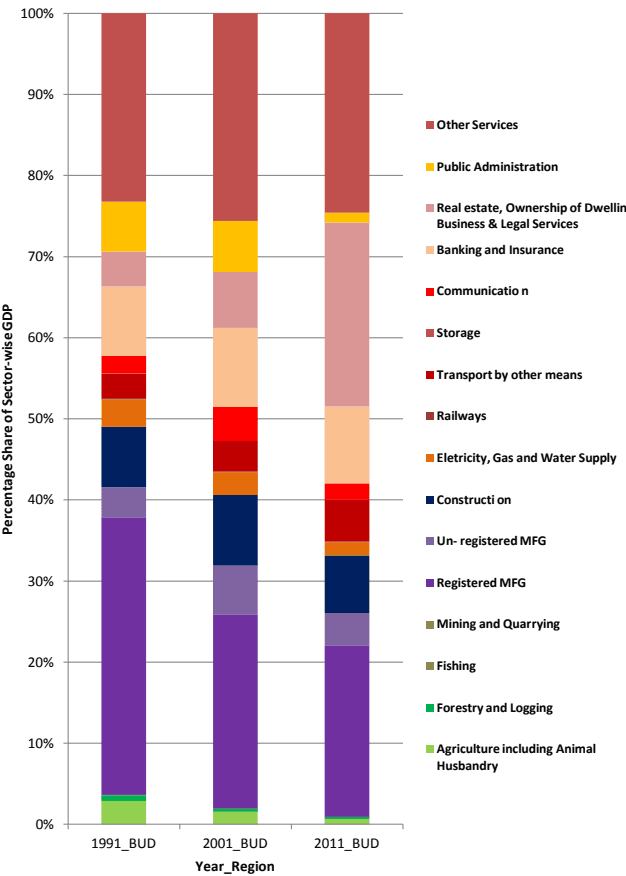
Figure 7-1: Sectoral GDDP Share trends for Bengaluru Urban District (1991, 2001 and 2011)
Source: Economic Survey of Karnataka, 1993, 2001 and 2011
Table 7-2Workforce Participation Rate (WPR)
Year
Bengaluru Urban District7
Total Population
Total Workers
WFPR
1991
4839162
1658298
34.27
2001
6537124
2566914
39.27
2011
9621551
4246927
44.14
Source: Census of India, 1991, 2001 and 2011 and Consultants Analysis 2015
7.2Major Sectors of Economy
T e Major s are o Karnata a GSDP as een coming from Bengaluru Urban District. In the year The Major share of Karnataka GSDP has been
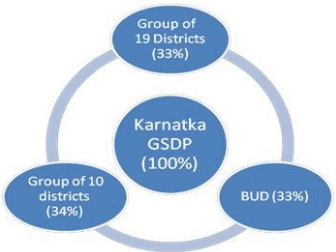
2014-15, Bengaluru Urban District alone has contributed 1.73% to India’s GDP and 34.36% to Karnataka GSDP. The contribution of Bengaluru Urban District to GSDP of Karnataka has increased from 26.24% (2004-05) to 34.36% (2014-15). The Gross district domestic product of Bengaluru Urban has been highest during 2004 to 2015. It is important to note here that it takes combined GDDP of 10 following districts to equal to GDDP of Bengaluru Urban District. The GDDP of BUD has increased by 4.40% between 1999-00 and 2011-12 whereas at the State level it has increased by 2.94 times and at the National level 2.33 times during the same period.
Major sectoral contribution to the economy of BUD is from manufacturing and tertiary sector, though the contribution of manufacturing has reduced steadily from 1991 to 2011. As on 2011, three sectors, 1) Others Services, 2) Real estate, Ownership of Dwellings, Business & Legal Services and 3) Manufacturing are the main pillars of economy as they constituted
Largest Biotechnology Hub in India
Largest Software Exporter in India (Exports from IT - 1,74,418 crores (2013-14)
CAGR of Exports from IT in Bengaluru 17.29% (2007-2014)
For 1 Job in IT/ITES sector, 2.7 other jobs are created (Direct Employment - 9,40,000; Indirect Employment - 26,00,000)
CAGR of Number of IT companies in Bengaluru 3.40% (2007-2014)
80% of global IT companies have based their India operations and R&D centres in Bengaluru.
Bengaluru is not just an IT/ITES centre but also economic leaders in Light and Heavy engineering, Automobiles, Earthmovingand Aeronautics industries.
24.6%, 22.7% and 21% of total GDDP (2011) respectively.
There is a steep growth in Real estate sector, Business & Legal Services from 2001 to 2011 with its sectoral share increasing from 4.3% to 22.7% during 1991 to 2011. However, the share of manufacturing has reduced from 34.2% to 21.1% during 1991 to 2011. The other important sector – public administration reduced during the same period from 6.1% to 1.2%. Further, the contribution of construction (~8%) and other services (~23% to 25%) have more or less remained constant during past three decades. Figure 7-1 presents the sectoral GDDP share trends for BUD over 1991 to 2011. It is expected that Other Services (includes IT/ITES), Manufacturing, Real Estate, Business, and Banking and Insurance are going to retain dominant position in Bengaluru’s GDDP.
7.5Current State of Industries
1. Employment by Type of Industries:
The types of industries are classified into two categories namely manufacturing and Services. About 35000 industries are located in the Bangalore Urban District, of which about 78% manufacturing industries and the remaining 22% service industries. Total employment generated in the industries was about 13 lakhs. The service industries contributed maximum of about 62% of total employment and 38% contributed by manufacturing industries.
Since the economic data is available for Bangalore Urban District, the analysis is done for Bangalore Urban District. This is also justified since 94% of population and workers of BUD is from BMA.
BANGALOE AUTHORITY ★
2. Scale of industries:
Out of 35,000 industries located in the Bangalore Urban District, the micro industries were dominated about 78% of total industries and followed by 19% small scale industries. Mega scale industries accounts for about less than 1% of total industries. The total employment generated in the sector was about 13 lakhs. The large and mega scale industries contributed maximum of about 66% of total employment, small & micro industries provided about 30% and the remaining 4% contributed by medium sale industries. Total of 7115 factories were located in the Bangalore Urban District, of which about 94 percent are non-pollution industries and the remaining 6% are polluting industries.
3. Classification of Industries Based on NIC 2008 Classification:
The Analysis of industrial data for 35000 industries within BUD, classified by type or investments are registered or approved by different departments has revealed that machine tool manufacturing, fabrication of metal products, manufacturing of electronic components, manufacturing of textile and its finishing, manufacturing of food products and manufacturing of motor parts and general purpose machinery are some of the major industrial sub-sectors in Bengaluru Urban District. Manufacturing of plastics, printing and related activities, and trade and commerce activities also have a significant share in the economy.
7.8Establishments
1. Nature of Establishments
Establishments as defined by The Shops and Establishments Act, 1 9 6 1 8 , includes all premises where goods are sold either by retail or wholesale or where services are rendered to customers, and include an office, a store-room, godown, warehouse or workhouse or work place. Establishments are defined as shop, a commercial establishment, residential hotel, restaurant, eating-house, theatre or other places of public amusement or entertainment. Further, establishments as defined by the act may also include such other establishments as defined by the Government by notification in the
Act,
8The Karnataka Shops and Establishments 1961 is derived from the Central Shops and Establishments Act, 1953
BANGALOE AUTHORITY ★
Official Gazette. The premises not covered under the definition of shop or commercial establishments are those registered by the Factories and Boilers Act and industries.
Directorate of Economics and Statistics, Government of Karnataka (GoK), gives the details of the Establishment Census9at City and District levels for the state. Of the total establishments in the state, share of Bengaluru Urban District is 14% with about 3,97,900 number of registered and unregistered establishments, of which 91.5% are urban establishments and 8.5% are rural establishments.
Out of the total establishments in Bengaluru Urban District (BUD), there are only 12.7% registered establishments in BUD. Employment in establishments in the district is 16 lakh (2013-14) contributing to 38% of the workforce of BUD. Although Bengaluru is the administrative capital and houses many administrative establishments, its share is less (2.1%) compared to 89.6% establishments that are proprietary based. The rest 8.3% of establishments are Partnerships, Companies, Self-Help Groups, Co-operatives, Non Profit Institutions or Others.
Table 7-4Establishments by number of Workers in Bengaluru Urban District
District
Single
2 to 7
8 to 15
16 to 25
26 to 50
51 to 100
>100
Bangalore Urban
168369
202712
13157
4076
2732
1057
991
Percentage Share
42.3
50.9
3.3
1.0
0.7
0.3
0.2
Source: Establishment Census, Directorate of Economics and Statistics, GoK, 2013-14
2. Spatial Distribution of Establishments in BBMP
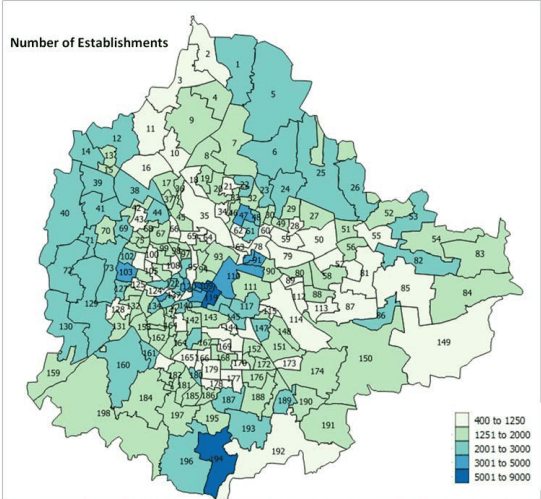
The total number of establishments in Bengaluru Urban District is 3,97,913, of which 3,63,933 (91%) are in BBMP. Chikpete (Petta), Dharmarayaswamy Temple Ward (Petta), Gottigere, Sampangiram Nagar (Petta and Shivajinagar), K.R.Market (Petta), Padarayanapura, Bharathi Nagar (Shivajinagar), Kaveripura, Cottonpet (Petta), Devarajeevanahalli, and Shivaji Nagar are wards with concentration of more than 3000 (up to 9000) establishments, clearly defining the Central Business District to be Petta, Shivajinagar (and MG Road – in terms of office spaces) areas.
As seen in Figure 7-4, number of establishments is also high in the west and north-east BBMP. The wards with least number of establishments are wards with defence areas, or with natural constraints such as lakes or reserved forests or industrial areas. Residential areas also have presence of many establishments.
Establishments with more than 8 workers are concentrated in the areas falling under wards of CBD(Shivajinagar and in and around MG Road), Peenya Industrial area, Koramangala ward, Kottigepalya, Vrushabhavati, Deepanjali Nagar, Bapuji Nagar, Pattabhiram Nagar, BTM, Chickpet, Gandhi Nagar, Mangamanapalya, Hoysala Nagar and Hosathippasandra. These wards are major work centres and would need special focus on accessibility.
Establishments that have export units are concentrated mainly in Cottonpete and Peenya Industrial Area wards. They are also present in Devasandra, Vasanth Nagar, Hongasandra, Kavisandra,
Yelachanahalli, Gaali Anjaneya Swamy Temple ward, Deepanjali Nagar, and Vrushabhavathi ward. These are wards with either IT/ITES companies or manufacturing units.
Figure 7-4: Ward-wise concentration of number of Establishments in BBMP
Source: Establishment Census, 2013-14, Directorate of Economics and Statistics, Government of Karnataka (GoK)
7.6Special Economic Zones in BMA
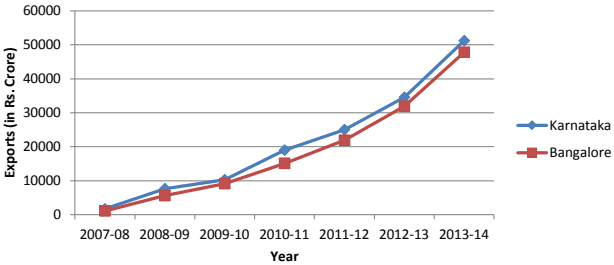
Among the SEZs that are operational and under implementation in Bengaluru, majority of them are IT/ITES. Availability of infrastructure like power and ready markets, availability of skilled human resource and existing strong sector base with enabling policies are encouraging the SEZ growth. Exports and hence overall GDP is expected to grow exponentially even with marginal increase in the employment. Exports from SEZ have been growing steadily and most of IT/ITES export from State happens from Bengaluru.
Figure 7-2: Exports from SEZs
Source: Visvesvaraya Industrial Trade Centre (VITC), GOK, 2014 and Master Plan Analysis, 2015
7.7 Industrial Infrastructure within BMA
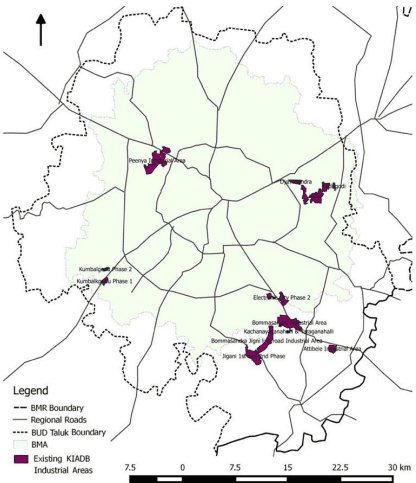
Karnataka Industrial Areas Development Board (KIADB) has several industrial estates within BMR and majority of them are in the BUD. Spatially the industrial areas are located in the North-West, East and South-East of BMA. Jigani and Bommasandra Industrial estates partly fall within BMA and Attibele is located outside BMA in Anekal Taluk. Figure 7-3 shows the spatial spread of Industrial Areas in BUD.
Figure 7-3: KIADB Industrial Areas in and around BMA
Source: KIADB, 2014 and Consultant’s Analysis, 2015
7.9Hierarchy of Commercial Areas/ Markets
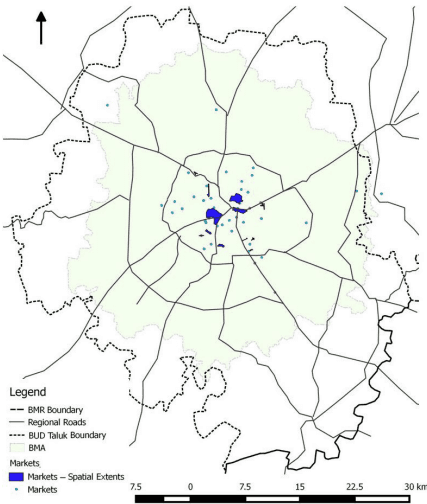
Commercial areas in Bengaluru can be grouped under three categories: commercial areas along the street, commercial areas concentrated in markets and office spaces. There are 28 major and important markets within BMA (Figure 7-5). These markets have been placed under hierarchy based on following considerations:
Population growth rate of wards – Wards with negative decadal population growth (2001 to 2011) were considered to be highly commercialised which coincides with the number or extent of the markets present in the wards
Concentration of market places – Wards with dense commercial areas (Chickpet, Gandhi Nagar, Koramangala) were given higher weighs than the wards with lesser density of commercial areas (HSR Layout, Domalur, etc)
• Extent – Approximate extents of the markets has been used to determine the weightage
BANGALOE AUTHORITY ★
Distance from the Core – The wards with Chickpet/Shivajinagar/MG Road were considered core and got the highest weight; the markets moving outwards got lower weight
1 s t Order Markets: Petta, MG Road (Also Brigade Road, Commercial Street), Shivajinagar10, Gandhi Nagar, KR Market, and Kalasipalya being within the Central Business District.
2 n d Order Markets: Jayanagar Shopping Complex, Malleshwaram, Yeshwanthpur fish, fruits and vegetable markets, Madiwala market, etc. are acting as District Centres.
3 r d Order Markets: Cox Town, Moore Road, and a few BDA complexes are assigned as Community Centres.
4 t h Order Markets: The smaller markets such a S , Chikka Mavalli, L N Pura Market, Srirampura, Yadiyur, etc., are assigned as Housing Clusters.
Figure 7-5: Markets in BMA
Source: Master Plan Analysis, 2015
CBD,
10 Russell Market, Tarpaulin Market, Automobile Parts/Scrap Market, Bamboo bazaar and Furniture Market are although District Centres/Community Centres according the weights assigned, since they are located near each other and are next to core, together they form part of CBD. In other words, they are contiguous to core and hence are part of distinct only based on the specialization of goods sold.
7.11Workforce Participation and Employment Projections
The workforce participation rate for BMA, as per Census, in 2011, is 43.9%, which has increased from 33.4% in 1991, indicating 5% increase in every decade. As per Census 2011, the male workforce participation is at 61.87%, whereas female work participation is 24.42%. The female participation rate has increase from 11.88% in 1991 to 24.42% in 2011, which is still lower that national (31.1%) and state average (34.4%). Table 7-8 presents the workers by sex for past three decades.
BANGALOE AUTHORITY ★
Table 7-8Comparison of Work Force in BMA
S.No
Year
Workers
Male
% of Male
Female
% of female
Total
% to total population
1
1991
1258609
52.8
255214
11.8
1513823
33.4
2
2001
1877261
57.7
533701
18.1
2410962
38.9
3
2011
2917774
61.8
1057196
24.4
3974970
43.9
The employment projections for the year 2031 have been made based on the projected population in different age groups. As per the assessment, 73.05% of male and 73.55% of the female population would fall in the age category of eligible workers (16-60). Of the eligible male and female population around 65% and 35% are projected to be workers amongst males and females. The projection of demand for jobs up to 2031 has been estimated and given in Table 7-9.
Table 7-9Employment Projections for BMA
Description
2011
2021(E)
2031(E)
Total Population
9044664
13551445
20320805
Eligible Workers (16-60 Group)
68.14%
70.30%
73.28%
Eligible Workers
6163034
9526666
14891086
Male Population (52%)
4715935
7046751
10566819
Female Population (48%)
4328729
6504694
9753986
Eligible Male Workers (%)
68.62%
70.83%
73.05%
Eligible Male Workers
3236075
4607274
7719061
Eligible Female Workers (%)
67.62%
70.58%
73.55%
Eligible Female Workers
2927087
4591013
7174057
Male Willing to Work (% of Male Workers)
61.87%
63.44%
65.00%
Male Willing to Work
2917774
4470125
6868432
Female Willing to Work (% of Female Workers)
24.42%
29.71%
35.00%
Female Willing to Work
1057196
1364054
2510920
Total Workers
3974970
5834179
9379352
Additional Jobs (over 2011)
0
1859209
3545173
Chapter 7Economy
7.1 Economy of Bengaluru- The Historical Perspective
Bengaluru’s economy is diverse and has evolved from historic focus on trade and commerce centre and its shift to Public Sector Undertaking (PSU) to the recent shift to manufacturing and IT/ITES sector. Although the major drivers of the economy have changed, the sectors which have existed historically have remained as cornerstones and are significant in the present scenario. Aerospace, IT, BT and manufacturing e-commerce and transport/logistics are expected to be driving sectors in the future. Bengaluru has also emerged as the start-up hub of the nation, bringing innovation and contribution to GDP, diversity of economy and adding to employment opportunities.
Bengaluru started as trade centre in 1537 from Petta area and grew when Bengaluru was chosen as a British Cantonment and an administrative headquarters in 1800s. Binny Mills, Tata Silk Farm (Basavangudi), Indian Tobacco Company (Cox Town), United Breweries, Government Soap Factory (now Yashwanthpura), Minerva Mills, Government Porcelain Factory were the major contributors to the economy of Bengaluru before 1940. During 1940s to 1960s, the government invested heavily into large public sector units like HMT, BEL, BHEL, HAL and ITI. Industrial areas like Rajajinagar, Dyavasandra started around 1960s. In 1978, Electronic City was established for encouraging electronic industries to be set up which has now become one of the two major IT nodes of the city, catering to the world. Table 7-1 presents the quick chronological economic timelines for Bengaluru.
Table 7-1Key Economic Timelines OF Bengaluru
Year/Period
Key Initiations
1537
Founding of Bengaluru: Sir Kempegowda I (1513-1569), a local cheftain in the Vijayanagar Empire, builds the town of Bengaluru in the Yelahanka province. His son builds the famous four watch towers
1800 - 1900
British encourage trading in Bengaluru but discourage manufacturing
1809
South India's largest Cantonment is established at Ulsoor near Bengaluru
1831 - 81
Under direct British rule, Bengaluru becomes administrative head-quarters of the state
1850
The British revamp the administration; introduce railways, posts and telegraphs
1859
The first railway, from Bengaluru to Jolarpet, commissioned
1888
Binny Mills
1905
Fist Indian City to get electrified
1906
Tata Silk Farm established south of Basavangudi (the farm no longer exists)
1912
Indian Tobacco Company (ITC)
1915
United Breweries
1918
Government Soap Factory
1919
Minerva Mills
AUTHORITY ★
Year/Period
Key Initiations
1932
Government Porcelean Factory
1937
Bengaluru connected by air to Bombay by Indian Aviation Development Co. - Air Services
1940
HAL established
1940
Bengaluru Transport Company Ltd. commences operation with a fleet of 20 buses
1946
Indian Telephone Industries (ITI)
1946
Kirloskar Electric Company
1953
Hindustan Machine Tools (HMT)
1954
Bharat Electronics Ltd. (BEL)
1954
Bengaluru Stock Exchange opened
1960
Rajajinagar Industrial Estate formed
1962
Bengaluru Transport Company nationalised as Bengaluru Transport Service
1966
Mysore Sales International Ltd.
1940 - 60s
The government invested heavily into large public sector units like Hindustan Machine Tools (HMT), Bharat Electronics Limited (BEL), Bharat Heavy Electricals Limited (BHEL), Hindustan Aeronautics Limited (HAL) and Indian Telephone Industries (ITI)
1955
Government of India undertakings in hi-tech areas viz. aircraft, telephones, machine, tools, electronics established in Bengaluru
1961 - 71
Industrial townships of HAL, BEL, HMT and ITI built
1968
Dyavasandra Industrial Area was established by KIADB and first unit was registered
1970
High-technology industries, institutions of higher learning and favourable climate help Bengaluru become the science and technology capital of India
1970s
Peenya Industrial Estate
1978
Electronics City
1984
Wheel and Axel Plant
1980-94
Bengaluru becomes the preferred location for computer hardware and software companies, making it the "Silicon Valley of India"
1995
International Technology Park established
2008
Bengaluru International Airport constructed
(Expected)
Industrial Developments around International Airport
Sources: Census of India (2001), Bengaluru through the Ages, Provisional Population Totals, Rural Urban Distribution; Websites of the Public Sector Undertaking (PSUs) and Industrial Areas (accessed on 24th February 2015); Interactions of the Consultant with representatives of stakeholder groups.
Economic activities in the urban area has direct implications on the city fabric and structure like employment opportunities, densities, level of interaction between employment nodes, employment pattern and so on. Thus it is important to understand how city economy is connected to its region and structure of economy within the urban area.
AUTHORITY ★
7.10Employment by Sector
The workers residing in the area are considered as the census workers, and employment is the workers employed at given location. Workers data as per Census has been used to derive the Work Force Participation Rate and is presented in Table 7-5. WFPR for BMA has increased from 33.7% to 44% during 1991 to 2011 period.
Table 7-5Workforce Participation Rate Trend BMA, BUD and BMR
WPR Area/Year 1991 2001 2011
BMA
33.7
38.9
44.0
BUD
34.0
39.5
44.3
BMR
36.5
41.2
44.9
Source: Primary Census Abstract, Census 1991, 2001, 2011
Table 7-6 presents the estimated workers and employment in BMA and BMR for 2016.
Table 7-6Existing (2016) Population, Workers and Employment in BMA and BMR
Area/Ratio Population 2016 (in Lakh) Workers 2016 (in Lakh) Employment 2016 (in Lakh)
BMA
110
49
55
BMR
137
62
68
BMA:BMR Ratio
0.80
0.79
0.81
Note: Population and Workers data source is Census 2011. 2016 population and Workers are estimated based on the CAGR of previous decade. Employment is estimated for 2016 based on Industrial Stakeholder Meetings, Real Estate Report and various Government Reports.
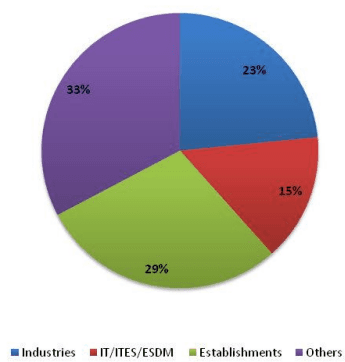
Data on workers for major sectors has been compiled from various sources:- Industries data from Karnataka Udyog Mitra and KSSIDC; IT/ITES data from Department of IT,BT and S&T; data on Establishments from Establishment Census, Directorate of Economics and Statistics11. The sectoral shares of workers are given in Table 7-7 and Figure 7-6 and it can be observed that industrial workers are about 23%, IT/ITES workers are 15% and workers in Establishments are 29%. The other sectors contribute about 33% of the total workers.
Table 7-7Sectoral Share of Workers
Sectors Employment % Share Employment
Industries
1300067
23.45%
IT/ITES/ESDM
830000
14.97%
Establishments
1600323
28.86%
Others including Street Vendors
1814538
32.73%
Total
5544928
100.00%
Source: District Industries Centre (DIC), Karnataka Udyog Mitra (KUM), Karnataka State Small Industries Development Corporation (KSSIDC), Department of IT,BTandS&T(DIT),2014-15 and Master Plan Analysis, 2016
Figure 7-6: Share of Major Sectors of Employment for Bangalore Urban District
Source: Master Plan Analysis, 2015
Peenya, Whitefield, Electronic city and parts of Bommasandra and Jigani are the areas with major concentrations of industries. Old industrial areas like Rajajinagar are slowly being converted to residential/commercial and industries are being pushed out. Existing industrial base is expected to continue but new industries are not incentivized when compared to other districts of the State. Industries are expected to be setup in BMR (dependency on city’s infrastructure). IT/ITES concentration is in Whitefield and Electronic city, but is also spreading in other parts of the city. Existing nodes with major employment are currently concentrated in BMA. Some of the major economic centres are: Peenya Industrial Area, Petta (Core area/Trade and Commerce), Electronic City and Whitefield (IT/ITES/ESDM), Jigani (Industrial/BT). In addition following are the areas in BMA and BMR where different industries are present.
Hoskote – KR Pruam: BPL, Bengal lamps and several other manufacturing units are spread along the NH-7 linking to the industrial area in KR Puram, which includes ITI and the Tin factory. United Motors and Heavy Equipment’s Private Limited located at KIADB industrial area is one othe major hi-tech engineering industry manufacturing spares of heavy earthmoving machineries. Bell Ceramics Limited, located in Chokkahalli village and the manufacturing unit of Volvo are also located in this area. The economy is product based manufacturing with a concentration of heavy engineering industries in the KIADB estate at Hoskote and textile, tobacco product. Oil refineries and silk manufacturing also dominate the economy of the area.
Bidadi – Harohalli: The Toyota factory in Bidadi industrial area is the major generator of activities, encouraging more industries located in this area. The existing industrial area at harohalli covers almost 1000 acres. The economy is product-based with manufacturing industries located in the existing Bidadi industrial area and Harohalli industrial area.
★
Nelamangala – Peenya: The economy is product based manufacturing with textile and other small and medium scaled manufacturing industries in the Peenya industrial estate. Other products contributing to the economy are horticulture and tobacco products.
Nelamangala: The economy is product based manufacturing with textiles and manufacturing – iron & steel, plastic, bio-tech, electronic and electrical and ancillary automobile in the KIADB industrial area.
Dodaballapur: The economy is product based dominated by the textile industry (silk weaving) and apparel parks. Other economics includes floriculture, wine industry and food processing.
Devanahalli – Yelahanka: The economy is product based manufacturing and textile industry with the proposed Hardware park and Aerospace park. Airport related freight and logistics services and horticultural activities are also dominant.
Jigani – Electronic City – Bommasandra – Attibele: The major attraction in the area that has caused industries to agglomerate in the region is the Electronic City in Bangalore. Industries along the entire stretch along NH-7 from Electronic city to Attibele, and beyond, to Hosur in Tamil Nadu from this area. Attibele located at the Tamil Nadu State border, Jigani, Bommasandra, Hebbagodi, Chandapura and Sarjapur are part of the industrial area. The industrial areas of Attibele, Jigani- Bommasandra contribute to the economy of the cluster. The industries concentrating around Sarjapur town and a few scattered ones along the Sarjapur-Attible road also form a part of the industrial cluster. Adjacent areas such as Hebbagodi, Dommasandra, Chandapur (a market town) and parts around Jigani and Anekal town serve as a residential base for the industrial area. This area has the internationally known multi-speciality hospital – Narayan Hrudalaya. The economy is product based secondary manufacturing and textile industry with the KIADB industrial area. Attibele is home for most manufacturing and textile industries. Automobile giants of India – TVS Motors and Ashok Leyand are very near to this area. Attibele, Bommansandra and the Jigani-Bommsandra industrial areas consist of manufacturing industries.
Ramanagara – Channapatna: The economy of the two major areas is mainly a product-based secondary sector economy with includes agro-based industry, tobacco products, toys and wooden products and enlarged segment of the workforce.