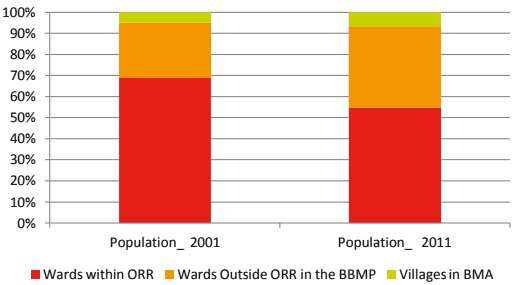
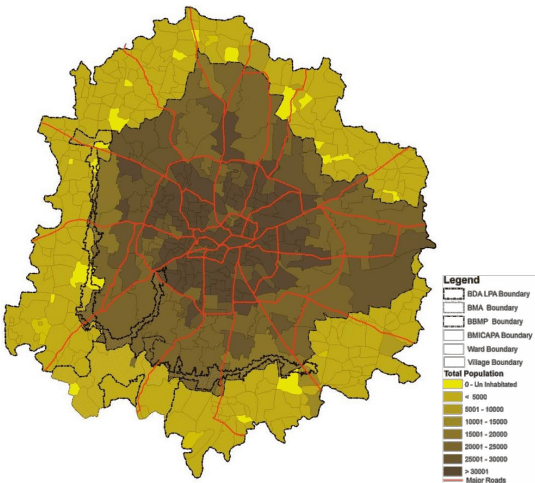
Population in BBMP and BMA has grown rapidly as evident from Table 6-1, which presents the growth of population in BBMP, BMA and villages within BMA for past five decades and Figure 6-1 presents the details of planning area.
| Year | BBMP | Villages in BMA | BMA | ||||||
| Population | GR% | CAGR | Population | GR% | CAGR% | Population | GR% | CAGR% | |
| 1971 | 1897826 | 113879 | 2011705 | ||||||
| 1981 | 3100811 | 63.4 | 5.03 | 157664 | 38.4 | 3.31 | 3258475 | 62.0 | 4.94 |
| 1991 | 4320297 | 39.3 | 3.37 | 209500 | 32.9 | 2.88 | 4529797 | 39.0 | 3.35 |
| 2001 | 5887853 | 36.3 | 3.14 | 302163 | 44.2 | 3.73 | 6190016 | 36.7 | 3.17 |
| 2011 | 8443675 | 43.4 | 3.67 | 600989 | 98.9 | 7.12 | 9044664 | 46.1 | 3.87 |
Source: Census of India Handbooks and Master Plan Analysis, 20115-16
Note: GR- Decadal Growth Rate between two Census Years, CAGR – Compounded Annual Growth Rate
BBMP has consistently experienced high growth rates though there are variations between the decades. The growth rate in villages in BMA has doubled during 2001 to 2011. Due to larger influence of BBMP in the BMA, the BMA trend line is following the BBMP and is susceptible to this pattern in future considering the large chunk of lands available for development in the surrounding villages. This requires a clear supporting policy and regulatory framework supported with measures
to make the agricultural land in the BMA as productive asset for facilitating conservation of the agricultural land.
Figure 6-1: Population Growth in BMA (2001 to 2011)
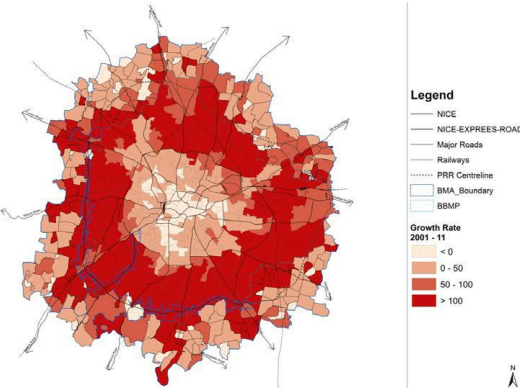
Assessment of growth rates within BMA in the past census decade (Figure 6-1), indicates that growth rates in most of the wards of the city’s core area (inside ORR) have been found to be in the negative, whereas a positive and a prominent growth rate is found in most of the wards belonging to the peripheral areas.