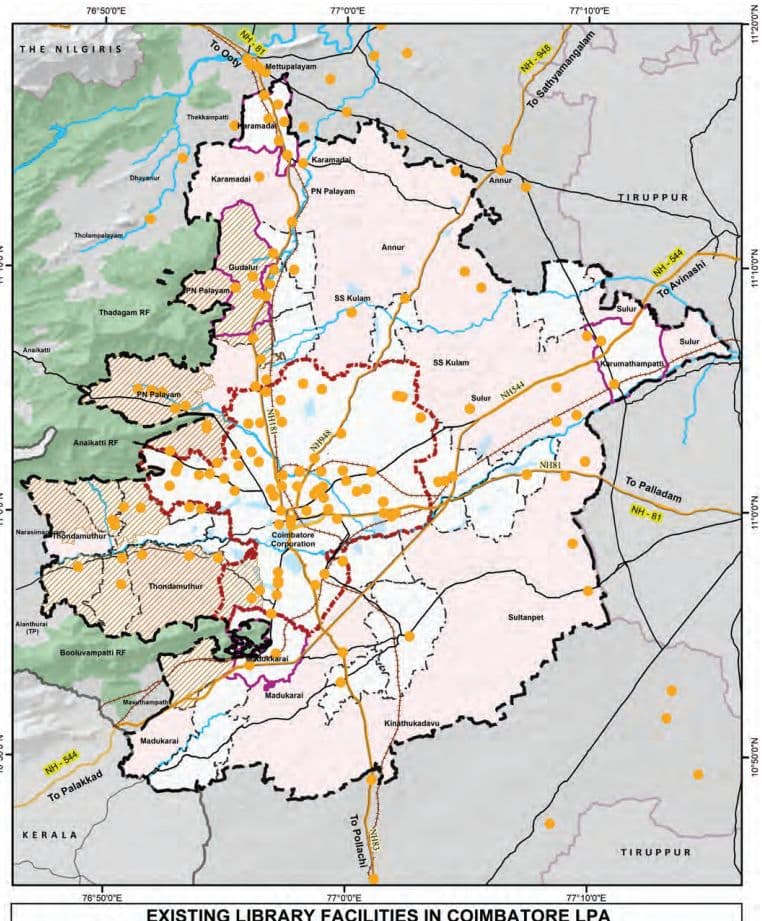
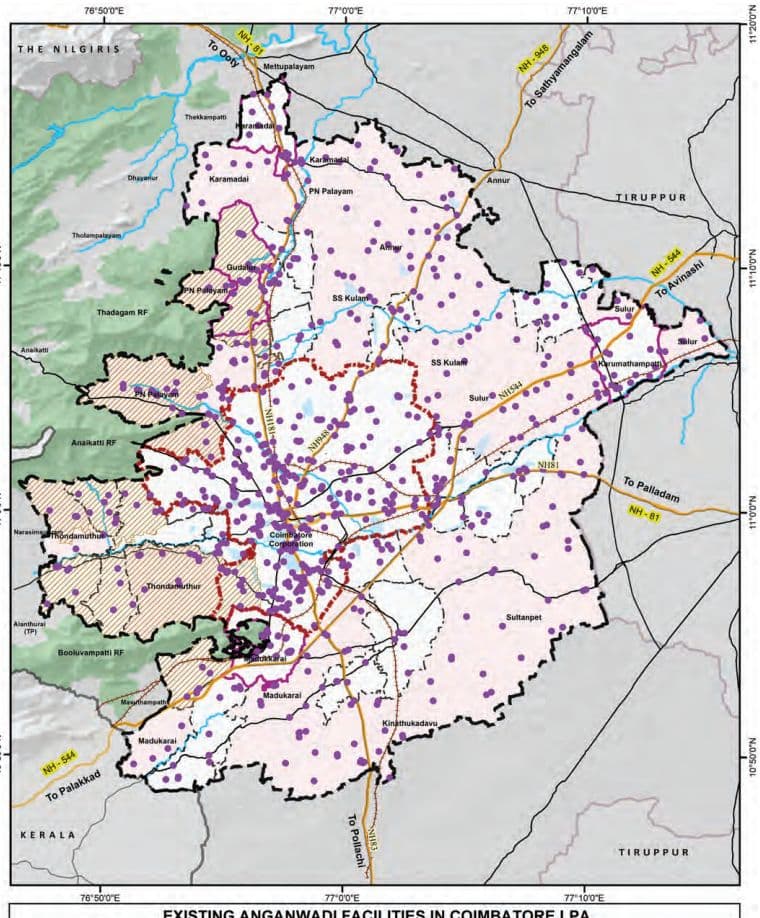
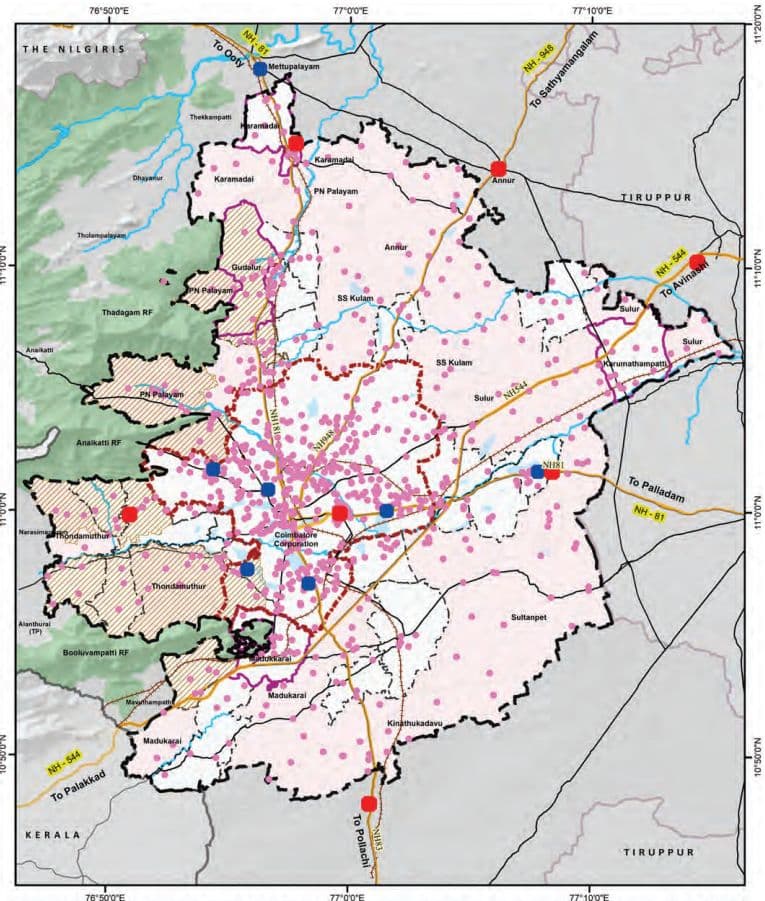
Population projection for Coimbatore LPA using various methods....496
Arithmetical increase method....496
Geometrical increase method....500
Housing - Annexures....504
Existing Population And Households 2011, 2024....504
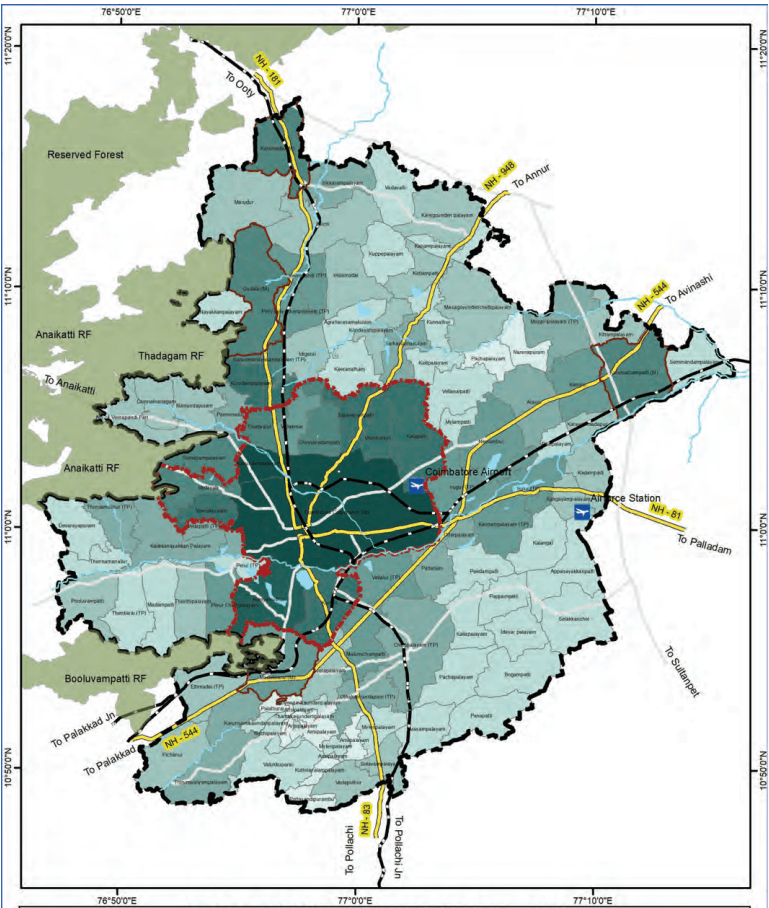
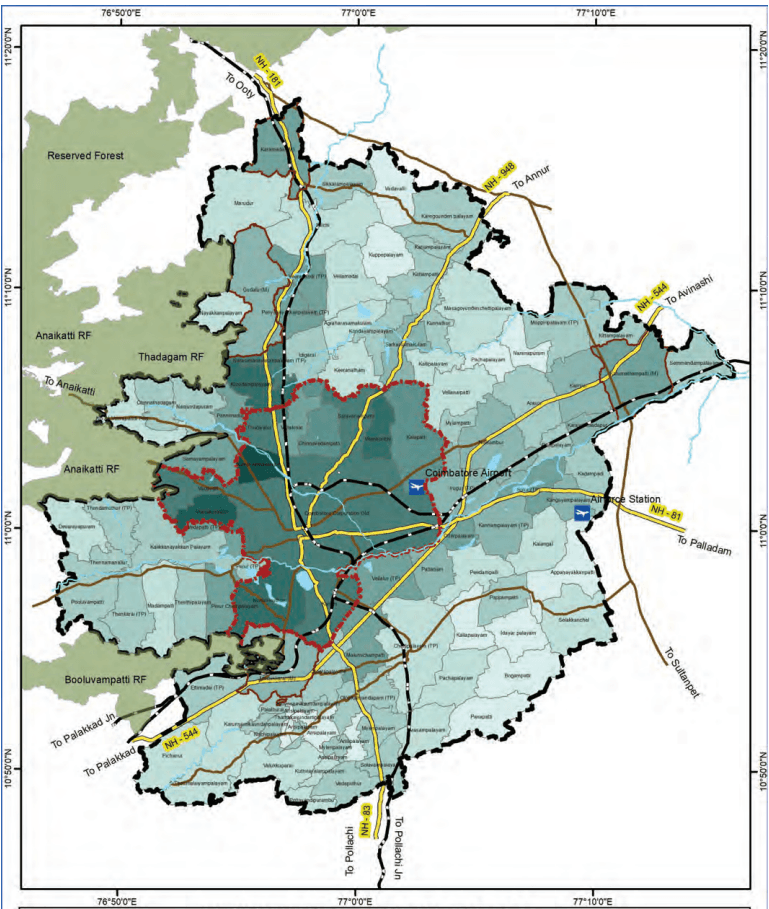
Projected Population & Households 2031 And 2041....509
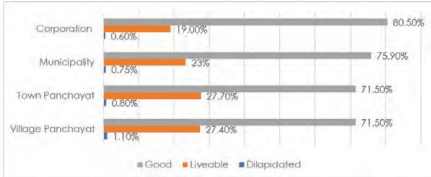
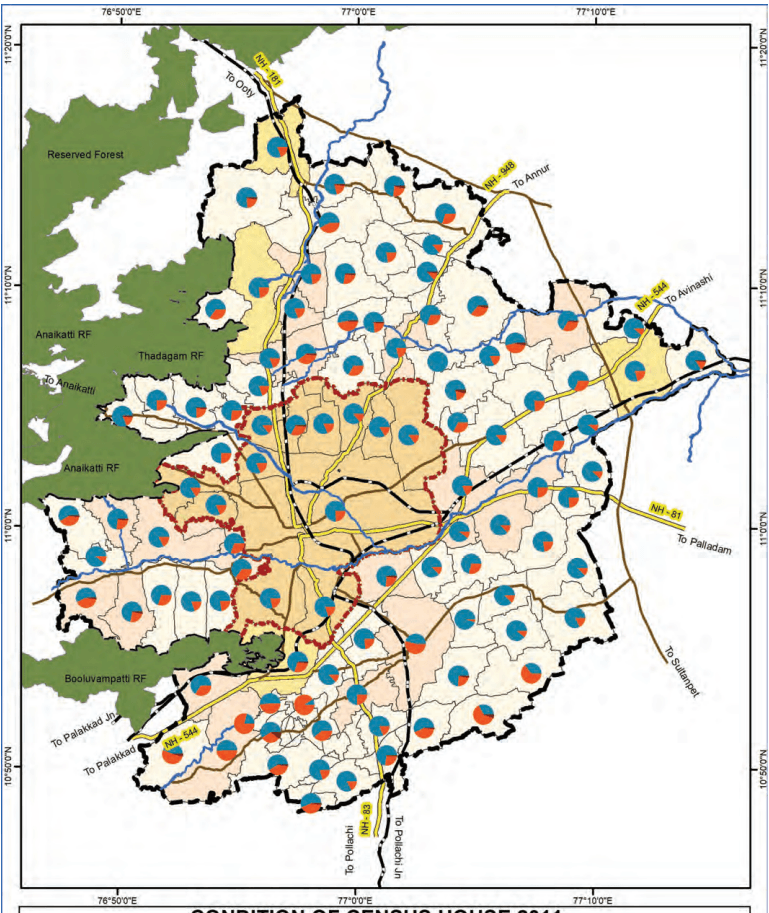
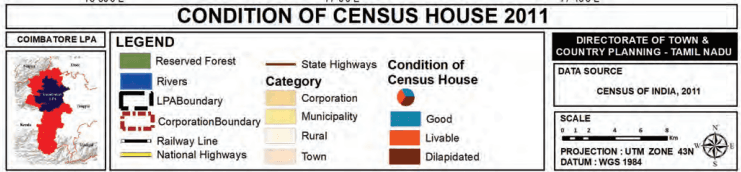
Condition Of Census Houses 2011....513
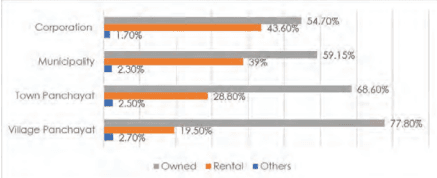
Tenure Of Census Houses 2011....517
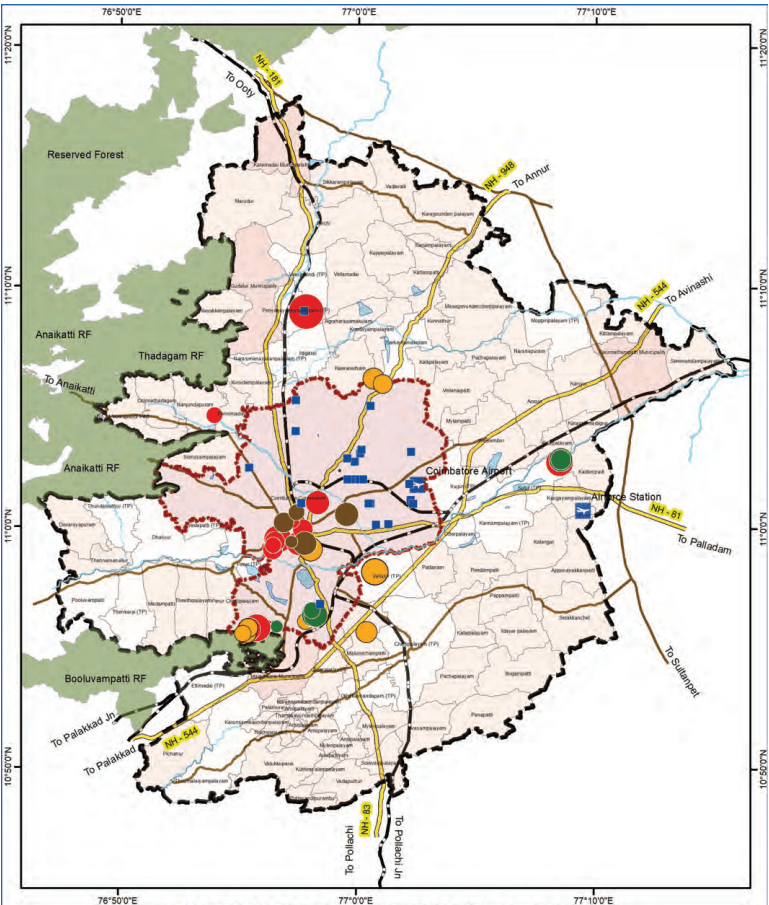
Public Housing Provided By Tnuhdb....521
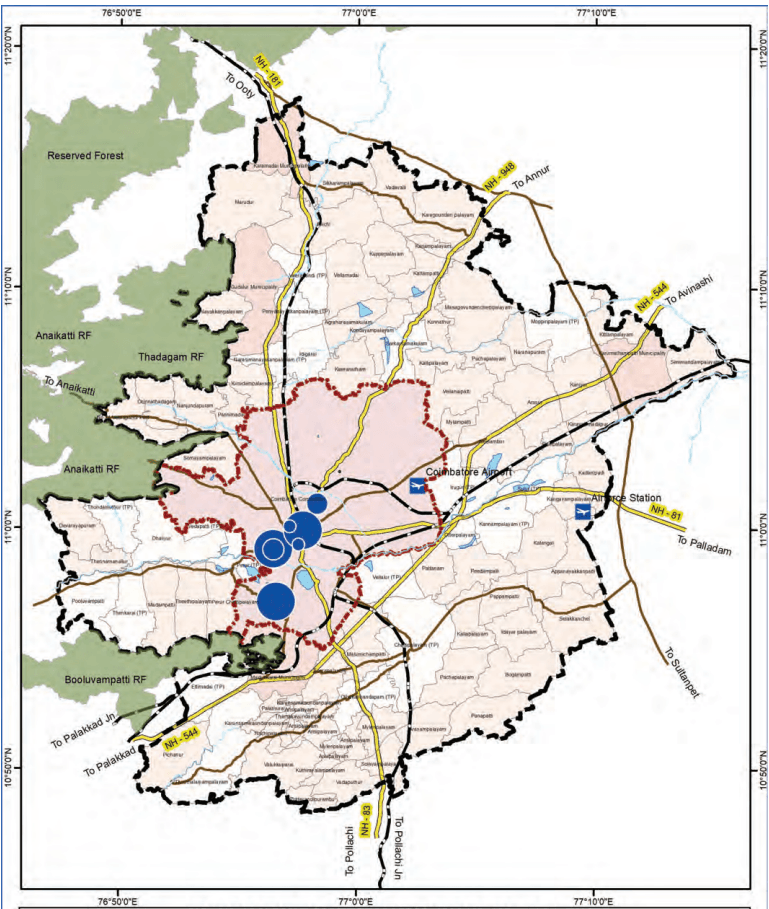
Public Housing Provided By Tnuhdb – Ongoing....523
Public Housing Provided By Tnhb....527
List Of Slums Evicted And Alloted Under Jnnurm & Ahp
In Coimbatore Division....527
Existing Stormwater Drain....530
Proposed Storm Water Drain....534
Existing Solid Waste Management....538
Proposed Solid Waste Generation....542
Annexure no: 10-1 shows the “Coimbatore LPA Present Power consumption and Service connection details – Substation wise”....546
Annexure no. 10-2 “Substation wise Energy Capacity and Gap....552
Energy Demand projection – Village wise....556
Coimbatore Master Plan - 2041....556
Proposed Substation Capacity - Short term and Long Term – Village level....563
MENT ORDERS
GOVERNMENT ORDERS....568
Government Orders
xiii
11.1Social Indicators
Coimbatore district reflects substantial progress in reducing multidimensional poverty and commitment to human development, highlighting the impact of sustained investments in social infrastructure.
11.1.1 Human Development Index (HDI), 2017
Coimbatore ranked 6th among all districts in Tamil Nadu with a Human Development Index (HDI) of 0.844 in 2017, placing it firmly in the ‘Very High Human Development’ category. The HDI is calculated as the average of three indices: the Life Expectancy Index, the Education Index, and the Gross National Income (GNI) Index. To put this into perspective, Coimbatore’s HDI is comparable to that of developed countries such as Kuwait (0.847) and even higher
than that of Oman (0.819), highlighting the district’s strong performance in health, education, and income dimensions..
List of Abbreviations
AAI
Airport Authority of India
AC
Air Conditioned
AG
Aspirational Growth
AHP
Affordable Housing in Partnership
AID
Automatic Incident Detection
API
Application Programming Interface
ASI
Archaeological Survey of India
ATIS
Automatic terminal information service
ATMP
(Assembly, Testing, Marking & Packaging
ATMS
Advanced traffic management system
BAU
Business as Usual
BFSI
Banking, Financial Services, and Insurance
BIS
Bureau of Indian Standards
BOV
Battery Operated Vehicles
BPO
Business process outsourcing
BWSSB
Bangalore Water Supply and Sewerage Board
CAGR
Compounded Annual Growth Rate
CASC
Coimbatore Auto Sports Club (
CBD
Central Business District
CBIC
Chennai-Bengaluru Industrial Corridor
CBIC
Chennai-Bengaluru Industrial Corridor
CBMIC
Chennai Bengaluru-Mumbai Industrial Corridor
CBSE
Central Board of Secondary Education
CCMC
Coimbatore City Municipal Corporation
CCTV
Closed-circuit television
CETPs
Common effluent treatment plants
CHC
Community Health Center
CHIL SEZ
Coimbatore Hi-tech Infrastructure Private Limited Special Economic Zone
CIBI
Coimbatore Innovation and Business Incubator
CII
Confederation of Indian Industry
CIT
Coimbatore Institute of Technology
CKIC
Chennai - Kanniyakumari Industrial Corridor
CLPA
Composite Local Planning Area
CMP
Comprehensive Mobility Plan
xxviii
CNG Compressed Natural Gas CODISSIA Coimbatore District Small Industries Association CPCB Central Pollution Control Board CPHEEO Central Public Health and Environmental Engineering Organisation CPS Community Parks CSC Common Service Centers CUMTA Chennai Unified Metropolitan Transport Authority CWSN Children With Special Needs CWSS Combined Water Supply Schemes DAY-NULM Deen Dayal Antyodaya Yojana - National Urban Livelihoods Mission DDP Detailed Development Plan DEWATS Decentralised Wastewater Treatment System DGPS Differential Global Positioning System DHH District Headquarter Hospital DIC District Industries Center (DIC) DMA District Metering Areas DPSUs Defence Public Sector Undertakings DRDO Defence Research and Development Organisation DSDC District Skill Development Centre DTCP Directorate of Town & Country Planning ECBC Energy Conservation Building Code ELCOT Electronics Corporation of Tamil Nadu ESDM Electronics Hardware Manufacturing ESDM Electronics System Development and Maintenance ESI Employees State Insurance ESR Elevated Storage Reservoirs ESZ Eco-Sensitive Zones ETA Estimated Time of Arrival ETC Estimated Time of Completion ETP Effluent Treatment Plant EWS Economically Weaker Section FAR Floor Area Ratio FHTC Functional Household Tap Connections FMSCI Federation of Motor Sports Clubs of India FRL Full Reservoir Level FSI Floor Space Index FSTP Faecal Sludge Treatment Plant GCCs Global Capability Centres
xxix
GCP Ground control point GDDP Gross District Domestic Product GDP Gross Domestic Product GER Grass Enrollment Ratio GI Geographic Indication GIS Geographical Information System GoTN Government of Tamil Nadu GQ Golden Quadrilateral GSDP Gross State Domestic Product GSI Geological Survey of India GSR Ground Service Reservoirs GVA Gross Value Addition H&UD Housing & Urban Development HACA Hill Area Conservation Authority HDI Human Development Index HGT High Growth Trajectory HIG Higher Income Group HR&CE Hindu Religious & Charitable Endowments Departments HSC Health Sub-Center HVAC Heating, ventilation, and air conditioning ICCC Integrated Command and Control Centre ICD Inland container depots ICTT International Container Transshipment Terminal IIS Indian Institute of Science IISER Indian Institute of Science Education and Research IIT Indian Institute of Technology ILPs Integrated Logistics Parks IMD Indian Meteorological Department IPHS Indian Public Health Standards IPT Intermediate Public Transit IRC Indian Road Congress ISRO Indian Space Research Organization IT Information Technology ITeS Information Technology Enabled Services ITI Indian Training Institute ITS Intelligent Transport System JJM Jal Jeevan Mission JNNURM Jawaharlal Nehru National Urban Renewal Mission
xxx
KLD Kiloliters per Day KNTDA Kurichi New Town Development Authority L&T Larsen & Toubro Limited LIG Lower Income Group LPA Local Planning Area LPCD Liters per capita per day LPO Legal Process Outsourcing MBBR Moving Bed Biofilm Reactor MICE Meetings, Incentives, Conferences, and Exhibitions MIG Middle Income Group MLD Million Litres per Day MMDA Madras Metropolitan Development Authority MMLP Multimodal Logistics Park MPI Multidimensional Poverty Index MRTS Mass Rapid Transit System MSL Mean Sea Level MSME Micro, Small and Medium Enterprises MVA Megavolt-Amperes NBFCs Non-Banking Financial Companies NCT National Capital Teritory NDMA National Disaster Management Authority NDMC New Delhi Municipal Council NH National Highway NID National Institute of Design NIFT National Institute of Fashion Technology NIRF National Institutional Ranking Framework NMT Non- Motorized Transport NMV Non -Motorized Vehicles NPV Net Present Value NRSC National Remote Sensing Center NRW Non-Revenue Water NSSO National Sample Survey Office NULM National Urban Livelihood Mission OEMs Original Equiment Manufacturers OHT Over Head Tanks ORS Open Route Service OSM Open Street Map OSR Open Space Reservation
xxxi
PACS Primary Agricultural Credit Societies PDS Public distribution system PHC Primary Health Center PHPDT Peak Hour Peak Direction Traffic PMAY Pradhan Mantri Awas Yojana PPP Public-Private Partnership PSU Public Sector Unit PSU Public Sector Unit PwD Person with Disabilities R&D Research & Development RAY Rajiv Awas Yojana RFID Radio Frequency Identification RoB Rail over Bridge RoW Right of Way RRTS Regional Rapid Transit System RTO Regional Transport Office SaaS Software-as-a-Service SACON Sálim Ali Centre for Ornithology and Natural History SAFE Site Adjacent Factory Employee SBR Sequential Batch Reactor SCA Service Center Agency SCADA Supervisory control and data acquisition SDGs Sustainable Development Goals SEZ Special Economic Zone SH State Highway SHG Self-Help Groups SIDCO Small Industries Development Corporation SIPCOT State Industries Promotion Corporation of Tamil Nadu SME Small and Medium Enterprises SRTM Shuttle Radar Topography Mission STEM Science, Technology, Engineering, and Math STP Sewage Treatment Plant STPI Software Technology Park of India STR student-Teacher Ratio SUH Shelter for Urban Homeless T&CP Town & Country Planning TACTV Tamil Nadu Arasu Cable TV Corporation Limited TANGEDCO Tamil Nadu Generation and Distribution Corporation Limited
xxxii
TANTRANSCO Tamil Nadu Transmission Corporation Limited TDM Traffic Demand Management TIDCO Tamil Nadu Industrial Development Corporation TIDEL Tamil Nadu Industrial Development Corporation and Electronics Corporation of Tamil Nadu TIFR Tata Institute of Fundamental Research TMC Traffic Management Centers TNAU Tamil Nadu Agricultural University TNCDBR Tamil Nadu Combined Development Building Rules TNDIC Tamil Nadu Defence Industrial Corridor TNEB Tamil Nadu Electricity Board TNeGA Tamil Nadu e-Governance Agency TNGECL Tamil Nadu Green Energy Corporation Limited TNHB Tamil Nadu housing board TNPCB Tamil Nadu Pollution Control Board TNPDCL Tamil Nadu Power Distribution Corporation Limited TNPGCL Tamil Nadu Power Generation Corporation Limited TNSRLM Tamil Nadu State Rural Livelihood Mission TNSSGF Tamil Nadu Startup Seed Grant Fund TNSTC Tamil Nadu State Transport Corporation TNUHDB Tamil Nadu Urban Habitat Development Board TNULM Tamil Nadu Urban Livelihood Mission TOD Transit Oriented Development TP Town Panchayats TWAD Tamil Nadu Water Supply and Drainage Board UASB Upflow Anaerobic Sludge Blanket UDA Urban Development Authority UGPHC Up Graded Primary Health Centre UGSS Under Ground Sewerage Schemes ULB Urban Local Bodies UMTA Unified Metropolitan Transport Authority UNESCO United Nations Educational, Scientific and Cultural Organization UPHC Upper Primary Health Center URDPFI Urban and Regional Development Plans Formulation & Implementation URPs University Research Parks USGS United States Geological Survey VPRC Village Poverty Reduction Committee WTP Water Treatment Plant
SOCIAL INFRASTRUCTURE
Coimbatore District is on a progressive trajectory toward achieving social equity and sustainable human development. The district exemplifies a model of balanced urban growth, where economic development is complemented by strategic investments in human capital and social infrastructure.
To build upon this momentum in the LPA, future planning efforts must prioritise inclusive service delivery, equitable access, and the strengthening of last-mile linkages to ensure that the benefits of development reach all population segments.
In Urban Core Areas – The focus must evolve from mere access to a deliberate enhancement of quality in service delivery across sub-sectors of Social Infrastructure.
In Rural and Peri-Urban Areas – The focus must be placed on bridging infrastructure gaps, ensuring universal access, and last-mile delivery of social infrastructure.
These aims to guide Coimbatore LPA toward a socially inclusive future, where every citizen benefits from the city’s progress. It is aligned with Tamil Nadu’s vision of becoming a $1 trillion economy, wherein human capital is identified as growth driver for building a progressive society and access to essential goods and services is envisioned as a cornerstone for socially inclusive growth, particularly across the domains of healthcare, education, safety and security, as well as culture and sports infrastructure.
11.1.2Multidimensional Poverty Index (MPI), 2019
The Multidimensional Poverty Index (MPI) derived from National Family Health Survey (NFHS) offers a more recent and granular assessment of deprivation across 10 indicators which are divided into three equally weighted dimensions: Education, Health and Standard of Living.
Notably, education and health, which fall under the domain of social infrastructure, together account for twothirds (2/3) of the MPI. This indicates the critical role that social infrastructure plays in improving human well-being. As per MPI data for the Coimbatore District:
The MPI value in the Coimbatore district has halved - from 0.009 in NFHS-4 (2015–16) to 0.004 in NFHS-5 (2019–21), indicating a significant overall reduction in deprivation.
The headcount ratio—which represents the percentage of people identified as multidimensionally poor—dropped from 2.29% to 0.96%.
This highlights that fewer people in Coimbatore are poor today, and those who are still poor face fewer and less severe hardships related to education, healthcare, and living conditions.
11.1.3Literacy Rate in Coimbatore LPA
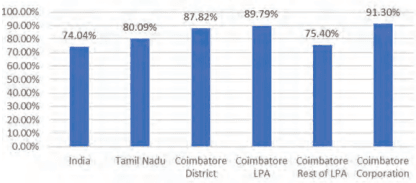
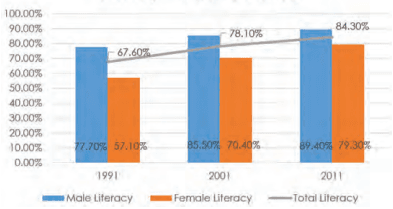
Coimbatore district demonstrates strong educational attainment, with a literacy rate of 87.82%, surpassing Tamil Nadu (80.09%) and India (74.04%). Coimbatore Corporation leads with 91.3%, while the Urban LPA stands at 84.3%, and Rural LPA lags at 75.4%, reflecting a significant urban-rural gap (~16%).
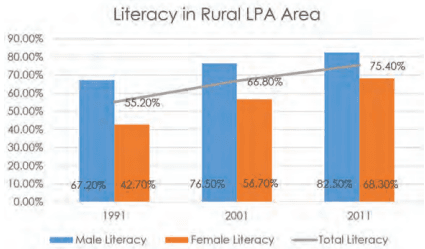
Between 2001 and 2011, literacy rate in Coimbatore LPA rose from 55.2% to 75.4%, driven by a notable increase in female literacy (42.7% to 68.3%). However, rural female literacy remains 14.2% below rural males and 21.2% below urban males, indicating persistent gender disparities.
Urban areas benefit from better infrastructure while rural zones face cultural and economic barriers.
Literacy Rate
Source: Census of India, 2011
Figure 11.1: Coimbatore LPA Literacy Rate Comparison with State and Country
Literacy in Urban LPA Area
Source: Census of India, 2011
Figure 11.2: Literacy Rate Trend in Urban Areas of Coimbatore LPA
Source: Census of India, 2011
Figure 11.3: Literacy Rate Trend in Rural Area of Coimbatore LPA
11.1.4Spatial Trends in Social Infrastructure Development
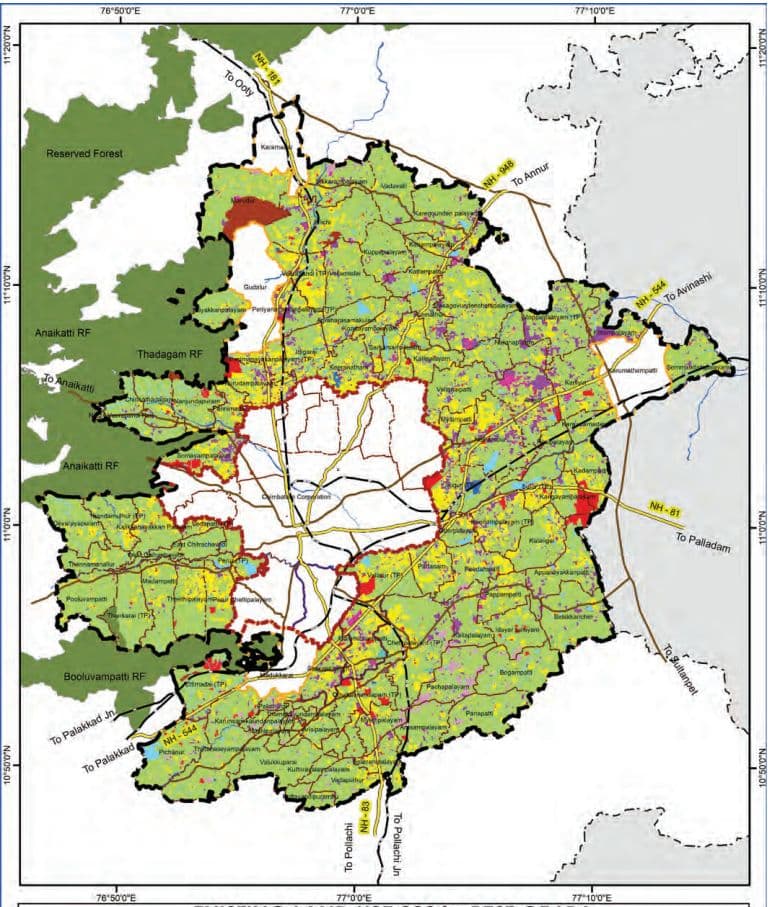
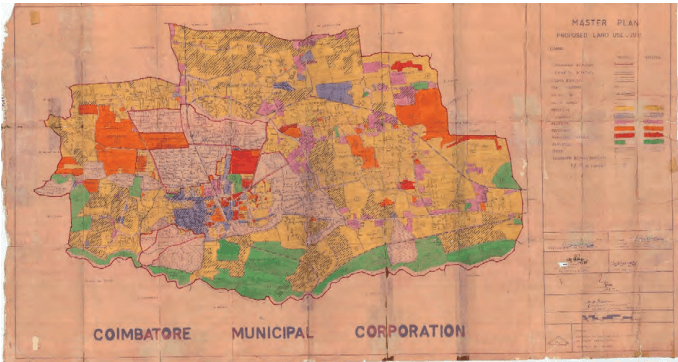
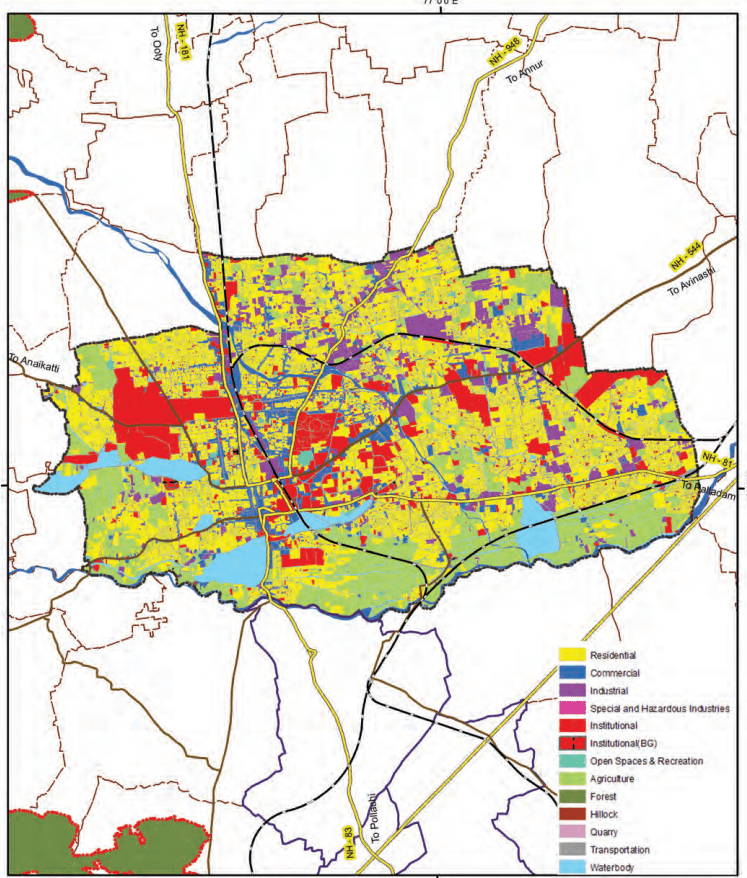
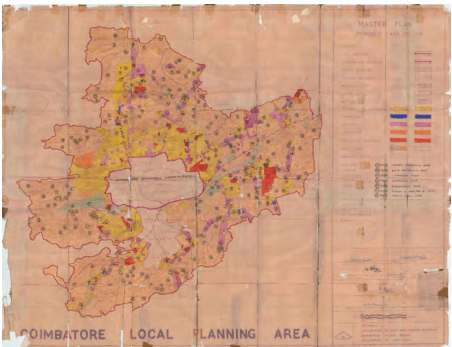
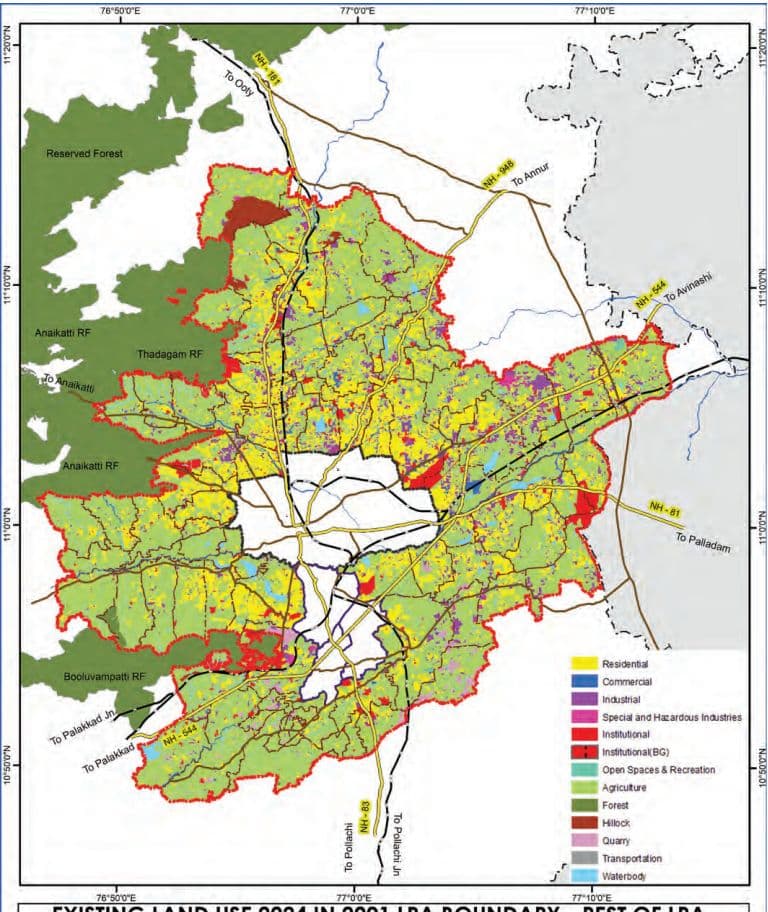
Further reinforcing this above trend in indices, a comparative analysis between the proposed land use (2001) and the existing land use (2021) in the Coimbatore Local Planning Area (LPA) reveals that institutional and commercial sectors have witnessed more pronounced growth than residential and industrial sectors. This clearly highlights that Coimbatore LPA has a strong foundation in institutional growth.
Coimbatore’s urban core areas have largely overcome access-based deprivations and now stand to benefit from improvements in service quality and efficiency. However, rural and peri-urban areas still show marginal deprivation. These areas require focused interventions to ensure lastmile delivery and equitable access to essential services.
11.2 School Education in Coimbatore LPA
11.2.1Distribution of Schools in Coimbatore LPA
11.2.1.1 Category wise Distribution of Schools in LPA
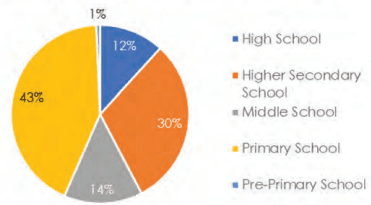
The available data on the distribution of schools across different categories, funding types, and management systems within the region reveals important patterns that highlight both the strengths and gaps in the existing educational infrastructure. A total of 1,172 schools have been identified, distributed across various administrative units such as Corporation, Municipalities, Town Panchayats, and Revenue Villages. These schools are categorized into five types: Pre-Primary, Primary, Middle, High, and Higher Secondary Schools.
School Category-wise Distribution in LPA
Figure 11.4: Category wise Distribution of Schools in Coimbatore LPA
A review of the distribution across school categories indicates that Primary Schools constitute the largest proportion (42.7%) of the total, followed by Higher Secondary Schools (30.5%) and Middle Schools (14.2%). High Schools and Pre-Primary Schools account for 11.8% and 0.7%, respectively. This distribution aligns with a typical educational pyramid structure, where the base level—Primary Education—has the widest presence, ensuring foundational education at the local level, while the number of institutions tapers off at higher education levels, reflecting increasing centralization and specialization.
Table 11.1Category wise Distribution of Schools in Coimbatore LPA
School Category
Corporation
Municipality
Town Panchayat
Revenue Villages
Grand Total
%
Higher Secondary School
215
22
55
66
358
31%
High School
72
7
21
38
138
12%
Middle School
63
18
25
61
167
14%
Primary School
215
23
86
177
501
43%
Pre-Primary School
7
0
0
1
8
0.7%
Grand Total
57249%
70<sub>6</sub>%
18716%
34329%
1172100%
100%
Spatially, Corporation areas exhibit the highest concentration of schools (49% of the total), followed by Revenue Villages (29.3%), Town Panchayats (15.9%), and Municipalities (6%). This pattern suggests a strong presence of educational infrastructure in urban areas, particularly within the core city limits. In contrast, Revenue Villages and Town Panchayats, despite serving a considerable population base, have relatively fewer schools, indicating potential access gaps in less urbanized areas.
11.2.1.2 Funding-wise Distribution of Schools in LPA
The funding structure of schools further reveals the role of both public and private sectors. Government schools account for 46% of the total institutions, making them the largest single contributor to the education system. Un-aided private schools, however, are nearly equal in number (44%), suggesting a significant presence of privately managed educational institutionsthroughout the LPA. Fully Aided and Partially Aided schools comprise 7% and 3%, respectively, while Central Government institutions constitute only a negligible share.
Table 11.2Funding wise Distribution of Schools in Coimbatore LPA
Funding Category
Corporation
Municipality
Town Panchayat
Revenue Villages
Grand Total
%
Central Govt
3
0
1
0
4
0%
Fully Aided
61
6
5
11
83
7%
Government
175
30
235
98
538
46%
Partially Aided
22
3
2
5
32
3%
Un-aided
311
31
100
73
515
44%
Grand Total
572
70
343
187
1172
100%
49%
6%
29%
16%
100%
11.2.1.3 Management wise Distribution of Schools in LPA
With regard to the management and curriculum of schools, the Samacheer Kalvi or State Board system overwhelmingly dominates the landscape, comprising 92.3% of all schools. Central Board of Secondary Education (CBSE) schools represent 6.9%, followed by International Board and ICSE schools with marginal shares. CBSE and International schools are predominantly concentrated in Corporation and Town Panchayat areas, while their presence in rural regions is almost negligible
Table 11.3Management wise Distribution of Schools in Coimbatore LPA
Management Category
Corporation
Municipality
Town Panchayat
Revenue Villages
Grand Total
%
CBSE
47
4
21
9
81
6.91
ICSE
2
1
0
1
4
0.34
International Board
2
0
2
1
5
0.43
Samacheer Kalvi / State Board
521
65
320
176
1082
92.32
Grand Total
572
70
343
187
1172
100
48.81%
5.97%
29.27%
15.96%
100%
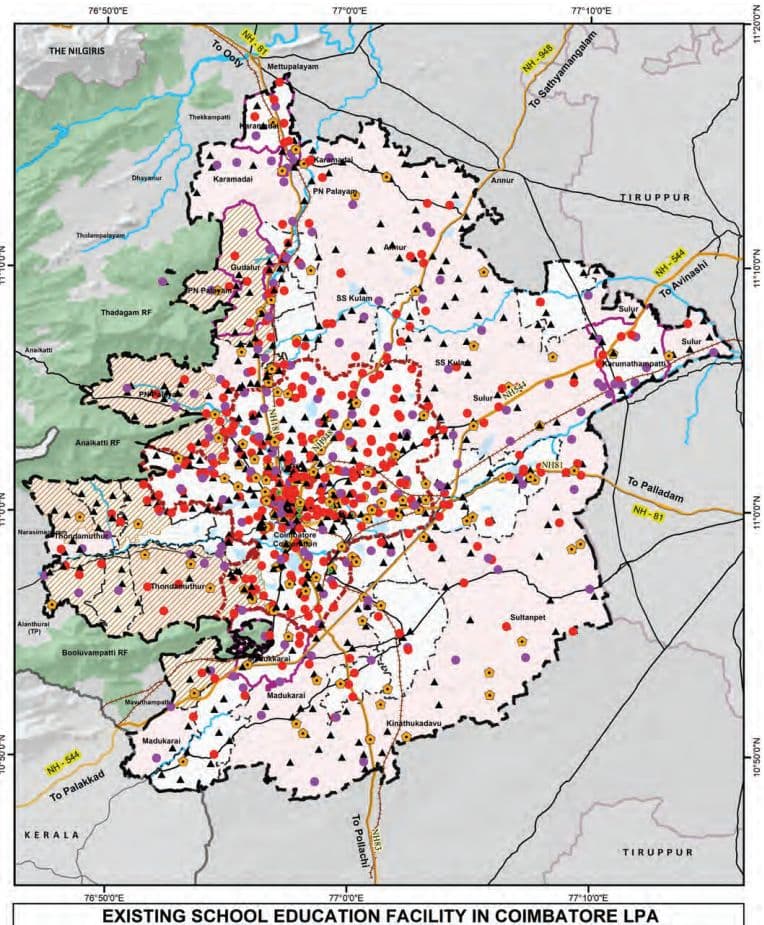
Map 11.1: Existing School Educations in Coimbatore LPA
11.2.2Students Enrolment in School Education
Table 11.4School Management wise Students Enrolment in Coimbatore LPA
Management
Total Number of Boys
Total Number of Girls
Total Number of Students
Central Govt
3567
3188
6755
Fully Aided
10339
10311
20650
Government
50806
53739
104545
Partially Aided
14184
16903
31087
Un-aided
165935
153495
319430
Grand Total
244831
237636
482467
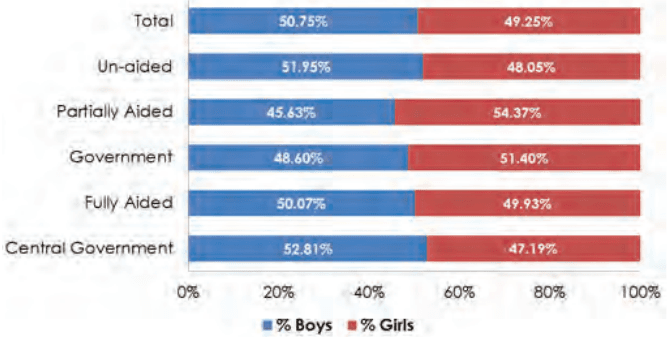
Figure 11.5: Management wise Boys and Girl Students Enrolment in Coimbatore LPA
The Coimbatore LPA records a total student enrollment of 482,467, with a balanced gender ratio (50.7% boys, 49.3% girls), indicating steady progress toward gender parity in education. Un-aided schools account for 66.2% of enrollments, reflecting high demand. Over 156,000 students attend Government, Fully Aided, and Partially Aided schools.
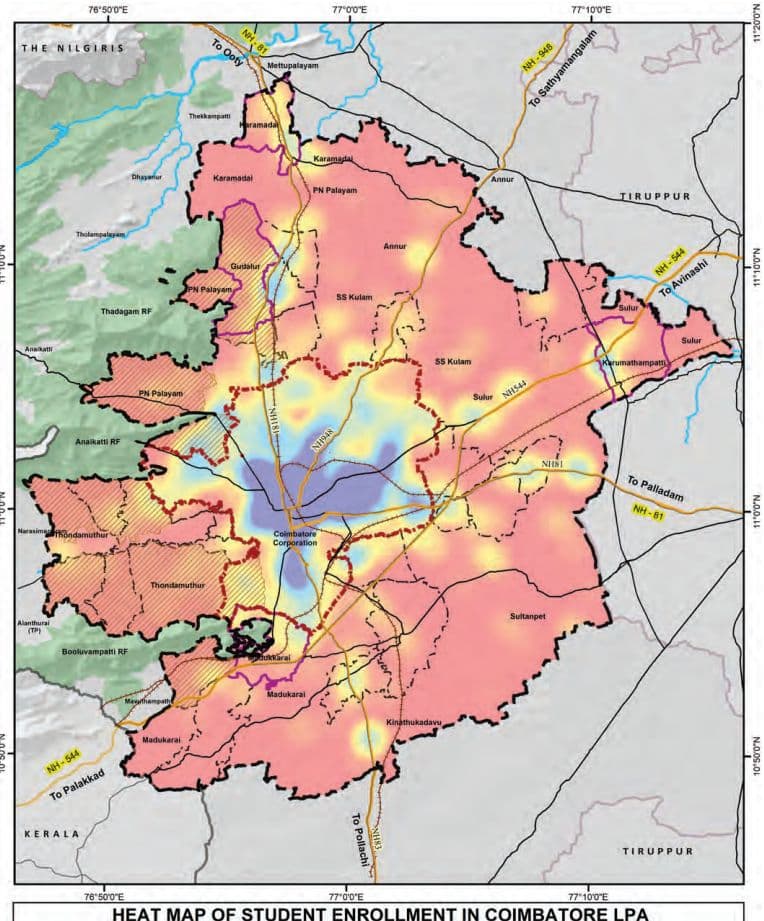
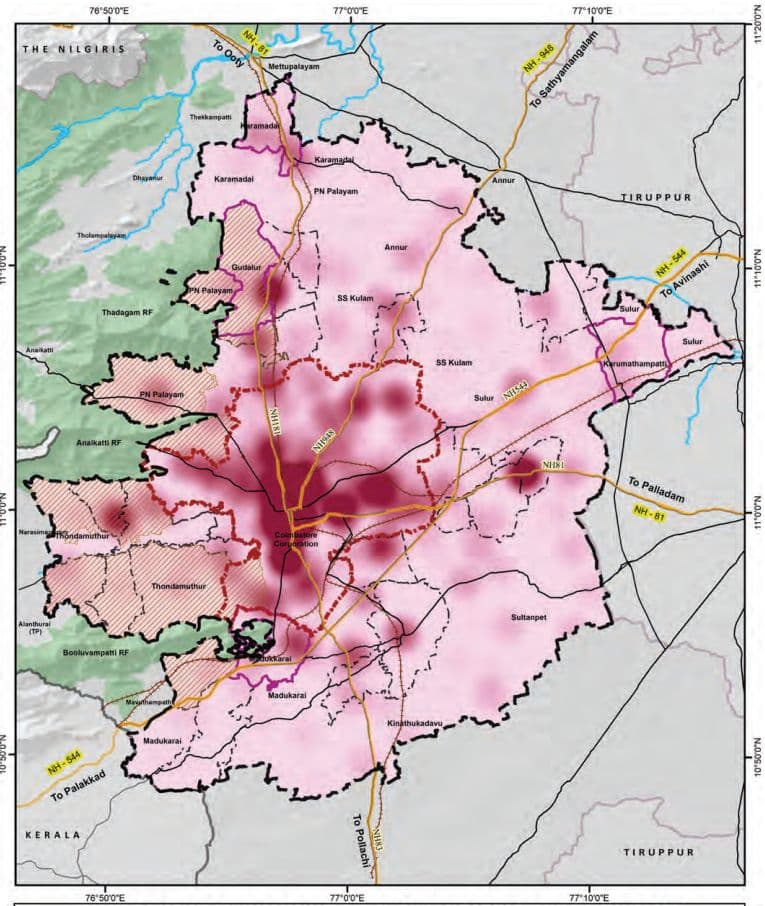
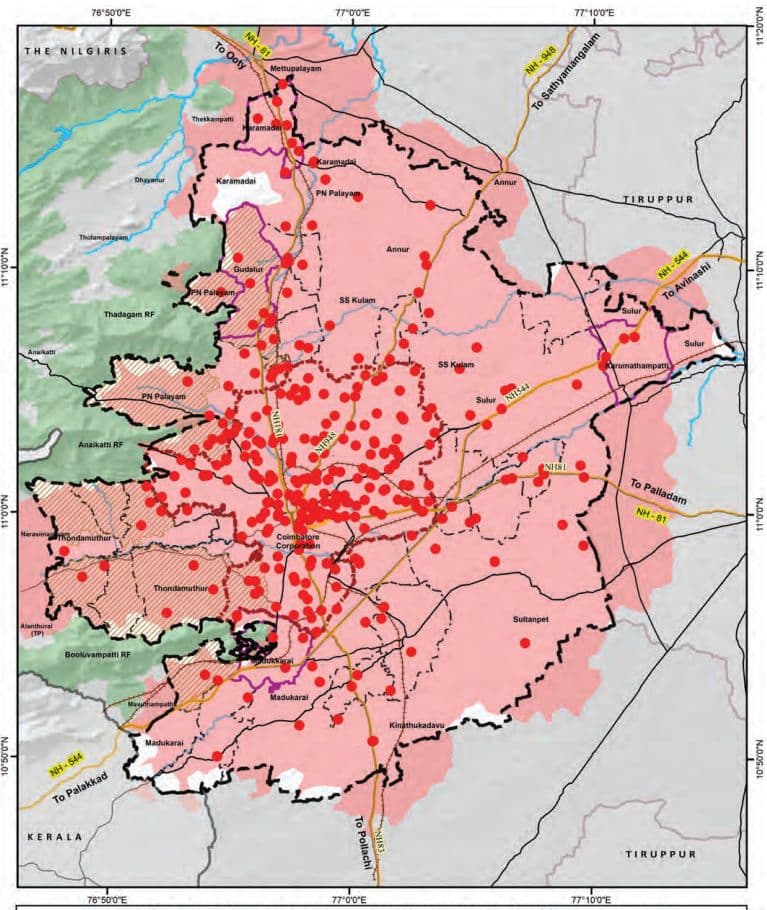
Map 11.2: Heatmap of Students Enrolment in Coimbatore LPA
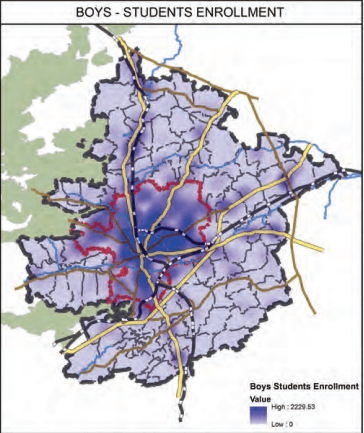
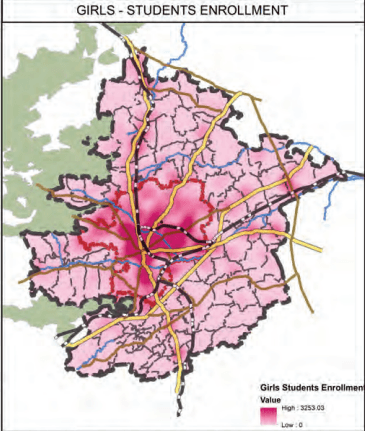
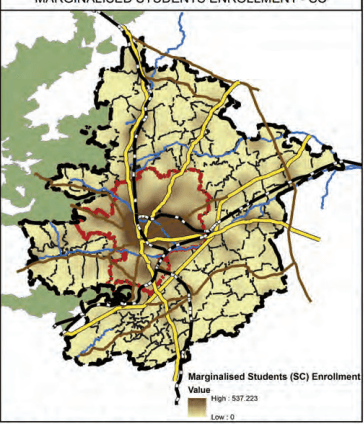
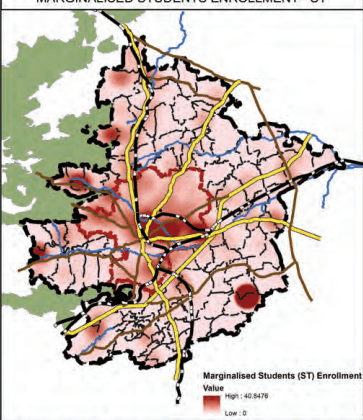
Map 11.3: Heatmaps of Students Enrolment - Boys, Girls, and Marginalised Students in LPA
Heat Map of Distribution of Students Enrollment in Coimbatore LPA
11.2.3Student-Teacher Ratio in Coimbatore LPA
The student-Teacher Ratio (STR) across all school categories within the Coimbatore Local Planning Area (LPA) remains well within the prescribed normative limits between 20 to 25, with no category exceeding the recommended benchmarks as shown in the Table 11.5. This reflects an adequate deployment of teaching personnel, thereby supporting the effective delivery of quality education at all levels.
Table 11.5Students - Teachers Ratio in Schools of Coimbatore LPA
School Category
Students Enrollment
Teaching Staffs
Student Teachers Ratio
As per Norms
High School
47898
2199
21.78
30:1(as per RMSA framework)35:1(as per RTE Act 2009)
Hr. Sec. School
344339
13607
25.30
Middle School
35799
1707
20.97
Primary School
53456
2362
22.63
30:1(as per RTE Act 2009)
Pre-Primary School
975
40
24.37
11.2.4Differently Abled Schools and CWSN Schools in Coimbatore LPA
Sustainable Development Goal (SDG) 4 emphasizes inclusive and equitable quality education for all, including children with disabilities.
The higher number of special schools for the differently abled/ Children With Special Needs (CWSN) within Coimbatore Corporation reflects the city’s commitment to this goal, highlighting its efforts toward fostering an inclusive and equitable urban environment.
There are 14 special schools for differently abled students, with the majority (11) located within Coimbatore Corporation, all managed by un-aided institutions. The remaining three schools are located in Gudalur Municipality, Perur Town Panchayat, and Narasimhanaickenpalayam Town Panchayat, with only the Perur school being government-run.
Table 11.6Special Schools for Differently Abled Students/Children With Special Needs (CWSN)
Administration Area
Number
Management
Coimbatore Corporation
11
Un-aided
Gudalur Municipality
1
Un-aided
Perur TP
1
Government
Narasimhanaickenpalayam TP
1
Un-aided
11.2.4.1 Comparison of CWSN/Differently Abled Students in Mainstream vs CWSN Schools in LPA
Out of 2,674 CWSN students in Coimbatore LPA, 83.7% are in mainstream schools, reflecting strong inclusion efforts, especially at the Higher Secondary (824) and Middle School (519) levels. Special schools primarily serve CWSN in Primary (61) and Middle (236) levels, indicating early identification and targeted support.
Table 11.7Comparison of CWSN/Differently Abled Students in Mainstream and Special Schools
Category
CWSN/Differently abled students in Mainstream Schools
CWSN/ Differently abled students in Special Schools
High Schools (I-X)
3
71
High Schools (VI-X)
391
0
Hr.Sec School (I-XII)
20
68
Hr.Sec School (VI-XII)
824
0
Middle School (I-VIII)
509
236
Middle School (VI-VIII)
10
0
Pre-Primary & Primary Only (I-V)
481
61
Grand Total
2238
436
Map 11.4: Heat Map of CWSN Students Enrolment in Coimbatore LPA
HEAT MAP OF CWSN STUDENT ENROLLMENT IN COIMBATORE LPA
11.2.4.2 Management of CWSN/Differently Abled Students Composition in Schools in LPA
The analysis of school enrolment data in Coimbatore reveals notable disparities in the inclusion of Children With Special Needs (CWSN) across school types and areas. Government schools have the highest inclusion rate (1.68%), followed by fully aided (1.24%) and partially aided schools (0.74%), while the number of children reported in the Central Government and unaided schools are nil. Geographically, Schools in Town Panchayats have higher enrolments in CWSN / DA Students (0.62%) as compared to the schools in the Corporation(0.44%), Revenue Villages (0.46%), and Municipalities (0.38%).
Table 11.8Management wise CWSN/Differently Abled Students Composition in Schools in LPA
School Type
Schools
Students
CWSN Students
% of CWSN students in Schools
Central Govt
4
6,755
0
0%
Fully Aided
83
20,650
255
1.24%
Government
538
104,545
1,754
1.68%
Partially Aided
32
31,087
229
0.74%
Un-aided
515
319,430
0
0%
Table 11.9Area wise CWSN/Differently Abled Students in Schools in LPA
Area
Schools
Students
CWSN Students
CWSN Students% in Area
Corporation
572
286,843
1,248
0.44%
Municipality
70
29,888
115
0.38%
Revenue Villages
343
97,320
448
0.46%
Town Panchayats
187
68,416
427
0.62%
11.2.4.3 Type of Disability among CWSN students in LPA
The Coimbatore LPA reports 2,238 Children With Special Needs (CWSN), with Intellectual Disability being the most prevalent at 58.6%. This highlights the urgent need for trained special educators, individualized learning plans, and cognitive-supportive infrastructure in both mainstream and special schools. Hearing and Locomotor Impairments each account for 7.4%, emphasizing the importance of assistive devices, accessible school design, and inclusive teaching methods. Other significant disabilities include Autism (6.7%), Multiple Disabilities (5.8%), and Specific Learning Disabilities (3.1%), all of which require multidisciplinary support. This indicates the need to focus on inclusive school infrastructure.
Table 11.10Type of Disability among CWSN students in LPA
Types of Disability
Students Count
Students Proportion
Autism
149
6.66%
Cerebral Palsy
76
3.40%
Chronic Neurological conditions
2
0.09%
Dwarfism
0
0.00%
Hearing Impairment
166
7.42%
Hemophilia
1
0.04%
Intellectual Disability
1311
58.58%
Locomotor Impairment/Handicap
166
7.42%
Mental Illness
4
0.18%
Multiple disability
129
5.76%
Muscular dystrophy
51
2.28%
Parkinsons disease
2
0.09%
Sickle cell disease
0
0.00%
Specific Learning disability
69
3.08%
Speech Impairment
0
0.00%
Thalassemia
10
0.45%
Visual Impairment (Blindness)
41
1.83%
Visual Impairment (Low-vision)
61
2.73%
Grand Total
2238
100.00%
11.2.7Spatial Coverage Analysis of Schools in Coimbatore LPA
The spatial coverage analysis of schools in the Coimbatore LPA is guided by the norms set under the Tamil Nadu Education School Policy as listed in the following Table. These norms aim to ensure equitable distribution of educational facilities and reduce travel burden on students.
Table 11.12Norms for Spatial Coverage Analysis for Schools as per TN Education School Policy
Type of institution
Distance (KM)
Primary
1 Km
Secondary
5 Km
Higher Secondary
8 Km
Source: Tamil Nadu Education School Policy
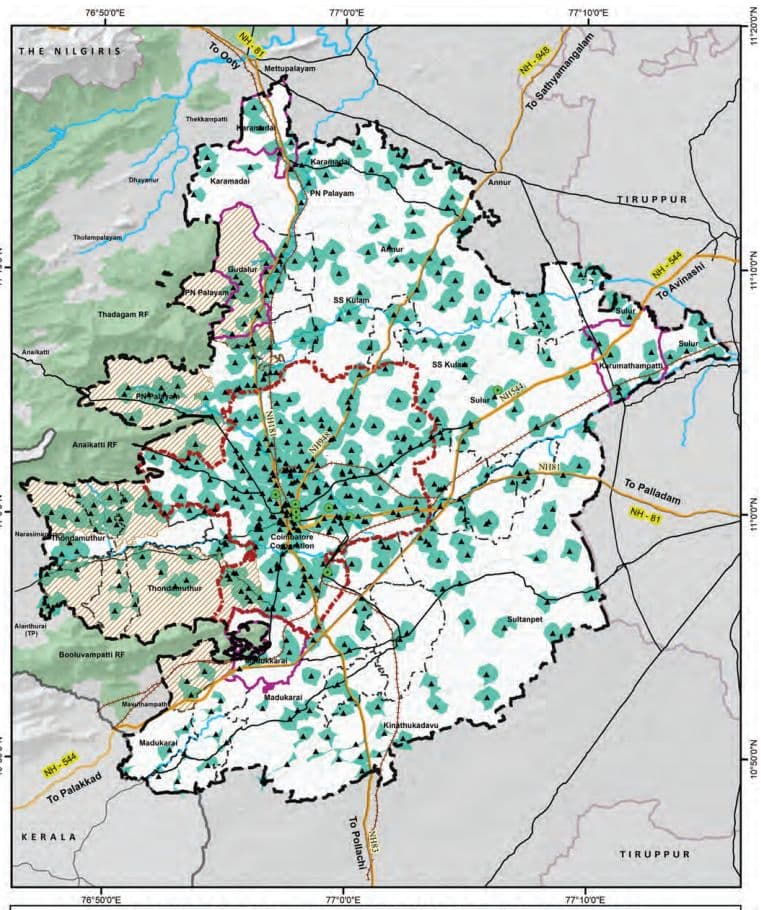
Map 11.5: Pre-Primary and Primary Schools Service Coverage Area (1km)
PRE-PRIMARY AND PRIMARY SCHOOL SERVICE AREA - 1KM
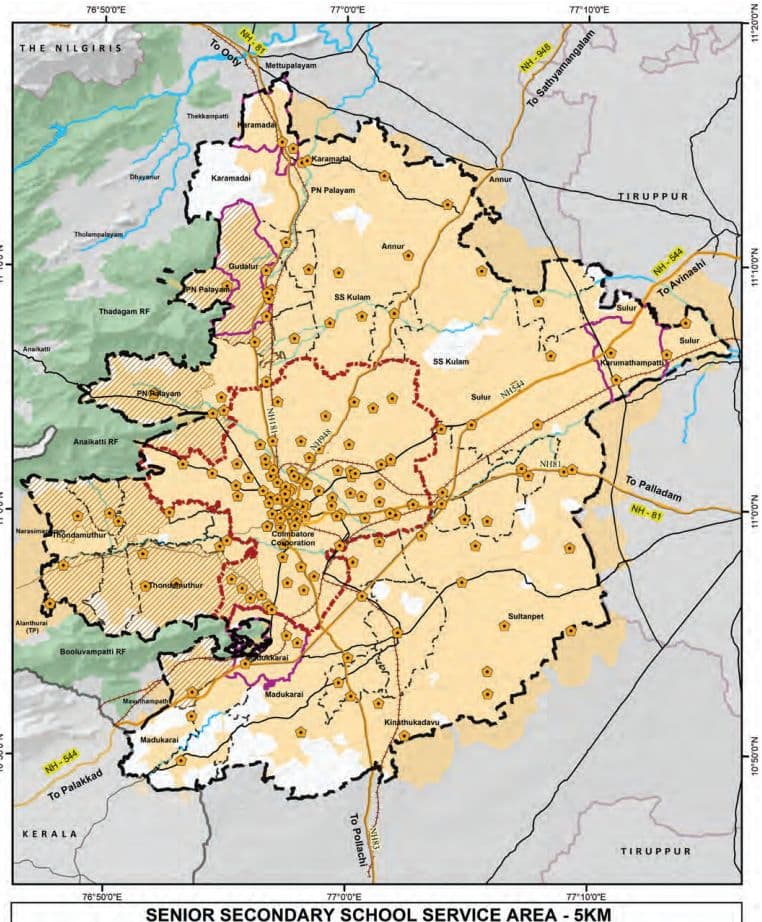
Map 11.6: Senior Schools Service Coverage Area (5km)
Map 11.7: Higher Secondary Schools Service Coverage Area (8km)
INTEGRATED HIGHER SECONDARY SCHOOL SERVICE AREA - 8KM
It is observed that the spatial service coverage for primary and pre-primary schools adequately encompasses the areas within the Coimbatore Corporation limits. However, regions outside the Corporation boundary, within the LPA region, exhibit relatively lower levels of coverage.
In contrast, over 90% of the Coimbatore LPA is spatially well-served by secondary and higher secondary schools, indicating a wider distribution of institutions catering to higher levels of education across the planning area.
11.2.8Projection and Gaps
The URDPFI Guidelines provide population-based thresholds for different categories of educational institutions, as presented in the below table. These benchmarks serve as a planning tool to assess the adequacy of existing educational infrastructure within a region.
Table 11.13URDPFI Guidelines with Population Threshold for the School Institutions
URDPFI Category
Threshold Populations
Pre-primary, Nursery School
2500
Primary School (I-V)
5000
Senior Secondary (VI-XII)
7500
Integrated School without hostel facility (I-XII)
90000 - 1 lakh
Integrated School with hostel facility (I-XII)
90000 - 1 lakh
Source: URDPFI
The total number of schools in each category has been derived by aggregating institutions with overlapping class ranges in accordance with URDPFI guidelines. As several schools offer multiple levels of education, the figures reflect overlaps, although the actual number of schools within the LPA is 1,172.
Table 11.14URDPFI norms -Catagory wise existing school institutions in LPA
URDPFI Category
Category of School Education
No. of Schools In Coimbatore LPA
Total No. of Schools in Coimbatore LPA
Pre-primary, Nursery School
Nursery Only (PrkG-UKG)
8
141
Nursery & Primary (Pre-KG-V)
133
Primary School (I-V)
Primary Only (I-V)
368
664
Nursery & Primary (Pre-KG-V)
133
Middle School (I-VIII)
163
Senior Secondary (VI-XII)
High Schools (VI-X)
67
170
Hr. Sec School (IX-XII)
1
Hr. Sec School (VI-XII)
98
Middle School (VI-VIII)
4
Integrated School without hostel facility (I-XII)
Hr. Sec School (I-XII)
249
318
High Schools (I-X)
69
As per the Projections in the following section, it is observed that:
Senior Secondary Schools (VI–XII): There would be additional requirement of 358 institutions by 2041,for which the space requirement would be 6.46 sq.km (as per URDPFI norms). The number of additional schools assessed to be provided by 2041, inthe Corporation is 271 school and 24 Schools and 18 Schools in the high growth blocks of PN Palayam and Sulur
Primary Schools (I–V): There would be an additional requirement of 316 primary schools by 2041 requiring an additional area of 1.26 sq. A Substancial part of the additional requirement would be in core urban areas.
Integrated Schools without hostel facilities (I–XII) show surplus availability for the 2041.
Table 11.15Projections and Gap analysis for the School Education Institutions in Coimbatore LPA as per URDPFI norms
Gaps
Gap in Schools 2021
Gap in Schools 2031
Gap in Schools 2041
Pop.2021
Primary School (I -V)
Senior Secondary (VI -XI I)
Inte-grated School without hostel facility (I -XI I)
Pop.2031
Primary School (I -V)
Senior Secondary (VI -XI I)
Inte-grated School without hostel facility (I -XI I)
Pop.2041
Primary School (I -V)
Senior Secondary (VI -XI I)
Inte-grated School without hostel facility (I -XI I)
Corporation
20,51 ,71 9
-
-24
-
27,64,842
-78
-1 1 9
-
39,03,784
-306
-271
-
M unicipal ity
1 ,82,262
-
-
2,36,449
-
-5
-
3,05,996
-3
-1 5
-
Town Panchayats
3,73,063
-
-5
-
4,59,1 88
-
-1 2
-
5,67,685
-3
-1 9
-
Annur Block
50,1 83
3 1
1
4
58,1 1 5
29
0
4
67,51 8
27
-1
4
Karamadai Block
23,784
1 5
2
4
28,728
1 4
1
4
34,773
1 3
0
4
Kinathukadavu Block
25,762
8
0
2
3 1 ,727
7
-1
2
39,204
5
-2
2
Madukarai Block
58,01 0
25
1
5
79,61 0
21
-2
5
1 ,1 3,727
1 4
-6
5
PN Palayam Block
1 ,47,01 1
38
3
23
2,21 ,1 34
23
-6
22
3,49,51 4
-3
-24
21
SS ku lam Block
11.3 Higher Education in Coimbatore LPA
By 2041, Coimbatore LPA will require approximately 7.73 sq.km of additional land to meet the additional schools indicated above. The projections highlight a pressing need for strategic land allocation and infrastructure augmentation, particularly for higher-level institutions, to accommodate the growing population and ensure equitable access to education.
Table 11.16Additional Area Requirement for the Schools Education Institutions in LPA by 2041 - as per URDPFI norms
Area Requirement 2041 in Sq.km
Category
Primary School (I-V)
Senior Secondary (VI-XII)
Corporation
1.224
4.878
Municipality
0.012
0.27
Town Panchayats
0.012
0.342
Annur Block
N/A
0.018
Karamadai Block
N/A
N/A
Kinathukadavu Block
N/A
0.036
Madukarai Block
N/A
0.108
PN Palayam Block
0.012
0.432
SS kulam Block
N/A
N/A
Sultanpet Block
N/A
N/A
Sulur Block
0.004
0.324
Thondamuthur Block
N/A
0.054
Total Revenue Villages
0.016
0.972
Area Required in Total Coimbatore LPA
1.264
6.462
Tamil Nadu, India’s leader in Gross Enrolment Ratio (GER) for higher education, owes its success to a robust network of institutions that blend academic rigor with innovation. At the heart of this achievement lies Coimbatore, a cornerstone of South India’s educational landscape. Renowned as an industrial and intellectual hub, the city hosts a diverse array of state-owned universities and specialized institutes that have consistently ranked high in the National Institutional Ranking Framework (NIRF).
11.2.5Adi Dravidar Department Schools
As per Census 2011, the Scheduled Caste (SC) population constitutes approximately 12.7% of the total population in Coimbatore District. The SC population is predominantly concentrated within the limits of the Coimbatore Municipal Corporation, while areas outside the Corporation exhibit relatively lower concentrations.
At present, all Adi Dravidar Department-run schools in the district—totaling sixteen (16)—are situated outside the boundaries of the Local Planning Area (LPA). Despite this, the educational needs of the SC population within the Corporation limits are being effectively met by the existing schools. These schools cater to the concentration of SC student enrollment within the city, as observed in Map 11.3, ensuring access to education for marginalised communities in the urban area.
11.2.6 Tribal Welfare Department Schools
Out of the 16 Tribal Welfare Department-run Schools in Coimbatore District, only 2 are located within the Local Planning Area (LPA) — one each in No.24 Veerapandi Part and Nayakkanpalayam Revenue Villages with a total student enrolment of 52.
Table 11.11Tribal Welfare Department Run school details in Coimbatore LPA
Administration
Number
Students Enrollment
No.24 Veerapandi Part
1
5
Nayakkanpalayam
1
47
11.3.1Distribution of Higher Education Institutions in LPA
Coimbatore LPA host notable and specialized institutions such as Forest College and Research Institute (1916), Tamil Nadu Agricultural University (1971), Air Force Administrative college 1946, PSG College of Technology, Coimbatore Institute of Technology (CIT), Coimbatore Medical College, and the Government Law College.
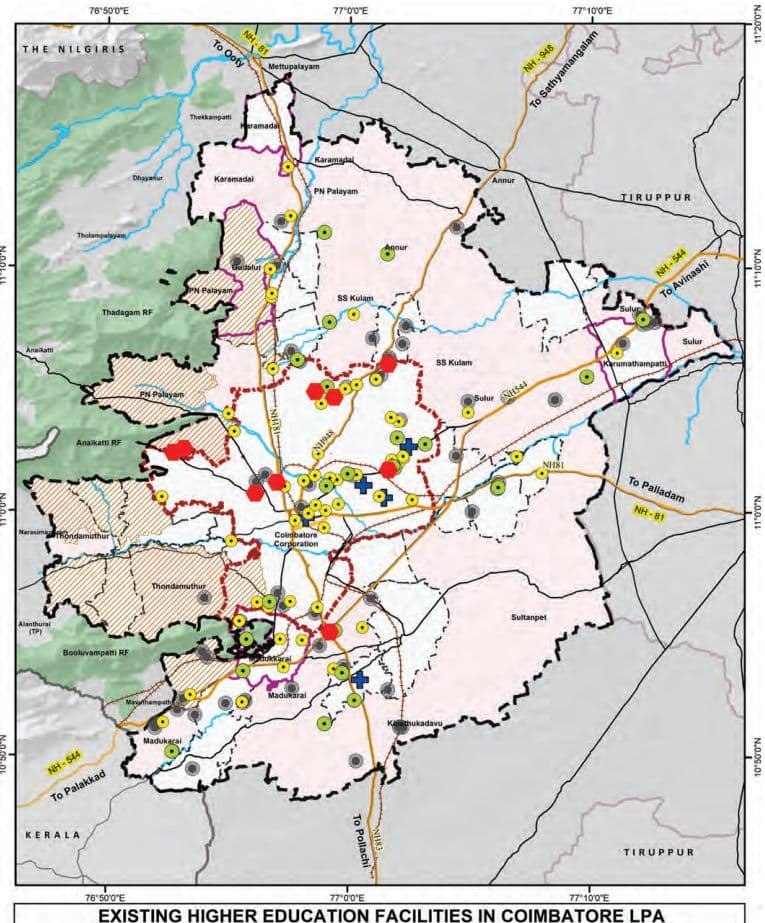
The distribution of higher education institutions is depicted in the Map 11.8. The Engineering institutions constituting 41% (73 of 180) of all institutions, with notable penetration in rural areas (25 in Revenue Villages), aligns with the region’s industrial potential. Arts & Science colleges area primarily located in the urban areas (36 out of 60 in the Corporation).
Table 11.17Category wise Distribution of Higher Education Institutions in LPA
Category
Corporation
Municipality
Town Panchayat
Revenue Villages
Total LPA
Engineering
19
6
23
25
73
Arts & Science
36
6
10
8
60
Polytechnic
8
3
4
8
23
Medical Institute
4
0
1
0
5
University
9
0
0
1
10
Others
0
0
0
9
9
Grand Total
76
15
38
51
180
Source: Directorate of Higher Education
Map 11.8: Existing Higher Education Facilities in Coimbatore LPA
11.3.2Projection and Gap analysis of Higher Education Institutions
Table 11.18URDPFI Norms for Population Threshold of Higher Education Institutions
URDPFI guideline
Services
Threshold population
Arts & Science College
1,25,000
Engineering college
10,00,000
Medical college
10,00,000
The following table presents the gap analysis of higher education institutions within the Coimbatore Local Planning Area (LPA), based on the projected population growth for the years 2021, 2031, and 2041. The analysis, carried out in accordance with the URDPFI Guidelines, indicates a consistent surplus across most categories of higher education institutions, including engineering, medical, arts, and technical colleges. The existing infrastructure is adequate to meet the needs of the projected population.
Table 11.19Projections and Gap Analysis for the Higher Education Institutions in Coimbatore LPA as per URDPFI norms
Category
Existing Institution numbers
Estimated population - 2021(31,62,392)
Estimated population -2031(42,04,955)
Estimated population -2041(58,24,706)
Required
Surplus/Gap
Required
Surplus/Gap
Required
Surplus/Gap
Technical Education
25
3
22
4
21
6
19
Arts College
60
25
35
34
26
47
13
Engineering college
73
3
70
4
69
6
67
Medical college
5
3
2
4
1
6
-1
11.4
Existing Health
Care Facilities
However, by 2041, when the estimated population reaches approximately 58.24 lakh, the demand for medical colleges is projected to slightly exceed supply, resulting in a marginal deficit of one institution. Surpluses persist in other sectors, including technical (19 institutions), arts (13 institutions), and engineering (67 institutions). This trend suggests that while the existing higher education infrastructure remains largely adequate. To cater to the projected demand by 2041, the existing medical colleges will need to be expanded with additional capacity. Strategic planning should prioritize addressing potential gaps in medical education while maintaining optimal capacity across other disciplines to align with long-term educational needs.
Coimbatore Local Planning Area (LPA) hosts a wellstructured network of healthcare facilities catering to primary, secondary, and tertiary care needs. The system includes government and private institutions that provide a range of services—from preventive and basic healthcare to advanced medical and surgical treatments. Facilities are categorized based on their service levels, ensuring accessibility from rural sub-centres to urban multispecialty hospitals. They are categorised as follows:
Table 11.20Types of Health Care Facilities
Facility Name
Care Level
Typical Services / Basic Equipment
Health Sub-Centre (HSC / SC)
Primary Care
First contact point, maternal and child care, immunization, basic first aid, referrals
Primary Health Centre (PHC)
Primary Care
Outpatient care, maternity services, immunization, treatment of minor ailments, basic diagnostic support
Urban Primary Health Centre (UPHC)
Primary Care
OPD, maternal & child health, immunization, NCD screening, basic laboratory and pharmacy services
Community Health Centre (CHC)
Secondary Care
Emergency services, labour room, diagnostic services, minor surgeries, specialist consultations
Taluk Hospital / Sub-District Hospital (SDH)
Secondary Care
General OPD and IPD, maternity care, basic surgeries, diagnostics, referral services
ESI Hospital (Medical College)
Tertiary Care
Inpatient and specialist care, ICU, diagnostics, trauma care, medical education and training
Government Hospital (GH)
Tertiary Care
Multispecialty services, surgeries, ICU, blood bank, emergency care, diagnostics
District Hospital (DH)
Tertiary Care
Comprehensive care including trauma services, surgery, ICU, multi-specialty diagnostics and treatment
Multi-specialty Hospital (Private Sector)
Tertiary Care
Advanced diagnostics, critical care, specialized surgeries, multiple specialty departments
Source:IPHS
11.4.1Distribution of Health Care Facilities
Table 11.21Distribution of Health Care Facilities in Coimbatore LPA
Category
Corporation
Municipality
Town Panchayat
Revenue Villages
Total LPA
HSC
0
0
13
47
60
UPHC
34
0
0
0
34
PHC
0
2
9
4
15
CHC/ UGPHC
0
2
2
1
5
Taluk Hospital
1
1
1
2
5
Private MSH
8
0
0
0
8
Medical College Hospital
4
0
1
0
5
Grand Total
47
5
26
54
132
Source: Health Department, Coimbatore District
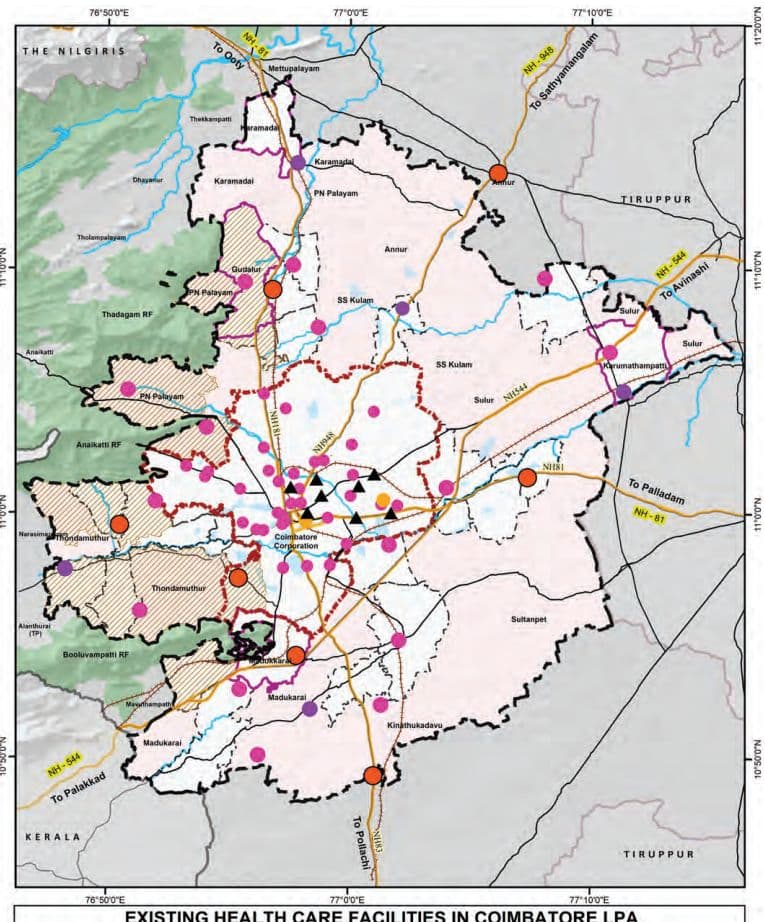
The distribution of healthcare facilities within the Coimbatore Local Planning Area (LPA) reflects a tiered system suited to the area’s urban and rural needs, with a total of 132 institutions spread across Corporation, Municipality, Town Panchayat, and Village areas. Revenue Villages have the highest number of facilities (54), followed by the Corporation (47), Town Panchayats (26), and Municipalities (5).
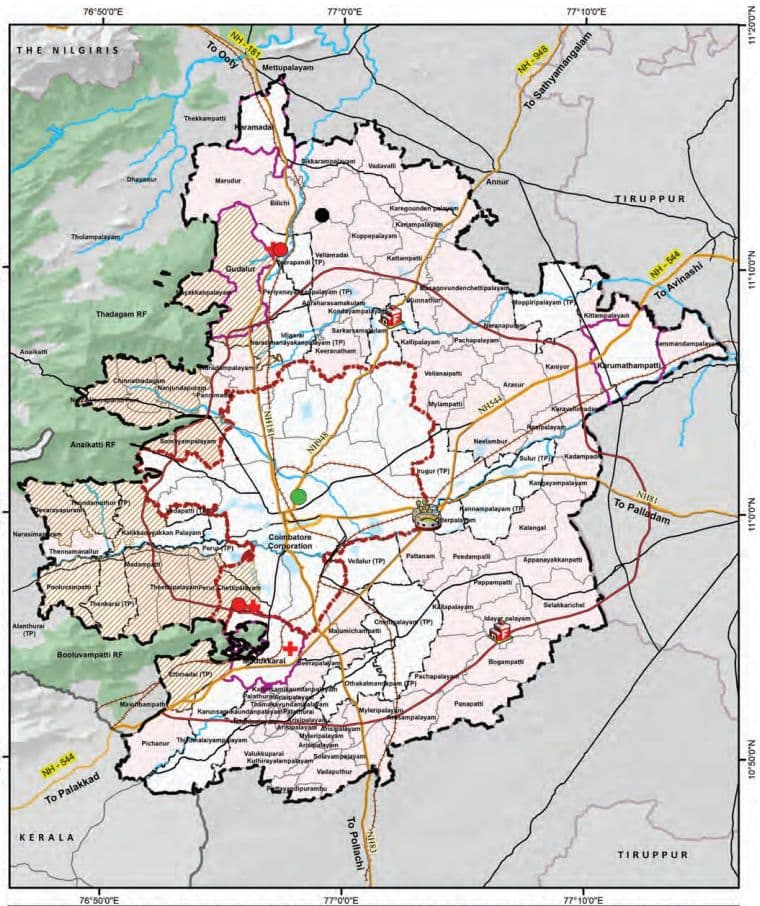
In the Corporation area there are with 34 Urban Primary Health Centres (UPHCs), 8 Private Multi-Specialty Hospitals, 1 Taluk Hospital and 2 Medical College Hospitals. These facilities cater to specialized and tertiary care.
Municipalities have a total of 5 healthcare institutions: 2 Primary Health Centres (PHCs), 2 Community Health Centres/Upgraded PHCs (CHC/UGPHCs), and 1 Taluk Hospital.
Town Panchayats have 13 HSCs, 9 PHCs, 2 CHC/UGPHCs, and 1 Taluk Hospitals, indicating a structured approach to primary and referral care in semi-urban areas.
Revenue Villages are primarily served by 47 HSCs, along with 4 PHCs, 1 CHC/UGPHC, and 2 Taluk Hospitals
Map 11.9: Existing Health Care Facilities in Coimbatore LPA
EXISTING HEALTH CARE FACILITIES IN COIMBATORE LPA
(located near the LPA boundary), showing a strong foundation in basic healthcare delivery and referral care.
Overall, the distribution ensures wide coverage of primary care in rural and semi-urban areas, while advanced and private healthcare services are concentrated in the urban areas.
11.4.1.1 Mental Health Care Units
Coimbatore has a well-established network of mental healthcare services, predominantly offered through private clinics, multi-speciality hospitals, and specialized rehabilitation centres. These facilities provide a range of services including psychiatric consultation, counselling, therapy, and long-term care, contributing significantly to the city’s mental health ecosystem. The presence of experienced mental health professionals and diverse treatment options across the private sector ensures that residents have access to quality care.
Map 11.10: Mental Health Care Facilities in Coimbatore LPA
EXISTING MENTAL HEALTH CARE FACILITIES IN COIMBATORE LPA
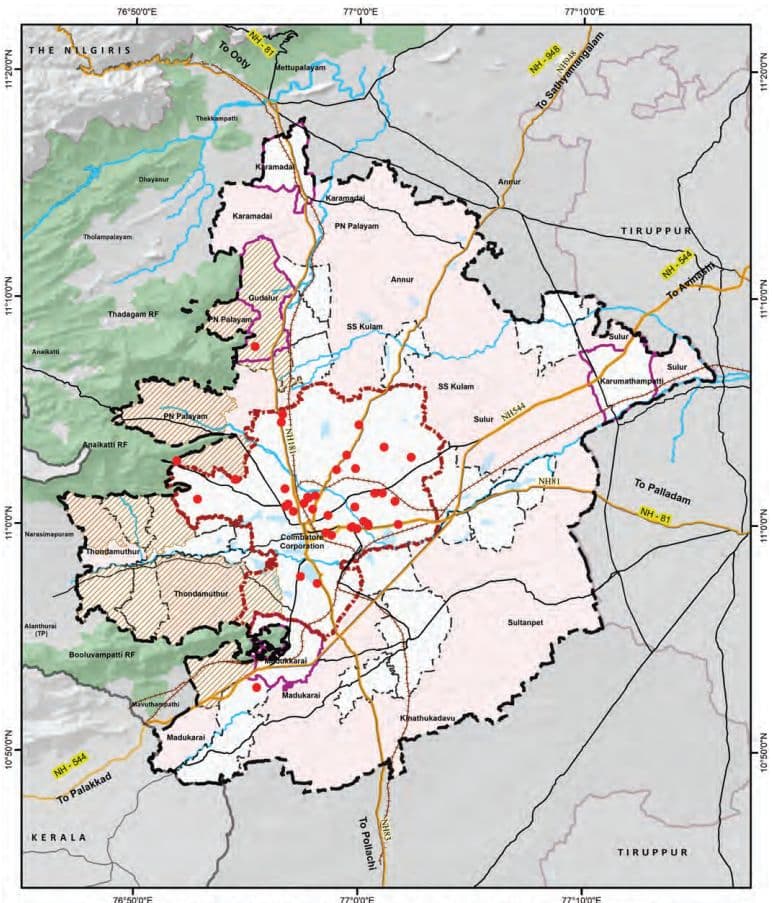
11.4.2Golden Hour Access -Health Facilities Service Coverage Analysis
The concept of the “Golden Hour” represents the critical first sixty minutes following a traumatic injury, during which timely medical intervention significantly enhances the chances of survival and reduces the risk of long-term complications. Within this timeframe, the ability to provide rapid on-site stabilization and swift transportation to a trauma care center is essential.
Access Time: While the full “golden hour” encompasses 60 minutes, studies and emergency response protocols indicate that the first 10 following an incident are especially vital for determining outcomes. In a practical scenario, however, the time taken for an ambulance to reach the site of injury and few additional time may be required to transport the patient from the site to the trauma care facility. This time taken is also depending on various factors such as terrain, traffic, and resource availability.
However, the travel time coverage modeled in this analysis is intended to represent a conservative estimate of the outbound journey, effectively accounting for a total response window of approximately 20 to 25 minutes. This approach enables the identification of areas where a patient can reasonably be reached and transported to a trauma care center within the “golden hour” framework, accounting for both directions of travel.
Coimbatore has witnessed significant growth in road infrastructure, vehicular movement, and population density. With this rapid growth comes an increased risk of road traffic accidents and associated trauma. In such a context, assessing the spatial distribution of trauma care accessibility within this practical response window becomes imperative to inform health system strengthening, infrastructure investment, and emergency preparedness planning.
11.4.2.1 Network Analysis - for the Health Care Service Coverage Analysis:
The network study is designed to identify Revenue Villages and urban areas that fall within this access zone, as well as those that remain underserved. The analysis was conducted using GIS, OpenRouteService (ORS) Tool, and Open Street Map (OSM), considering the road network.
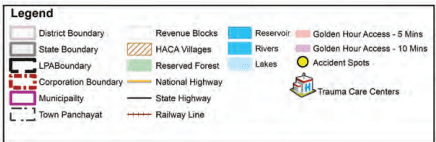
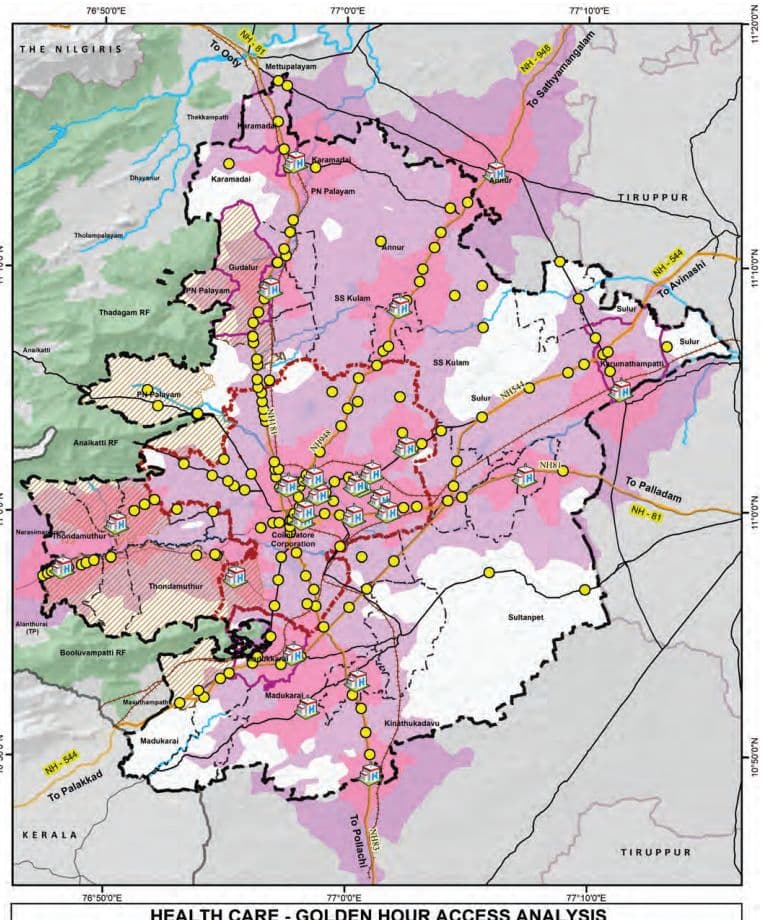
Map 11.11: Golden Hour Coverage Analysis (5-10 mins coverage)
HEALTH CARE - GOLDEN HOUR ACCESS ANALYSIS
Network Analysis Inference: The analysis of trauma care accessibility in Coimbatore LPA reveals significant spatial disparity between urban and rural regions.
• Urban areas such as the Coimbatore Municipal Corporation exhibit a high level of emergency service coverage, with approximately 95% of the area falling within the golden hour access zone.
Similarly, municipalities and town panchayats show substantial coverage levels of 85% and 81% respectively, reflecting relatively well-established road networks and proximity to health facilities.
• The Revenue Villages demonstrate a notably lower coverage of approximately 60%, indicating critical gaps in trauma care accessibility.
Around 11 Revenue Villages fall entirely outside the golden hour zone, with 0% coverage, highlighting their vulnerability in emergency situations. These include: Bogampatti, Chinnathadagam, Idayar palayam, Kallapalayam, Nanjundapuram, Naranapuram, No.24 Veerapandi Part, Pappampatti, Pichanur, Selakkarichel, and Panapatti
In addition, a few Revenue Villages have partial coverage (less than 25%) but remain significantly underserved: Pannimadai – 5%, Mylampatti – 9%, Semmandampalayam – 11%, Somayampalayam – 12%, Pachapalayam – 14% and Pottaayandipurambu – 24%.
These findings underscore the urgent need for targeted interventions in rural areas, such as enhancing road connectivity, deploying decentralized trauma response units, and expanding emergency medical infrastructure. Addressing these accessibility gaps is vital to strengthening the health care delivery system across the entire planning area and ensuring equitable health outcomes for both urban and rural populations.
11.4.3Spatial Coverage Analysis for the Health Care Facilities
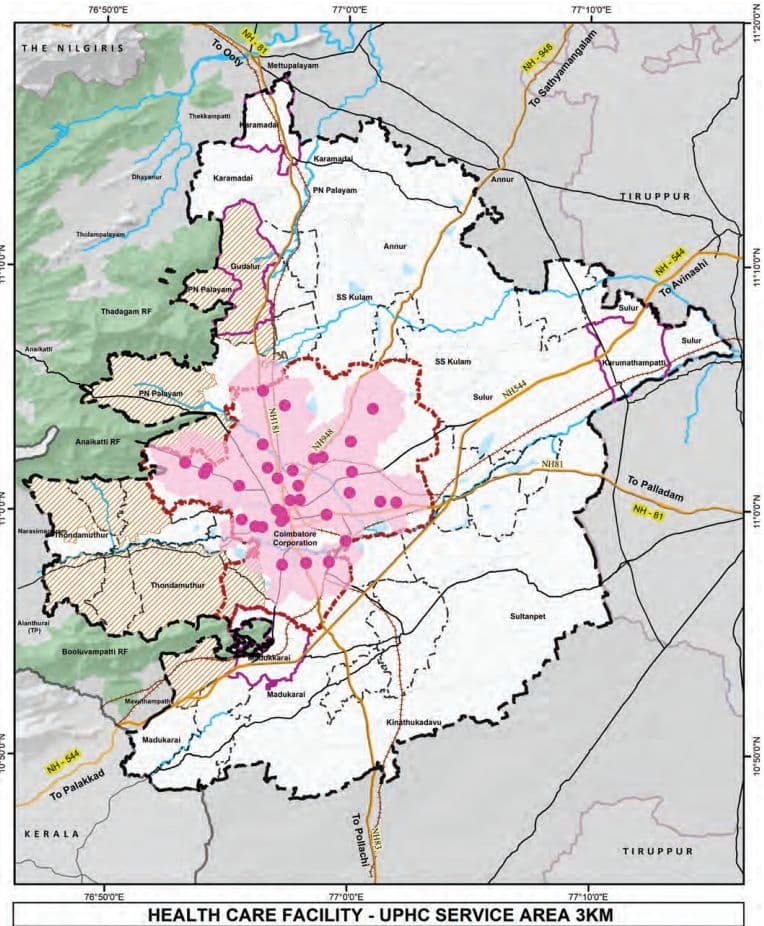
It is observed that the healthcare service coverage analysis for Coimbatore LPA reveals significant disparities in accessibility across different regions. Within the Coimbatore Corporation limits, Urban Primary Health Centers (UPHCs)
Map 11.12: Service Coverage Analysis for UPHC facilities (3Km)
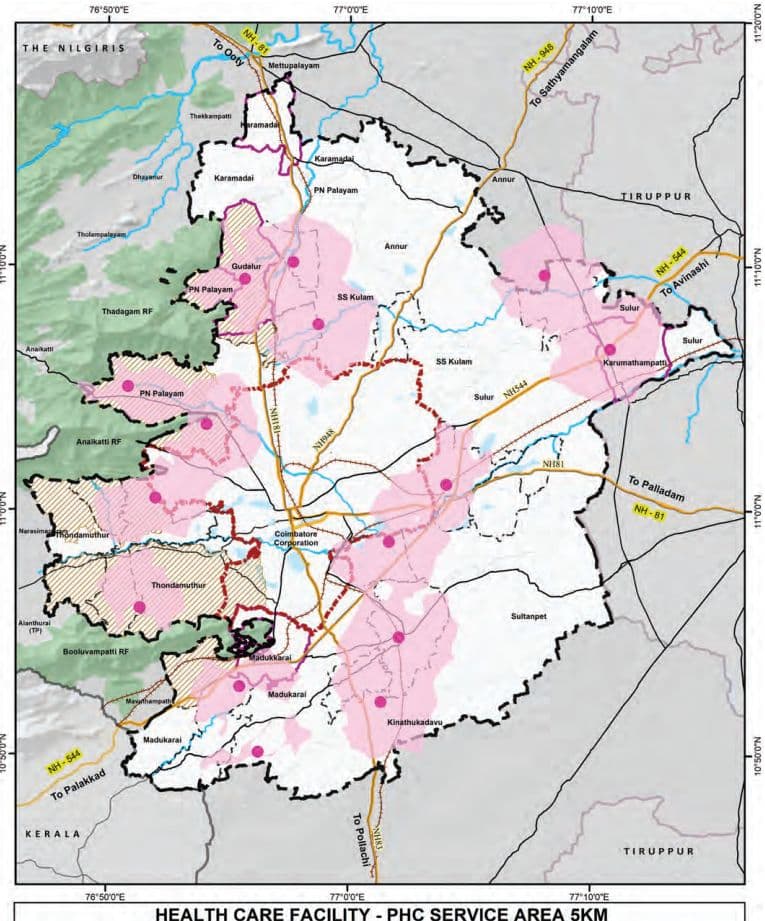
Map 11.13: Service Coverage Analysis for PHC facilities (5Km)
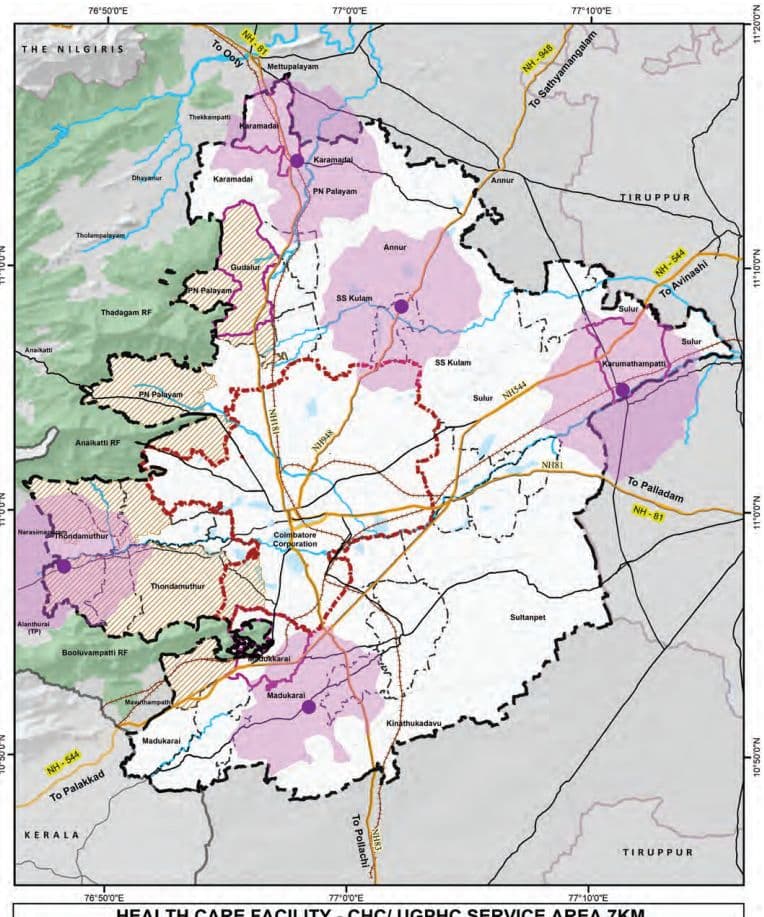
Map 11.14: Service Coverage Analysis for UPHC facilities (7Km)
HEALTH CARE FACILITY - CHC/ UGPHC SERVICE AREA 7KM
provide nearly complete coverage, ensuring adequate primary healthcare services for urban residents.
However, in rural areas, Primary Health Centers (PHCs) are predominantly located along major transportation corridors, leaving many interior Revenue Villages with limited access to basic medical care. For secondary healthcare needs, Community Health Centers (CHCs) and Upgraded PHCs, in the northern and southern parts of the LPA offer sufficient coverage.
A concerning gap exists in the eastern region, which lacks both primary and secondary healthcare facilities, creating a significant service void for the local population. This imbalance highlights the urgent need for strategic expansion of healthcare infrastructure, particularly in the underserved eastern rural areas.
11.4.4Distribution of Beds in Hospitals
As per the Indian Public Health Standards (IPHS) guidelines, essential beds refer to the minimum required inpatient beds provided in public health facilities. These facilities form the backbone of the public healthcare delivery system, focusing on accessible and affordable primary and secondary healthcare. The desirable beds are those available over and above the essential bed count in all facilities, including the advanced and tertiary care facilities. While not mandated under IPHS, desirable beds are critical for addressing complex health needs and emergencies and play a vital role in comprehensive healthcare provisioning in urban areas.
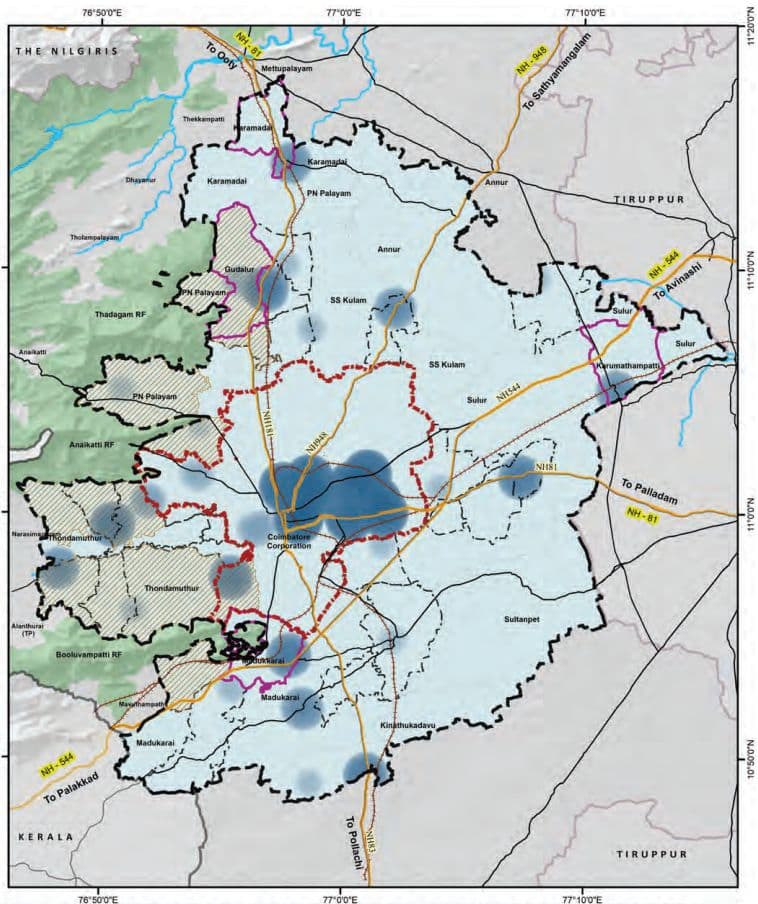
Map 11.15: Heat Map of Health Care Facilities -Beds in Coimbatore LPA
HEAT MAP OF NUMBER OF HEALTH CARE BEDS IN COIMBATORE LPA
Table 11.22Distribution of Hospital Beds in Coimbatore LPA
Category
Corporation
Municipality
Town Panchayat
Revenue Villages
Total LPA
Essential Beds
HSC
-
-
13
52
65
UPHC
49
-
-
-
49
PHC
-
10
54
13
77
CHC/ UGPHC
-
60
60
30
150
Taluk Hospital
50
60
183
-
293
Total (Essential beds)
99
130
310
95
634
Desirable Beds
Private MSH
2400
-
-
-
2400
Medical College Hospital
600
-
-
-
600
Total
3000
0
0
0
3000
Grand Total (Desirable Beds)
3099
130
310
95
3634
The distribution of hospital beds within the Coimbatore Local Planning Area (LPA) highlights the natural healthcare hierarchy that supports the needs of both urban and rural populations. Advanced tertiary healthcare facilities—comprising private multi-specialty hospitals and medical college hospitals—are primarily concentrated within the Corporation limits, accounting for approximately 3,000 of the total 3,634 beds, ensuring high-quality medical services at the urban core. At the same time, essential healthcare infrastructure, including Primary Health Centres (PHCs), Community Health Centres (CHCs), and Taluk Hospitals, is well-represented across Town Panchayats, contributing to broad and inclusive service coverage.
11.4.5 Projections and Gaps of Health Care Facilities in Coimbatore LPA Table 11.23: Indian Public Health Service Guidelines for the Health care Facilities
IPHS guideline
Services
Population per Unit
Bed Norms
HSC
5,000
Essential bed norms: 1 bed for 1000 people Desirable bed norms: 2 bed for 1000 people
UPHC (Urban)
50,000
PHC
30,000
UGPHC/ CHC (Rural)
1,20,000
Taluk / Sub-District Hospital
10 lakh
District Hospital
1 DH per District
According to the Indian Public Health Standards (IPHS) 2022 guidelines, in alignment with the National Health Policy, 2017, the recommended provision of hospital beds is based on a norm of one bed per 1,000 population as an essential requirement, with two beds per 1,000 population as the desirable target to strengthen the public healthcare delivery system.
The essential number of hospital beds is to be met exclusively through infrastructure available under the public sector, including Primary Health Centres (PHCs), Health Sub-Centers (HSCs), Community Health Centres (CHCs), Sub-District Hospitals (SDH) or Taluk Level Hospitals, and District Hospitals (DH). It is also explicitly stated that beds available in tertiary care institutions such as Medical College Hospitals shall not be included in the calculation of essential bed requirements but in the desirable bed count, as such institutions serve a wider catchment area beyond a single district.
Similarly, beds available in private healthcare facilities, including private multi-specialty hospitals, are excluded from the calculation of essential public sector capacity. However, in the context of achieving the desirable norm, the contribution of the private sector and other institutional healthcare providers—such as those operated by the Railways, Armed Forces, Employees’ State Insurance (ESI), and Public Sector Undertakings (PSUs)—may be
considered, particularly in regions where these facilities provide accessible and functional inpatient care for more than 24 hours.
These norms ensures that the public healthcare system is independently capable of meeting the minimum inpatient care needs of the district population, irrespective of the availability of tertiary or private healthcare infrastructure.
Table 11.24Projections – Healthcare Facilities in Coimbatore LPA
Gaps
Health Care Facilities 2021
Health Care Facilities 2031
Health Care Facilities 2041
Area Requirement 2041 (in Sq.Km)
Population 2021
UPHC / PHC
CHC / UGPHC
Population 2031
UPHC / PHC
CHC / UGPHC
Population 2041
UPHC / PHC
CHC / UGPHC
UPHC / PHC
CHC / UGPHC
Corporation
20,51,719
-7
0
27,64,842
-21
0
39,03,784
-44
0
0.088
0
Municipality
1,82,262
-2
0
2,36,449
-2
0
3,05,996
-4
-2
0.008
0.006
Town Panchayats
3,73,063
-6
0
4,59,188
-9
0
5,67,685
-12
2
0.026
0
Annur Block
50,183
-2
0
58,115
-2
0
67,518
-2
-1
0.004
0.003
Karamadai Block
23,784
-1
0
28,728
-1
0
34,773
-1
0
0.002
0
Kinathukadavu Block
25,762
-1
0
31,727
-1
0
39,204
-1
0
0.002
0
Madukarai Block
58,010
0
1
79,610
-1
0
1,13,727
-2
0
0.004
0
PN Palayam Block
1,47,011
-3
-1
2,21,134
-5
-2
3,49,514
-10
-3
0.02
0.009
SS kulam Block
34,520
-1
0
39,984
-1
0
46,338
-2
0
0.004
0
Sultanpet Block
27,250
-1
0
Table 11.25Projections - Healthcare Facilities (Taluk Hospitals) in Coimbatore LPA
Gap
Health Care Facilities 2021
Health Care Facilities2031
Health Care Facilities2041
Area Requirement by 2041 (in Sq. Km)
Population2021
Taluk Hospital
Population2031
Taluk Hospital
Population2041
Taluk Hospital
Annur Taluk
1 07284
1
1 25096
1
1 46273
1
0
Coimbatore (North) Taluk
71 7620
-1
1 1 77698
-1
2002386
-2
0.01
Coimbatore (South) Taluk
1 1 9 1 951
-1
1 3521 64
-1
1 5339 1 2
-2
0.01
Kinathukadavu Taluk
25762
1
3 1 727
1
39204
1
0
Madukkarai Taluk
500547
0
700283
0
993856
0
0
Mettupalayam Taluk
701 85
1
89953
1
1 1 5558
1
0
Perur Taluk
21 8903
1
283750
1
374461
1
0
Su lur Taluk
3301 41
1
444285
1
61 9055
0
0
Gap in Total Coimbatore LPA
3 1 ,62,392
-2
42,04,955
-2
58,24,706
-4
0.04
As per the projected population for the year 2041, Coimbatore Local Planning Area (LPA) is expected to require a significant addition in primary and secondary health facilitiesIn 2021, there was a deficit of 31 UPHCs/ PHCs and 2 CHCs/UGPHCs. By 2041, the required numbers of these facilities would increase to 91 and 7 respectively, to serve a projected population of 58.24 lakh. The Coimbatore Corporation area alone will require 44 additional UPHCs by 2041. For the additional health care facilities, a total area of 0.21 Sq.km is assessed.
Taluks such as Coimbatore North and South lacks taluk hospitals and hence these taluks will require taluk hospital to meet the growing demand. A cumulative area of 0.02 Sq.km will be required for these additional taluk hospitals, while others like Perur and Mettupalayam will be comparatively better equipped by 2041. This also indicates the requirement for substantial augmentation of primary and community-level healthcare facilities to meet the growing demand.
Table 11.26Demand and Gap Analysis of beds requirement for Overall LPA
Category
Existing Health facilities in Coimbatore LPA
Estimated population - 2021(31,62,392)
Estimated population -2031(42,04,955)
Estimated population - 2041(58,24,706)
Required
Surplus/Gap
Required
Surplus/Gap
Required
Surplus/Gap
Essential Beds
UPHC
634
553
81
613
21
726
-92
HSC & PHC
CHC/UGPHC
Taluk Hospital
Desirable Beds
UPHC
3000
700
2300
700
2300
700
2300
HSC & PHC
CHC/UGPHC
Taluk Hospital
Based on IPHS norms, Coimbatore will need a 100 essential bedded hospital by 2041, which is expected to be met through the proposed taluk hospitals.
The number of desirable beds available in private hospitals and medical colleges is in surplus of 2300 beds even for the projected demand of 2041.
In conclusion, bridging the projected gap in essential bed capacity while ensuring strategic utilization of the surplus desirable beds will be critical to achieving an inclusive, responsive, and resilient health system in Coimbatore LPA.
11.4.6 Veterinary Hospital Facilities
Table 11.27Existing and Projected Gap by 2041 - for the Veterinary Hospital Facilities
Taluk
Existing Veterinary Hospitals
Gap analysis of Veterinary Hospitals -(Deficit by 2041)
Population Threshold
1 unit per 50000 Population
Annur
1
1 (Surplus)
Coimbatore (North)
3
-1 (0.002 sq.km)
Coimbatore (South)
0
-3 (0.006 sq.km)
Kinathukadavu
0
0 (Surplus)
Madukkarai
1
-1 (0.002 sq.km)
Mettupalayam
0
0 (Surplus)
Perur
1
0 (Surplus)
Sulur
1
0 (Surplus)
Total Deficit
7
-5 (0.010 sq.km)
Source: TNGIS (Existing Data), URDPFI (Norms)
Map 11.16: Distribution of veterinary Hospitals in Coimbatore LPA
EXISTING VETERINARY HOSPITAL FACILITIES IN COIMBATORE LPA
11.5 Recreational Facilities
The existing Veterinary Hospital facilities are primarily concentrated along the three major roads namely Avinashi road, Sathy Road and Mettupalayam Road, leaving peripheral regions underserved.
A gap analysis of veterinary hospitals in the Coimbatore Local Planning Area (LPA), based on the URDPFI guideline of one veterinary hospital facility per 50,000 population, highlights a total deficit of 5 veterinary hospitals by 2041.
While Taluks such as Annur, Kinathukadavu, Mettupalayam, and Perur show adequate or surplus facilities, deficits are observed in few taluks namely: Coimbatore (North), Coimbatore (South), and Madukkarai, with Coimbatore (South) having the highest shortfall of three hospitals. Establishing additional veterinary hospitals in deficit areas is essential to meet future demand and ensure equitable access to animal healthcare services across the LPA.
The recreational facilities play a vital role in enhancing the quality of life and well-being of urban residents as well as offering a diverse range of recreational opportunities catering to various age groups and socio-economic segments. Coimbatore is endowed with a mix of natural, cultural, and built recreational assets, including parks, stadiums, sports complexes, cultural venues, informal gathering spaces, and lakes.
11.5.1Parks and Open spaces
While Coimbatore Corporation spans a total area of 257.81 sq.km, a cumulative 2.43 sq.km has been designated as parks and open spaces. These include various typologies such as Community Parks (CPS), Open Space Reservations (OSR), public parks, playfields, and public purpose lands as listed below in the table.
Table 11.28Category wise distribution of Parks and Open Spaces
Category
Total Count
CPS
190
OSR
230
PARK
1466
PLAY FIELD
39
PUBLIC PURPOSE
320
TOTAL
2,245
Source: Coimbatore Corporation
In the Coimbatore Corporation, a total of 2,245 sites is designated for recreational and open spaces. This comprises 1,466 parks, 230 Open Space Reservation (OSR) sites, 190 CPS sites, 39 playfields, and 320 public purpose sites. These spaces play a vital role in enhancing urban livability, providing recreational, ecological, and community services across the LPA.
Table 11.29Proposed Open Spaces (across sectors) in the Master Plan
Particulars
Area in Sq.km
Existing Recreational Open Space
2.43
Lake Conservation Area
0.43
River Conservation Area
2.48
Proposed Ecoparks
16.12
Total Open Space
21.46
Map 11.17: Existing Parks and Open Spaces in Coimbatore Corporation
77°0'0"E
Existing Parks and Open Spaces in Coimbatore Corporation
Directorate of Town & Country Planning - Tamil Nadu
DATA SOURCE Coimbatore Corporation DTCP, Coimbatore
DIRECTORATE OF TOWN & COUNTRY PLANNING - TAMIL NADU
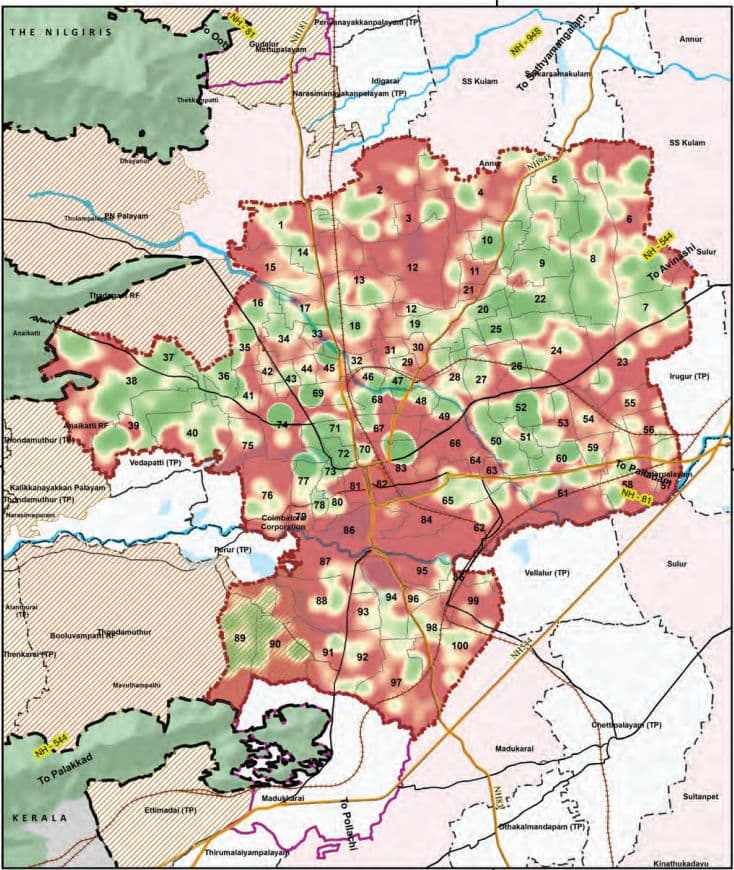
Map 11.18: Heat Map of Parks and Open Spaces in Coimbatore Corporation
77°0'0"E
77°0'0"E
Heat Map of Existing Parks and Open Spaces in Coimbatore Corporation
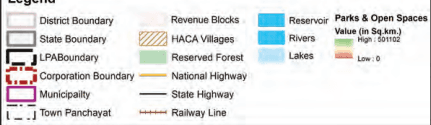
Legend
Planning Norms and Standards:
According to the URDPFI Guidelines, a minimum of 10–12 sq.m of open space per person is desirable and recommended in urban areas. This includes recreational green spaces such as parks, playgrounds, gardens, and public open lands that contribute to physical and mental well-being, environmental sustainability, and community interaction.
URDPFI Guideline Norm: 10–12 sqm per person
Coimbatore LPA (2041): 3.68 sqm per person (approx.) expected.
After accounting for the existing recreational open spaces, proposed lake and river buffers, and planned ecoparks—amounting to a total of 21.46 sq.km—an additional 36.79 sq.km of open space will be required by 2041. To support this future need, enhancing access to green spaces and recreational areas will be key to promoting urban liveability, public health, and environmental sustainability.
11.5.2Unique Recreational Facilities
Coimbatore is home to a range of unique recreational facilities that contribute significantly to the city’s ecological, educational, and tourism value. Key among them are botanical gardens, zoos, nature parks, and eco-tourism destinations, which collectively offer not only leisure but also environmental awareness and biodiversity conservation.
TNAU Botanical Garden: Located within the Tamil Nadu Agricultural University (TNAU), this garden serves as a green lung within the city. It showcases a wide variety of plant species, including medicinal, ornamental, and endemic varieties, supporting both academic and public engagement.
VOC Park and Zoo: Located in the city center, the park includes a mini zoo that attracts thousands of visitors annually. Though modest in size, it remains one of the most accessible nature-centric recreational spaces in the city.
The proximity to the Western Ghats, particularly locations such as Marudhamalai, Velliangiri Hills, and Siruvani, enhances the city’s access to ecotourism and trekking activities. These areas are frequently visited for spiritual tourism, nature walks, and weekend retreats.
11.5.3Multipurpose Grounds
Multipurpose grounds play an essential role in enhancing the social infrastructure of urban areas by providing open, adaptable spaces that can accommodate a variety of public activities, including exhibitions, sports events, cultural programs, and emergency functions. In the Coimbatore Local Planning Area (LPA), the availability of such grounds is limited, with only two major multipurpose venues presently serving the city: the CODISSIA Trade Fair Complex and the Race Course Police Grounds.
CODISSIA Trade Fair Complex: Located near the Coimbatore International Airport in Peelamedu, the CODISSIA Trade Fair Complex is a prominent facility that regularly hosts industrial exhibitions, trade fairs, product expos, and conferences. Developed and managed by the Coimbatore District Small Industries Association (CODISSIA), this ground plays a critical role in supporting Coimbatore’s industrial and entrepreneurial ecosystem. While it primarily functions as a trade and exhibition venue, its vast open area allows for temporary adaptation for cultural and public events as needed.
Race Course Police Grounds: Situated in the central part of the city along the Race Course Road, the Police Grounds serve as another important multipurpose venue. Though primarily designated for official and ceremonial functions, including police parades and government events, public gatherings, awareness campaigns, and sports meets on certain occasions.
11.5.4Stadium and Sports Infrastructure
Coimbatore has a modest yet significant sports infrastructure supporting professional, academic, and community-level activities.
District stadium: Jawaharlal Nehru Stadium is a major district-level multi-purpose stadium, primarily used for football and athletics. It has a seating capacity of around 30,000 and is owned by the Coimbatore Municipal Corporation
Sports Complexes like the District Sports Complex (Peelamedu) provide indoor courts and coaching. Several private clubs and educational institutions also maintain sports grounds, though access is often limited.
Green Corridor in Race Course is situated centrally in Coimbatore near Town Hall locality. The Race Course is a
11.6 Safety and Emergency Services
popular 2.2 km green corridor known for walking, jogging, and fitness activities. The Coimbatore Race Course was originally developed during the British colonial period as a horse racing track. Over time, it evolved into a public recreational space. Today, while horse racing no longer takes place, the area remains a prominent civic landmark, symbolizing Coimbatore’s colonial heritage and urban transformation. At present, it is surrounded by elite clubs and recreational amenities, and it enhances urban livability by offering open space, wellness opportunities, and social engagement, playing a vital role in the city’s social infrastructure.
Race Clubs: Coimbatore hosts prominent race clubs and facilities that have significantly contributed to the growth of motor racing in the country.
Coimbatore Auto Sports Club (CASC): Located in R.S. Puram, it is among India’s oldest motorsport clubs, organising rallies, hill climbs, and autocross events under FMSCI, and plays a key role in nurturing local racing talent.
Kari Motor Speedway: Situated in Chettipalayam, around 20 km south of the city centre along the Coimbatore–Pollachi Highway (NH 83), this 2.1 km Kari Motor Speedway has hosted national races since 2003. It serves as a premier circuit for training and professional motorsport events.
Rifle Club, located near Avinashi Road, provides professional shooting facilities and training in rifle and pistol sports. It promotes physical discipline and skill development among youth and enthusiasts.
Ensuring the safety, security, and well-being of the population is a fundamental responsibility of urban governance. Within the Coimbatore Local Planning Area (LPA), the provision and spatial distribution of safety and emergency services—including police stations, fire stations, and correctional facilities—are essential components of a resilient urban framework. These services play a crucial role in upholding law and order, responding to emergencies, managing disasters, and reinforcing public confidence in institutional systems.
Table 11.30Existing Safety and Emergency Services in Coimbatore LPA
Existing Number of Safety and Emergency Services - Facilities in the Coimbatore LPA
Location
Police Station
Fire Station
Prison /Jail
Corporation
15
5
1
Total Municipalities
3
2
0
Town Panchayats
6
3
0
Annur Block
0
0
0
Karamadai Block
0
0
0
Kinathukadavu Block
0
1
0
Madukarai Block
0
0
0
PN Palayam Block
2
0
0
SS kulam Block
0
0
0
Sultanpet Block
0
0
0
Sulur Block
0
0
0
Thondamuthur Block
1
0
0
Total Existing Facilities in LPA
27
11
1
Source: TNGIS, Tamil Nadu Fire and Rescue Department
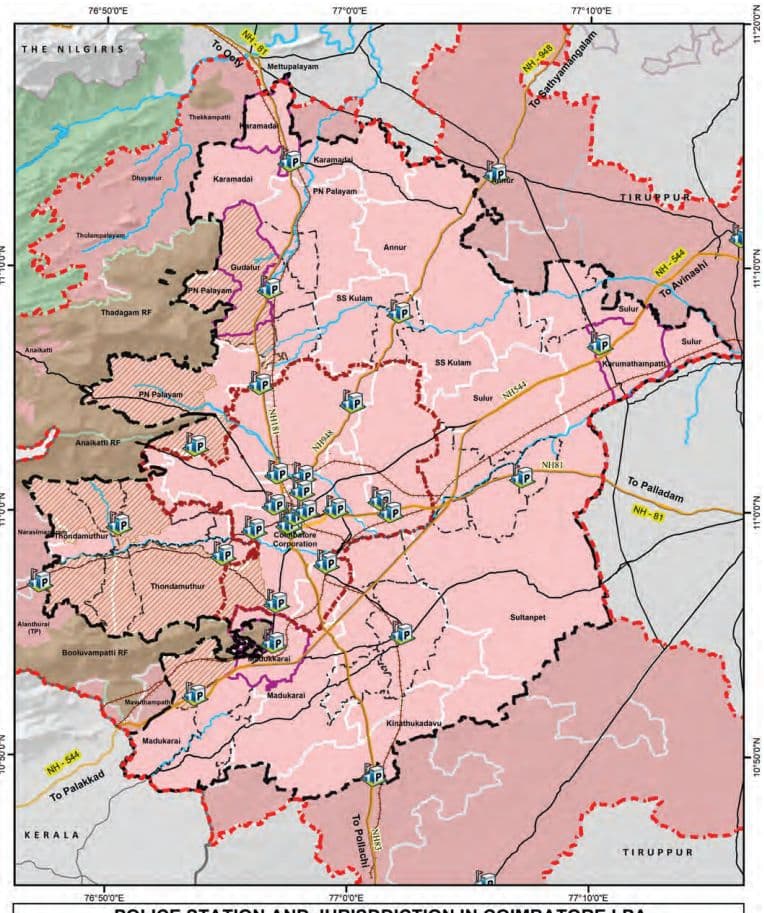
Map 11.19: Existing Police Stations and Jurisdiction in Coimbatore LPA
POLICE STATION AND JURISDDICTION IN COIMBATORE LPA
11.6.1Police Stations
Police stations form the primary interface between law enforcement agencies and the community. Their location must be based on population density, and urban growth patterns to ensure prompt response and effective coverage.
Planning Area (LPA) currently hosts a total of 33 police station serving the LPA. However location wise, only 27 police stations are present within the LPA region, with a significant concentration of 15 stations within the Corporation limits, followed by 6 in Town Panchayats and 3 in Municipalities. Among the rural blocks, PN Palayam (2) and Thondamuthur (1) are the only ones with police stations. This distribution indicates a relatively balanced allocation of police services between the urban core and peripheral areas.
11.6.2Fire Stations
Fire stations are critical for emergency response and disaster mitigation. Their siting should consider response time radius, risk-prone zones (industrial clusters, high-rise areas, markets), road accessibility, and water availability. The inclusion of fire safety infrastructure in high-density and periurban zones is necessary to address the rising complexity of urban emergencies.
The Coimbatore LPA has a total of 11 fire stations, with 5 located in the Corporation area, 3 in Town Panchayats, 2 in Municipalities, and 1 in Kinathukadavu block. There is an additional fire station located very close to the LPA serving the LPA area.
11.6.2.1 Fire Station Service Coverage Analysis – Coimbatore LPA
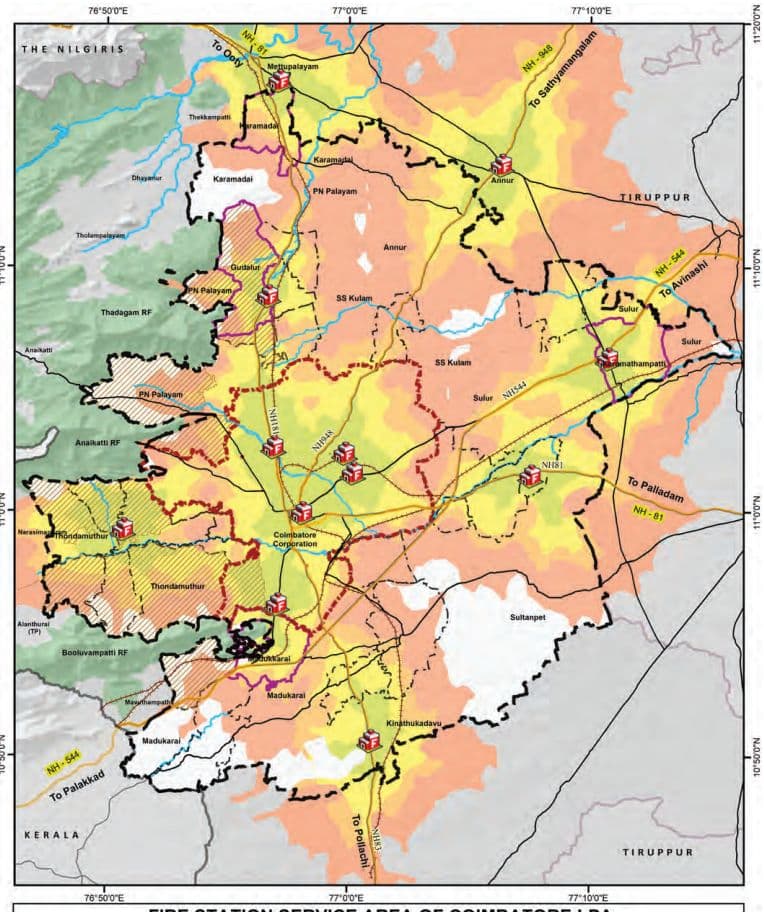
As per the NDMA guidelines, a fire service response time of 5 minutes is recommended for urban areas, while 20 minutes is suggested for rural areas. An assessment of fire station service coverage across the Coimbatore Local Planning Area (LPA) reveals critical gaps in emergency response accessibility, particularly in rural revenue blocks. The analysis categorizes service levels based on response times:
Well-Served Revenue Blocks (5–8 Minute Response Time): Optimal fire service coverage is concentrated in Coimbatore Corporation and its immediate vicinity,
Map 11.20: Fire Stations and its Service Area in Coimbatore LPA
FIRE STATION SERVICE AREA OF COIMBATORE LPA
supported by strong infrastructure. Select areas of Madukkarai and P.N. Palayam revenue blocks also benefit from this coverage due to proximity to urban fire stations.
Areas with 10-15 Minute Response Time Several rural revenue blocks, including Sulur, Annur, Kinathukadavu, Thondamuthur, and Karamadai, experience suboptimal response times.
Areas with more than 15 Minute Response Time: Remote portions of Sulthanpet, Sulur, Annur, Karamadai, Thondamuthur, and Kinathukadavu revenue blocks— especially in western forest-fringe areas—remain outside reliable response zones. The absence of nearby fire stations and poor rural connectivity leaves these communities highly vulnerable during fire emergencies Although the assessment indicates certain underserved areas in terms of fire service coverage, the response times still fall within the acceptable limits prescribed by the NDMA guidelines.
11.6.2.2 Fire Accident Data for Coimbatore District
The escalating fire incidents in Coimbatore District, particularly in public spaces and industrial zones, underscore systemic vulnerabilities in fire-resilient infrastructure. The concentration of fires in such high-occupancy areas may highlight the inadequate compliance with regulations and insufficient fire-safe spatial planning. This signals the gap and necessity for accessible emergency corridors and decentralized fire stations. Urban policies must leverage geospatial data to retrofit high-risk clusters.
Type of Occupancy
Number of Casualties (Injuries / Fatalities)
67
Last five years Fire Accident Details
Table 11.31Fire Accidents in Coimbatore District
Year
Small
Medium
Serious
Total
Saved
Injured
Death
Residential
Commercial
Industrial
Public Place
2020
978
9
4
99 1
1 8
0
1 6
1 71
85
94
640
2021
797
1 4
2
81 3
4
0
1
1 39
81
1 1 3
480
2022
1 079
43
2
1 094
1
0
2
1 85
98
1 44
666
2023
1 658
25
3
1 687
1 2
7
7
21 9
1 35
1 3 1
1 207
2024
1 558
1 9
1 0
1 587
24
0
9
1 93
1 37
1 37
1 1 30
2025 (til l Date
868
5
2
875
1
0
2
66
53
67
690
03.04.2025)
11.6.3 Prison and Jail
Correctional facilities such as prisons and jails, while serving a custodial function, must also align with broader objectives of rehabilitation and reintegration. Their planning requires careful consideration of land availability, environmental impact, access to judicial institutions, and secure buffer zones.
In the Coimbatore LPA, one prison/jail facilities exist, and is located within the Coimbatore Corporation area.
11.6.4Projections and Gaps for the Safety and Emergency Services
Table 11.32URDPFI Guidelines for the Safety and Emergency Services
Category
Population Threshold per Unit as per URDPFI Guidelines
Police station
90,000
Fire station
2,00,000
District Jail
10,00,000
Source: URDPFI
As per the URDPFI Guidelines, the recommended norms include: one police station per 90,000 persons, one fire station per 2,00,000 persons or within a 5–7 km radius, and these are assessed as per Administrative Boundaries. Whereas one prison per 10 lakh persons, assessed at the taluk level due to the larger population threshold and broader custodial functions. These benchmarks serve as a planning standard for assessing infrastructure adequacy and determining future requirements in the Coimbatore LPA.
Table 11.33Demand and Gap Analysis of Safety and Emergency Services
Deficit and the Area Required as per URDPFI for the Amenities
Admin
Police Station
Fire Station
Total Area in sq.km
Population Threshold
90000
200000 or Radius of 5-7km
-
Corporation
-3 (-0.045)
-15 (-0.15)
-0.065
Total Municipalities
-1 (-0.015)
(Surplus)
-0.015
Town Panchayats
-1 (-0.015)
(Surplus)
-0.015
Annur Block
-1 (-0.015)
0
-0.015
Karamadai Block
0
0
0
Kinathukadavu Block
0
(Surplus)
(Surplus)
Madukarai Block
-1 (-0.015)
-1 (-0.01)
-0.025
PN Palayam Block
-2 (-0.03)
-2 (-0.02)
-0.05
SS Kulam Block
-1 (-0.015)
0
-0.015
Sultanpet Block
0
0
0
Sulur Block
-3 (-0.045)
-1 (-0.01)
-0.055
Thondamuthur Block
0
0
0
Total Deficit in LPA
-12 (-0.18)
-19 (-0.08)
-0.26
Deficit and the area required for Police Station: There is a deficit of 12 police stations, requiring 0.18 sq.km of land. The Corporation area has the largest shortfall with 3 stations, followed by Sulur (3) and PN Palayam (2). Minor deficits are also observed in Madukkarai, SS Kulam, and Annur. These gaps align with urban expansion, high-density settlements, and emerging peri-urban clusters. Areas such as Karamadai, Sultanpet, Thondamuthur, and Kinathukadavu show no deficit, indicating current adequacy.
Deficit and the area required for Fire Station: As per the population threshold in URDPFI guidelines, the LPA requires large number of additional fire stations. There is a deficit of 15 Fire Stations in the Corporation and 4 in the Rest of the LPA. However, Corporation is spatially covered with adequate number of fire stations. Hence the deficits are found in PN Palayam, Sulur, and Madukkarai blocks. Overlay of the Fire Station network analysis and the gap identified in it can be considered for proposal of any additional fire stations, rather considering the population threshold guided deficits for the fire station.
11.7 Socio-Cultural Facilities
The socio-cultural infrastructure in Coimbatore LPA comprises key public amenities that play a vital role in enhancing the quality of urban life. These include public libraries, post offices, community halls, marriage halls, crematorium and burial grounds. Collectively, these facilities foster social interaction, cultural expression, civic engagement, and community well-being.
Table 11.34Taluk-wise Existing Socio-Cultural Facilities in Coimbatore LPA
Taluks
Orphanages
Old Age homes
Regulated Markets
Uzhavar Sandhai
Post Offices
Annur
3
0
0
0
0
Coimbatore (North)
7
4
0
0
8
Coimbatore (South)
16
5
1
2
19
Kinathukadavu
0
0
0
0
0
Madukkarai
2
2
0
1
2
Mettupalayam
1
0
1
0
0
Perur
3
10
1
2
5
Sulur
1
0
1
1
0
Total Existing Facilities in LPA
33
21
4
6
34
Source: TNGIS, Open Source
The facilities such as orphanages, old age homes, regulated markets, Uzhavar Sandhais (farmers’ markets), and post offices are assessed across nine taluks in the LPA, since they serve a large region and population threshold. Whereas the other facilities such as Libraries, Anganwadi, bank Facilities and Community halls are assessed at administrative level.
Table 11.35Administration-wise Existing Socio-Cultural Facilities in Coimbatore LPA
Admin
Library
Anganwadi
Bank Facilities
Community Halls
Corporation
74
524
200
225
Total Municipalities
25
64
0
0
Town Panchayats
30
146
0
0
Annur Block
3
41
0
0
Karamadai Block
2
16
0
0
Kinathukadavu Block
0
16
0
0
Madukarai Block
3
29
0
0
PN Palayam Block
13
49
0
0
SS kulam Block
1
19
0
0
Sultanpet Block
2
18
0
0
Sulur Block
8
56
0
0
Thondamuthur Block
3
18
0
0
Total Existing Facilities in LPA
164
996
200(Data available for Corp Only)
225(Data available for Corp Only)
Source: Coimbatore Corporation, TNGIS, Open Source
11.7.1Library
The District Central Library, located in the heart of Coimbatore city, functions as the primary library for the entire district. Along with its network of branch libraries, parttime centres, and village libraries, it forms a robust public knowledge system within the Coimbatore LPA. The District Library serves as the central knowledge hub, while branch libraries ensure balanced access across urban and semi-urban areas. Part-time libraries support smaller communities with flexible services, and village libraries enhance grassroots literacy in rural regions.
The libraries continue to serve as a critical educational and intellectual resource, promoting literacy and lifelong learning, and contributing significantly to the social and cultural development of the region.
Table 11.36Existing Library Facilities in Coimbatore LPA
S. No
Library
Corporation
Rest of LPA
Total No.
1
District Library
1
-
1
2
Branch Library
28
28
61
3
Part-time Library
12
19
31
4
Village Library
33
43
71
Source: Local Library Authority, Coimbatore
The Coimbatore LPA hosts a diverse library network comprising 1 District Library, 61 Branch Libraries, 31 Parttime Libraries, and 71 Village Libraries.
When assessed based on administrative divisions, there are 164 libraries in the Coimbatore LPA, with the Corporation area accounting for the largest share—74 in total. Town panchayats and municipalities have 30 and 25 libraries respectively. Among the rural blocks, PN Palayam Block has 13 libraries and Sulur Block has 8. On the other hand, blocks such as Kinathukadavu and SS Kulam have limited or no library facilities, indicating disparities in access to public reading and learning resources.
11.7.2Community Halls
Community halls are multi-functional public spaces used for hosting social, cultural, and civic events. In the Coimbatore LPA, these halls are instrumental in promoting community bonding and supporting activities such as public meetings, health camps, awareness programs, weddings, and other social gatherings. The Coimbatore Corporation area has all 225 community halls, with no data available for the other administrative divisions in the LPA.
Map 11.21: Existing Library Facilities in Coimbatore LPA
EXISTING LIBRARY FACILITIES IN COIMBATORE LPA
11.7.3Anganwadi Facilities
Anganwadi Centres function as focal points for early childhood care, nutrition, and maternal health services under the Integrated Child Development Services (ICDS) scheme. They provide preschool education, supplementary nutrition, immunization, health check-ups, and referral services to children under six years of age and pregnant or lactating mothers. Ensuring that Anganwadi Centres are adequately staffed, equipped, and integrated with healthcare facilities enhances their outreach and efficiency.
The Coimbatore LPA has a total of 996 Anganwadi centres as per TNGIS website. The Corporation leads with 524 centres, followed by town panchayats (146) and municipalities (64). Among rural blocks, Sulur Block has 56 centres, PN Palayam Block has 49, and Annur Block has 41. This wide distribution highlights a strong framework for child welfare services, although some blocks still reflect lower service density.
In the Coimbatore LPA, the planning of new Anganwadi centres should be aligned with demographic projections and child population clusters. Strengthening them is crucial for achieving long-term human development goals.
11.7.4Orphanages and Old Age Homes
Orphanages and old age homes serve as institutional care facilities for two vulnerable groups—children without parental care and the elderly population. These homes provide shelter, nutrition, medical care, counseling, and emotional support. In the Coimbatore LPA, spatial planning should consider allocation of land for such facilities within residential zones, especially where ageing population density or child welfare needs are high. The existing data is obtained from open data sources and may show differences.
Orphanages: The Coimbatore LPA has a total of 33 orphanages. The highest concentration is in Coimbatore (South) with 16 facilities, followed by Coimbatore (North) with 7, Perur has 3 orphanages, while Annur and Madukkarai have 3 and 2 respectively. Mettupalayam and Sulur each have 1 facility, whereas Kinathukadavu lacks any orphanages.
Old Age homes: There are 21 old age homes in the Coimbatore LPA. Perur has the highest number with 10 homes, followed by Coimbatore (South) with 5 and Coimbatore
Map 11.22: Existing Anganwadi Facilities in Coimbatore LPA
EXISTING ANGANWADI FACILITIES IN COIMBATORE LPA
(North) and Madukkarai with 4 and 2 respectively. Notably, Annur, Kinathukadavu, Mettupalayam, and Sulur do not have any old age homes.
11.7.5Postal and Banking Facilities
Postal and banking facilities are fundamental to the socio-economic framework of any urban area. In Coimbatore LPA, these services facilitate communication, financial inclusion, and access to government welfare schemes. In the Coimbatore LPA, planning should focus on expanding postal banking services, especially in underserved and newly urbanized areas. Integrating these services within mixed-use zones, transport hubs, and rural service centres enhances accessibility. Encouraging digital financial infrastructure, such as ATMs and mobile banking units, supports financial inclusion.
The Coimbatore LPA hosts 34 post offices. Coimbatore (South) has the largest number at 19, followed by Coimbatore (North) with 8, Perur with 5, and Madukkarai with 2. Annur, Kinathukadavu, Mettupalayam, and Sulur show limited or no presence of post offices. However, available data of Banks for the Coimbatore LPA is restricted to the Corporation limits, where 200 bank facilities are reported.
11.7.6Regulated Markets, Uzhavar Sandhai and Public Distribution System (PDS) Facilities
Regulated markets, Uzhavar Sandhais (farmers’ markets), and the Public Distribution System (PDS) are integral to ensuring food security and equitable market access in Coimbatore LPA. They form a critical link between producers and consumers.
Regulated markets provide farmers with a transparent pricing mechanism and prevent exploitation by middlemen. In the Coimbatore LPA, only 4 regulated markets are present—one each in Coimbatore (South), Mettupalayam, Perur, and Sulur. The absence of such facilities in the other taluks, especially Annur, Kinathukadavu, and Madukkarai, reflects a gap in structured agricultural market acces
Uzhavar Sandhais promote direct farmer-to-consumer sales, ensuring fair prices for both parties and the availability of fresh produce. Six such markets are
present across the Coimbatore LPA. Coimbatore (South) and Perur have 2 each, while Madukkarai and Sulur have 1 each. Other taluks, including Coimbatore (North), Annur, Kinathukadavu, and Mettupalayam, do not have any Uzhavar Sandhai,
PDS outlets ensure subsidized food grains and essential commodities reach economically weaker sections. There are 875 PDS shops in the Coimbatore LPA.
In the Coimbatore LPA, spatial planning must ensure that regulated markets and Uzhavar Sandhais are located near farming belts and accessible via major transport corridors. These facilities are vital for food security, farmer welfare, and urban affordability.
Map 11.23: Existing Anganwadi Facilities in Coimbatore LPA
EXISTING REGULATED MARKETS, UZHAVAR SANDHAI, PDS FACILITIES IN COIMBATORE LPA
11.7.7Burial Grounds
Burial grounds are vital for culturally appropriate and dignified interment. In Coimbatore LPA, their planned availability and distribution ensure accessibility and prevent overcrowding, with a focus on maintenance and land protection.
Table 11.37Area Requirement for Burial Ground in 2041 for Coimbatore LPA
SNo
Taluk
Existing Burial Ground Area in 2021
Burial Ground Total area demand by 2041 (1 unit per 5 Lakh Population threshold)
Additional Area to be proposed (Total area required -Existing area)
1
Annur
0.31 Sq.km
-
(Surplus)
2
Coimbatore (North)
0.23 Sq.km
0.16 Sq.km
(Surplus)
3
Coimbatore (South)
0.36 Sq.km
0.12 Sq.km
(Surplus)
4
Kinathukadavu
0.02 Sq.km
-
(Surplus)
5
Madukkarai
0.21 Sq.km
0.08 Sq.km
(Surplus)
6
Mettupalayam
0.03 Sq.km
-
(Surplus)
7
Perur
0.10 Sq.km
0.04 Sq.km
(Surplus)
8
Sulur
0.44 Sq.km
0.04 Sq.km
(Surplus)
Total
1.71 Sq.km
0.44 Sq.km
(Surplus)
The above table presents an assessment of existing and projected burial ground requirements across 8 taluks within the Coimbatore LPA. The evaluation is based on a threshold of 1 unit per 5 lakh population, as per URDPFI guidelines, with 4 hectares per unit.
All taluks have been identified as having a surplus in burial ground provision based on the projected demand. It is therefore considered that the existing burial grounds in the taluks can adequately serve the needs of the planning period by 2041.
11.7.8Crematoriums
Crematoriums in Coimbatore LPA include traditional and modern eco-friendly facilities. Emphasis is on electric and gas-based systems to reduce pollution. Strategic
Map 11.24: Existing Crematorium Facilities
EXISTING CREMATORIUM FACILITIES
placement ensures accessibility and avoids overcrowding. Upgrading existing crematoriums with emission control aligns with sustainable urban goals and supports respectful disposal of the deceased.
There are thirteen crematoriums located within the Coimbatore Corporation limits, along with one crematorium each in the Karumathampatti and Karamadai Municipalities. As per the URDPFI Guidelines, it is recommended that at least one crematorium be provided for large cities.
11.7.9 Projections and Gap Analysis for Other Amenities
Table 11.38Taluk wise Gap Analysis and Area Requirement for Other Amenities as per URDPFI
Location
Orphanages
Old Age Homes
Regulated Markets
Uzhavar Sandhai
Post Offices
Total Area required for the Deficits
Population Threshold
5 Lakh
5 Lakh
10 Lakh
10 Lakh
5 Lakh
Annur
3 (Surplus)
(Sur0plus)
0 (Surplus)
0 (Surplus)
(Sur0plus)
(Surplus)
Coimbatore (North)
3 (Surplus)
(Sur2plus)
-2 (0.20sq.km)
-2 (0.20sq.km)
(Sur4plus)
0.74sq.km
Coimbatore (South)
13 (Surplus)
(Sur3plus)
-1 (0.10sq.km)
0 (Surplus)
16(Surplus)
0.10sq.km
11.9.1Proposal (Govt.) of Relocation of Coimbatore Jail
The Coimbatore Central Prison, currently situated in the dense urban core of Gandhipuram, is proposed by the Government, to be relocated to a new site in Bilichi Village, within Coimbatore North Taluk. The identified land spans S.F. Nos. 1134/1, 2, 3; 1154/1B, 2B; 1161/3C; and 1135/1.
This relocation aims to decongest the central area, repurpose prime urban land for future civic or public uses, and develop a modern correctional facility in a more appropriate peripheral location. The Bilichi site offers suitable spatial conditions for security, accessibility, and facility expansion.
The move aligns with urban planning principles of land use optimisation and infrastructure decentralisation, while also creating potential for urban renewal in the heart of Coimbatore.
Map 11.25: Proposal of Social Infrastructure Facilities
PROPOSED SOCIAL INFRASTRUCTURE FACILITIES IN COIMBATORE LPA
11.8.1Strengths
Coimbatore LPA demonstrates robust human development outcomes, underscored by a high Human Development Index (HDI) and a declining Multidimensional Poverty Index (MPI).
A well-distributed school network spans the LPA, ensuring broad access to primary and secondary education.
The area benefits from a dense concentration of higher education institutions, reinforcing its position as a regional academic hub.
Healthcare infrastructure is notably advanced, with urban areas achieving near-complete coverage under the Golden Hour accessibility, while only 60% of rural areas fall within this critical healthcare window.
Urban centers further excel in tertiary and specialized healthcare services.
11.8.2 Weaknesses
Approximately 40 percent of Revenue Villages remain outside the Golden Hour healthcare coverage, highlighting gaps in rural and peri-urban medical access.
• Fire service infrastructure remains inadequate, particularly in rural and peri-urban locations, posing risks in emergency situations.
11.8.3Opportunities
There is considerable potential to establish Institutes of National importance and strengthen the region’s skill development infrastructure.
11.9 Proposals and Policy Recommendations
Public educational institutions can be upgraded to improve quality and enhance their competitiveness with private institutions.
Additional medical college can be established in a suitable area, to support equitable access and promote diversification in higher education.
Health Hubs can be developed in peri-urban and underserved rural areas to expand the reach of healthcare services.
Fire stations and emergency response infrastructure can be decentralized and expanded to improve resilience and responsiveness.
11.8.4 Threats
Ensuring that infrastructure development keeps pace with population growth presents an ongoing challenge to maintaining equitable access and high-quality service delivery.
Rising population pressure on existing facilities may result in overcrowding and a decline in service quality.
Constraints related to land availability, particularly in densely urbanized areas, may limit the future expansion of social infrastructure.
11.9.2Proposal (Govt.) of Semmozhi Poonga
The Semmozhi Poonga, currently being developed at the ground of the Central Prison in Coimbatore, represents a transformative public initiative aimed at enhancing the city’s open space. This initiative, aims to repurpose the high-value urban land into a vibrant public green space, contributing to the enhancement of environmental quality and community well-being in the city.
The project is envisioned as a cultural and ecological landmark that promotes inclusive access to open spaces for recreation, learning, and cultural interaction.
Strategically located in Ward 80 of the Central Zone, the proposed park spans an area of approximately 45 acres. The site benefits from its proximity to key city nodes and transport infrastructure, increasing its accessibility to a broad section of residents. Also, the development of Semmozhi Poonga will enhance the per capita open space index for the Coimbatore LPA.
With the Semmozhi Poongha proposal, the per capita open space is expected to increase by 0.014 sq.m per person, resulting in a total of 1.812 sq.m per person when combined with the existing infrastructures.
11.9.3Proposal (Govt.) of International Cricket Stadium
Tamil Nadu has consistently demonstrated excellence in the field of cricket, with notable achievements at the domestic, franchise, and international levels. While Chennai has historically been the primary hub for cricket in the state, Coimbatore is emerging as a key secondary centre, owing to its growing cricket culture and ongoing investments in sports infrastructure. A proposal has been initiated for the development of an International Cricket Stadium in Coimbatore District. The objective is to establish a worldclass sporting facility that will serve as a premier destination for cricket and other sports activities, thereby enhancing the city’s profile as a regional sports hub.
Table 11.40Location Details of the Proposed Cricket Stadium
Village Name
Survey Field No.
Ward
Block
Town Survey No.
Taluk
Area (acres)
Corporation village -Singanallur
777, 778
AJ (36)
26
1, 2
Coimbatore South
20.18
Irugur
379/2
-
-
-
Sulur
10.18
Total Area
-
-
-
-
-
30.36
The stadium is proposed to include the following core facilities:
An international-standard main cricket stadium
• Practice pitches and high-performance training grounds
Gymnasiums, sports academies, and support facilities for athletes
Spectator galleries and associated amenities
In addition to sports infrastructure, the facility will also incorporate allied features to enhance visitor experience and utility:
Retail outlets, food courts, and club areas
Banquet halls, swimming pools, and jogging tracks.
• Comprehensive parking and public access facilities.
The proposed stadium is envisioned to host a range of events—from grassroots-level competitions to international tournaments—serving both professional athletes and the general public.
11.9.4Proposal (Govt.) of Hockey Stadium
To augment sports infrastructure and encourage the growth of athletics at both local and regional levels, a Hockey Stadium is proposed to be developed by the Coimbatore City Municipal Corporation. The project is planned at R.S. Puram, located in Ward H, Block 18, encompassing Town Survey Numbers 645, 646, 647, 648, 649, 650, 651, and 652. The total site area measures approximately 7 acres.
The stadium is designed to meet premier standards and will include a range of modern facilities. It will feature an ASTRO turf spread over 6,500 square metres, a dressing room covering 147 square metres, and six high-mast stadium lights. The facility will also comprise a 1,700-seater spectator gallery, a conference hall, a dining hall for players, a gymnasium, restrooms, office rooms, and dedicated parking facilities for 114 cars and 208 two-wheelers. The proposed stadium is anticipated to serve as a premier venue for hosting professional hockey tournaments and training programmes, while also supporting youth engagement in sports.
With the Hockey Stadium proposal, the per capita open space is expected to increase by 0.034 sq.m per person, resulting in a total of 1.832 sq.m per person when combined with the existing infrastructures.
11.9.5Proposals from Tamil Nadu Budget 2025
To strengthen the socially inclusive development and improve access to essential services, a number of social infrastructure initiatives have been proposed, as outlined in the Tamil Nadu Budget 2025. These initiatives aim to enhance educational and research facilities, improve student accommodation, and expand rehabilitation services. Collectively, these proposals are expected to play a significant role in advancing human development outcomes and strengthening the overall social infrastructure landscape in the region. The proposals from Tamil Nadu Budget 2025 are as detailed below:
11.9.5.1 Basic Sciences and Mathematics Research Centre
A Basic Sciences and Mathematics Research Centre is proposed to be developed in collaboration with the Indian Institute of Science (IISc) and the Tata Institute of Fundamental Research (TIFR). This centre will focus on promoting high-quality research in fundamental sciences.
11.9.5.2 Industrial Training Institute at Perur:
An Industrial Training Institute (ITI) is proposed to be established at Perur, with an annual intake capacity of approximately 1,370 students. The institute will provide technical education to equip students with industry-relevant skills and improve their employability.
11.9.5.3 Centres of Excellence in Manufacturing and Foundry Technology
Two Centres of Excellence are proposed in Coimbatore—one dedicated to advanced pump motor manufacturing and the other to foundry technology. These centres will serve as innovation hubs for industry-oriented research, skill development, and knowledge exchange in key manufacturing sectors.
11.9.5.4 Modern Hostel for Girl Students
The construction of a modern hostel facility with the capacity to accommodate 1,000 girl students is proposed to support female education and provide a safe and inclusive residential environment. The facility will be equipped with modern amenities to ensure the well-being and academic focus of its residents.
11.9.5.5 Integrated Rehabilitation Centre for Persons with Disabilities
An Integrated Rehabilitation Centre for persons with disabilities is proposed to provide comprehensive support services including medical care, social rehabilitation etc. The centre is envisioned to promote inclusion and improved quality of life for differently-abled individuals.
11.9.7Proposal of Fire Stations
Two additional fire stations are proposed to strengthen the emergency response network and to ensure compliance with the response time thresholds recommended by the URDPFI and National Disaster Management Authority
(NDMA) guidelines, which mandate a response time of 5 to 7 minutes. The following proposed stations are strategically located to cover critical network gaps in fire and emergency services as identified in the Fire service coverage area analysis:
Table 11.41Location details of Proposed Fire Stations
Proposed Fire Station (2 numbers) To meet the demand Service Gap
S No
Taluk
Proposed Village
Survey number
Area required
1
Sulur
Idayarpalayam
199(pt)
1 Hectare
2
Annur
Sarkarsamakulam
74(pt)
1 Hectare
Total
2 Hectares
Though the analysis based on population norms, as per the URDPFI Guidelines, identified numerous gaps in the provision of fire stations across the Local Planning Area (LPA), a more location-specific assessment using the 5 to 7 minutes response time coverage criteria (as seen in the Map 11.19) revealed comparatively fewer service gaps. Accordingly, two additional fire stations are proposed to effectively bridge these critical gaps. The proposed locations are Idayarpalayam Village in Sulur Taluk and Sarkarsamakulam Village in Annur Taluk, each allocated 1 hectare as per URDPFI norms. These fire stations are strategically positioned to strengthen the emergency response network, improve operational efficiency, ensure rapid response during emergencies, and mitigate risks in high-density residential, commercial, and industrial zones.
11.9.6Proposal for Establishing a Comprehensive Mental Healthcare Institution in Coimbatore LPA
In alignment with the Tamil Nadu Government’s vision of achieving a $1 Trillion economy, which outlines the establishment of three new mental health institutions outside Chennai, it is proposed to develop a state-of-the-art mental healthcare institution within the Coimbatore LPA. While Coimbatore currently hosts several mental health care centers, the majority are privately run and operate as clinics or wellness facilities rather than full-fledged institutions. There exists a critical gap in accessible, affordable, and integrated mental health services, particularly for vulnerable and underserved populations across the region.
The proposed institution shall function as a holistic centre of excellence, integrating mental health research, clinical services, and rehabilitation. It will cater not only to Coimbatore district but also serve as a regional hub for adjacent districts in western Tamil Nadu and the Kongu belt. The institution will focus on both preventive and curative aspects of mental health through multidisciplinary care. This initiative aligns with state’s broader goals of social wellbeing and inclusive development.
11.9.8Proposal of Taluk Hospital
Two additional taluk-level hospitals are proposed within the Coimbatore Local Planning Area (LPA), one each for Coimbatore North Taluk and Coimbatore South Taluk. At present, both taluks are served by non-taluk hospitals and other tertiary hospitals, and there exists a clear requirement for dedicated taluk-level healthcare facilities to meet the demand by 2041. These proposals stem from service gap evaluations as per URDPFI norms, which underscore the need for improved tertiary-level health care accessibility at the sub-district level. The following locations are selected for the proposed Taluk Hospitals:
Table 11.42Location details of Proposed Taluk Hospital
Proposed Taluk Hospital - To meet the demand by 2041
S No
Taluk
Proposed Village /TP
Survey number
(Minimum 1 Hectare is required for a Taluk Hospital)
1
Coimbatore North Taluk
Veerapandi TP
526
2
Coimbatore South Taluk
Corporation (Sundakamuthur Village)
181
To bridge the healthcare infrastructure gap at the taluk level, an additional Taluk Hospital is proposed in both Coimbatore North and Coimbatore South Taluks by 2041. Both selected sites are government owned. These hospitals will serve as crucial health nodes, reducing the patient load on higher-order facilities and providing timely medical services to a broader population base, particularly in semi-urban and peripheral areas of the LPA.
11.9.9Proposal of Veterinary Hospital
In response to the service deficiencies identified in the veterinary health sector as per URDPFI norms to meet the demand by 2041, five additional veterinary hospitals are proposed across the Coimbatore LPA—distributed strategically to cater to underserved taluks as follows:
Table 11.43Location details of Proposed Veterinary Hospital
Proposed Veterinary Hospitals - To meet the demand by 2041
S No
Taluk
Proposed Village /TP/Municipality
Survey number
(Minimum 2000 sq.m is required for a Veterinary Hospital)
1
Coimbatore North Taluk
Veerapandi TP
532(pt)
2
Madukkarai Taluk
Madukkarai Municipality
60
3
Coimbatore South Taluk
Corporation (Sundakamuthur Village)
181
By the year 2041, as per norms and gap analysis, an estimated five additional veterinary hospitals will be required within the Coimbatore LPA to adequately meet growing demand—one each in Coimbatore North and Madukkarai Taluks, and three in Coimbatore South Taluk.
However, considering spatially, only three new veterinary hospitals are proposed. One is planned in Coimbatore North Taluk at Veerapandi Town Panchayat, and
another in Madukkarai Taluk, within Madukkarai Municipality. A third facility is recommended as a high capacity veterinary hospital to be developed in Coimbatore South Taluk, within the Corporation limits at Sundakaputhur Village
These facilities will address the region’s demand for animal healthcare and welfare services, especially in areas where livestock rearing and dairy farming form an integral part of the local economy. The expansion of veterinary infrastructure will support the livelihood of rural and periurban communities, promote animal health, and contribute to sustainable agri-based development.
11.9.10Proposal of Mini Libraries at Railway Junction and Community Parks in Coimbatore
The Coimbatore Local Planning Area (LPA) is projected to have a requirement of 247 public libraries by the year 2041 to cater to the growing need for accessible educational and reading facilities, with the Corporation libraries requirement accounting for 186. To meet the rquriemnets and address this requirement as well as to ensure equitable access to knowledge resources, it is proposed to establish Mini Libraries at strategic, high-footfall public locations such as railway station, and community parks. This initiative aims to cultivate a reading culture and support inclusive learning opportunities across the city.
Mini Libraries at Railway junction: Integrating mini libraries at these locations offers a practical and cost-effective means to promote reading and educational engagement. The following places as listed in the table below, are identified for the proposed initiative for the integration of mini-library. These terminals offer strategic locations for mini libraries due to their accessibility, high daily user volume, and potential for community outreach.
Mini Libraries at Community Parks: In addition to transit hubs, it is proposed to establish mini libraries within community parks across the city. Coimbatore Corporation currently has approximately 190 community parks serving as important recreational and social spaces. The presence of mini libraries in these parks will foster reading as a leisure activity and benefit a wide demographic, including children, senior citizens, and local residents.
To ensure effective upkeep and responsible usage, these libraries shall be maintained by the respective neighborhood associations or resident welfare societies. This community-led approach will encourage local ownership and promote sustainable operations.
Table 11.44Proposed locations for Mini Libraries
Railway Junction (1)
Community parks
Coimbatore Railway Junction
There are 190 community parks in the corporation. These can be utilised for integration of Mini-Libraries
Access and Operational Recommendations:
11.9.11Recommendations for Institute of National Importance
Coimbatore boasts a robust presence of engineering, medical, arts, science, and management institutions that significantly contribute to the region’s educational landscape. However, the city presently lacks institutions of national importance—Category A institutions established through Acts of Parliament and recognized for their academic excellence, research output, and national-level capacity building.
Given Coimbatore’s strong industrial base, academic ecosystem, and strategic geographic location, it is wellpositioned to host institutions of national importance. The following are recommended:
As a well-established textile and manufacturing hub, Coimbatore presents a compelling case for the establishment of national-level institutions focused on textiles, fashion, and design. Institutions such as the National Institute of Design (NID) and the National Institute of Fashion Technology (NIFT), if located in Coimbatore, would create strong synergy with the city’s existing textile industries, supporting future skill development, advanced research, and innovation in textile technology and design.
In addition, an Indian Institute of Science Education and Research (IISER) could also be established in Coimbatore. IISERs, with their focus on high-quality research and science education, would align well with the city’s growing industrial sectors such as manufacturing, engineering, and emerging technologies. The presence of an IISER would further strengthen and encourage industry-academia collaboration, and contribute to the development of a knowledge-based economy in the region.
It is also noted that premier institutions like NID and IISER currently do not have a presence in Tamil Nadu. Establishing such institutions in Coimbatore would bridge this gap while reinforcing Tamil Nadu’s position in education, research, and industrial innovation.
11.9.12Recommendations for Skill Development in alignment with Sunrise Sectors
To align with Coimbatore’s evolving economic base, the economic sector details the identified sunrise sectors that are expected to drive future growth—namely: Electric Vehicles (EV) and Renewable Energy, Aerospace and Defence Applications, Electronic System Design and Manufacturing, Medical Electronic Devices and Equipment, and Agro and Food Processing.
It is recommended that existing colleges and universities in Coimbatore introduce or expand targeted skill development programs and academic courses that are aligned with these sectors. These programs can be introduced or strengthened in collaboration with industry stakeholders to ensure relevance to market needs.
In the long term, the proposed national-level institution, if established, can also be designed to complement and further elevate these sectoral training domains by acting as a hub for advanced research, innovation, and professional education.
Table 11.45Recommended courses for Sunrise Sectors Skill Development
Sunrise Sector
Level
Recommended Courses
1. Electric Vehicles (EV) & Renewable Energy
Bachelor's Level
- B.Tech in Sustainable Energy Engineering
- B.Sc in Renewable Energy Policy & Management
Master's Level
- M.Tech in Advanced Battery Technologies & Energy Storage
- M.Sc in Smart Grid & Microgrid Systems
- MBA in Renewable Energy Business
2. Aerospace & Defence Applications
Bachelor's Level
- B.E in Aerospace Materials & Composites
- B.Tech in Drone & UAV Technology
Master's Level
- M.Tech in Hypersonic Systems & Spacecraft Engineering
- M.Sc in Defence Cybersecurity & AI
- MBA in Aerospace Supply Chain Management
3. Electronic System Design & Manufacturing (ESDM)
Bachelor's Level
11.10.1Phasing of Social Infrastructure Proposals for Coimbatore LPA
The social infrastructure proposals under the Coimbatore Local Planning Area (LPA) Master Plan have been strategically phased into short-term (immediate), medium-term (2031), and long-term (2041) actions to ensure systematic, equitable, and sustainable service delivery. These proposals encompass a mix of new developments and
upgradation of existing facilities across education, health, safety, recreation, and socio-cultural sectors. The phasing aligns with the gaps identified and the analysis conducted for projected population demand in the respective timeframes.
In the education sector:
The short-term plan focuses on the upgradation of 24 primary schools in the Corporation area, 5 in Town Panchayats, and 1 rural primary school to the secondary level.
The key short-term education sector proposals from Tamil nadu Budget 2025 -include the establishment of an Industrial Training Institute (ITI) at Perur, a Basic Sciences and Mathematics Research Centre in collaboration with the Indian Institute of Science (IISc) and Tata Institute of Fundamental Research (TIFR), and two Centres of Excellence—one for advanced pump motor manufacturing and another for foundry technologies. In addition, a modern hostel facility for girl students has also been proposed.
The medium and long-term vision includes the proposal of new establishment of 122 and 206 secondary schools, and 78 and 238 primary schools respectively across LPA.
Additionally, the long-term vision includes new proposals for a Institutes of National Importance to cater to higher education and specialized academic needs.
In the health sector:
The short-term proposals include the upgradation of 7 Urban Primary Health Centres (UPHC) within the Corporation limits, and proposals for 24 new UPHCs/ Primary Health Centres (PHCs) in town panchayats and rural areas, along with 2 new CHCs/UGPHCs in LPA.
The key short-term health sector proposals from Tamil nadu Budget 2025 -include Integrated Rehabilitation Centre for Persons with Disabilities and a Medical Devices Testing Laboratory.
• The medium- and long-term plans include progressive expansion to an additional 21 and 39 UPHCs/ PHCs respectively, with proposals for 5 and 7 new CHCs/UGPHCs.
A new comprehensive Mental Health Care Institution is proposed in the medium term, while new taluk hospitals and veterinary hospitals are planned for the long term to meet increasing health care needs.
12.2.1Distribution and Density of Households
12.2.1.1 Distribution and Density of Households 2011
Coimbatore has a densely populated core, with the hitherto sparsely populated radial corridors increasingly gaining population concentration. With the expansion of the boundary of the Municipal Corporation, the number of households increased from 4,26,482 to 6,75,835, as mentioned in the Table 12.3 registering an increase of 58.5% in the number of households.
Table 12.3Density of Households 2011
Coimbatore LPA
Population 2011
Households 2011
Household Density 2011
Corporation
15,84,719
4,26,482
1,654
Municipality
1,39,444
38,913
399
Town panchayat
3,03,834
85,686
272
Revenue village
4,29,455
1,21,952
142
Total
24,57,452
6,73,033
439
Sources: Census of India, 2011
As of 2011, the overall household density in the CCMC area has been 1654 per sq.km, while in the older areas of CCMC, it has been 2678 per sq.km. Within the Municipal Corporation, areas such as Goundanpalayam (TP), Kuniamuthur, and Kurichi had higher densities of 2591, 2154 and 1616 persons/sq.km. resulting due to location of employment avenues and educational institutions. Location of SIDCO industrial estate in Kurichi, and numerous MSMEs in Goundampalayam and Kuniyamuthur as well as the educational institutions in Thudiyalur have led to a higher level of residential growth is presented in the Map 12.1. It is also evident that density along the major transit corridors is relatively higher than in other areas as mentioned in the Map 12.2.
Map 12.1: Distribution of Households 2011
DISTRIBUTION OF HOUSEHOLDS 2011
12.2.2Housing Conditions
The condition of census houses (as of 2011) across the LPA, in terms of being in good, liveable and dilapidated condition is presented in the figure 12.1.
Sources: Census of India, 2011
Figure 12.1: Percentage share of Housing condition in Census Houses
Of the total households in the corporation area (4,26,482 units), 80.5% (3,42,892), 19% (81,031), and 0.60% (2559) are categorised as being good, liveable, and in dilapidated conditions, respectively. The total household in municipalities is 38,913, out of which 75.90% (29,534), 23.30% (9,066), and 0.75% (292) are in good, liveable, and dilapidated condition respectively. In the Town Panchayats, of the 85,686 houses, 71.5% (61,265), 27.70% (23,735), and 0.80% (685) are in good, liveable, and dilapidated condition, respectively. The total households in all the Revenue villages together is 1,21,959, out of which 71.5% (87,201), 27.40% (33,416), and 1.10% (1,341) are in good, liveable, and dilapidated condition respectively as presented in Map 12.7.
Overall, the LPA boasts of 74.8% (5,03,428 houses) being of ‘good’ condition, ‘liveable’ houses being 24.4% (1,64,220 units), and ‘dilapidated’ houses forming a marginal 0.8% (5,384 housing units). While the Corporation area shows a higher proportion of ‘good’ condition houses (80.45%), the lowest percentage (71.5%) is found in Revenue villages. Similarly, Revenue villages exhibit a relatively higher share of ‘dilapidated’ housing units compared to other areas.
Map 12.7: Distribution of Condition of Census Houses
12.2.4Status of Rooms in Residential Properties
The status of availability of number of rooms in the residential houses in various constituent areas across LPA has been presented in Table 12.5, in terms of dwelling units ‘with-out exclusive room’ and those houses with one to six and above number of rooms. The corporation area has a higher percentage of multi-room dwellings, while Revenue villages have more single-room and non-exclusive room units.
Table 12.5Dwelling Units Details in the LPA (2011)
Size of Dwelling Units
District(%)
Overall LPA
Corporation(%)
Municipality(%)
Town Panchayat(%)
Revenue Villages (%)
No exclusive rooms
1.9
1.45
1.8
2.11
2.17
One
34.3
25.4
31.1
35.25
40.56
Two
31.5
30
32
32.5
33.6
Three
18.2
22.3
20.1
18.13
15.0
Four
8.5
12.8
9
7.69
5.87
Five
3.3
5.45
3.72
2.685
1.689
Six & above
2.2
3.6
2.2
1.55
1.07
Sources: Census of India, 2011
The analysis indicates that one-room units are the most common in Revenue villages (40.56%), while six and six and above catagory of room units have the lowest share in Revenue villages (1.07%). Similarly, three-room units are most prevalent in Corporation (22.3%), whereas five-room units have the least share in Revenue villages (1.689%).
From this, it can be considered that areas with a higher percentage of one-room and no-exclusive-room units may require support. The lower share of larger dwellings in certain areas also suggest issues of affordability, infrastructure availability, and household size demands.
12.2.3Tenurial Status
As per the Census definition, a household is living in an ‘owned’ house if they self-occupy the house they own and do not pay rent to anyone. If a household pays rent in cash or kind for the accommodation they occupy, including cases where the employer provides the accommodation (e.g., government quarters), they are classified as living in a ‘rented’ house. The ‘others’ category encompasses households that reside in encroachments or unauthorized structures.
The tenurial status of houses (as of 2011) across the LPA is demonstrated in terms of ‘owned’, ‘rented’ and ‘others’ categories. About 59.4% of the dwelling units in the LPA are ‘owned’, while 36.6% is rented and about 4% form the ‘others’ category.
Sources: Census of India, 2011
Figure 12.2: Percentage share of Tenure Status in Census Houses
The total number of households in the corporation is 4,26,482, of which 54.7%, 43.6%, and 1.7% constitute owned, rental and other categories respectively. The municipalities with a total of 38,913 households have 59.15%, 39% and 2.30% living in owned, rental and other categories respectively. The Town Panchayats have a total of 85,686 households, of which 68.60%, 28.8%, 2.5% are of owned, rental and other categories, respectively. The total households in Revenue villages is 1,21,959, of which 77.8%, 19.50%, and 2.7% are categorised to be living in ‘owned’, ‘rental’ and ‘other’ categories, respectively as preseted in Map 12.8.
Overall, the tenurial status of ‘owned houses’ in the LPA is higher in the constituting Revenue villages (77.8%) and town panchayats (69.3%) as compared to the core urban areas presented in the Figure 12.2. The rental houses
Map 12.8: Distribution of Tenure in Census Houses
OWNERSHIP STATUS OF CENSUS HOUSE 2011
are largely present in the core areas which can be related to the employment opportunities and higher cost of properties. The proportion of rental houses is comparatively higher along the major transit corridors as well, as households opt for rental accommodation in view of the ease of mobility and accessibility.
12.2.5Student Communities
Coimbatore district is a major education hub and is dotted with the number of engineering, medical science and arts colleges as well as polytechnic colleges. The assessment indicates the total number of students is 1,16,761 in that boys are 63,806 and girls are 52,951. The major education facilities, colleges. The assessment in Coimbatore LPA highlights the areas that would be provided with hostel for student communities. The education facilities are largely located at Somayampalayam, Ettimadai, Madukkarai and Pichanur. Surrounding these areas, the residential landuse has been identified for the provision of housing to support the student communities.
Map 12.9: Location of Women’s Hostel
12.2.6 Women’s Hostel
In the context of migrants forming a major part of the district’s population, and also in view of the employment opportunities available in the city, the availability of women’s hostels is a prerequisite to address the accommodation requirement for the working as well as student community. The location of women’s hostels has been mapped across the LPA (Map 12.9), and it is noted that most Women’s Hostels are located within the Corporation boundary, more particularly inside the old corporation boundary area.
12.2.7Night Shelters in Municipal Corporation
In an effort to provide secure accommodation for the urban homeless, the Coimbatore city municipal corporation has set up five shelters in different zones of the corporation. The five existing shelters are located at Poosaripalayam, R.S. Puram (two shelters), K.N.G Pudur, and Kempatty Colony. As of now, these shelters together have a combined capacity of 276 beds, which is already proposed to be increased to 300.
As part of the National Urban Livelihood Scheme, four urban homeless shelters (UHS) are under construction at Kadalakkara Lane (Central Zone) near the district collectorate, Mullai Nagar (North Zone), NTP Nagar (South Zone), and Nesavalar Colony (East Zone). This will bring the total number of shelters for urban homeless to nine. As per norms of the Scheme of Shelter for Urban Homeless (SUH) under the National Urban Livelihoods Mission (NULM), these shelters should be permanent all-weather shelters for the urban homeless, and for every one lakh urban population, provisions should be made for permanent community shelters for a minimum of one hundred persons, and depending upon local conditions each shelter could cater to 50 or 100 persons.
As per the assessment by the local bodies in the LPA, the population of Coimbatore LPA in 2024 is 37,15,957 and considering the above guideline, Coimbatore LPA currently requires an additional 28 shelters comprising 100 beds each. Based on the projected population for LPA in 2031 and 2041, assuming 100 beds in a shelter, a total of 42 shelters and 58 shelters respectively would be the requirement in these years.
12.2.8Scenario of Informal Settlements
Towards promotion of slum free cities, the Rajiv Awas Yojna (RAY) had advocated a twofold strategy - (i) Curative Strategy, a plan to bring about the improvement of the existing slums through the participation of the existing slum dwellers and (ii) Preventive Strategy to prevent the formation of future slum. As part of this effort, a Slum Free City Plan of Action (SFCPoA 2013-2022) enlisted the role of various institutions, of which a primary role is attributed to the Tamil Nadu Urban Habitat Development Board (TNUHDB).
Based on a comprehensive exercise, the Coimbatore corporation has been divided into five zones with 20 wards in each zone. Based on the morphological pattern of slums in the corporation area, the slums have been identified under five categories, (i) slums near residential areas, (ii) in the vicinity of industries, (iii) along kulams (large water tanks), (iv) linear slums along roads, railway tracks, and nullahs (drains), (v) slums in agricultural areas.
A total of 214 pockets of slums have been identified in the corporation under the RAY scheme. All the identified existing slum settlements were categorised as tenable and non-tenable with verifiable parameters such as land ownership, land use, spatial location, health risk, etc. Informal settlements suitable for human habitation, which were not located in/along a hazardous zone and where the land was not earmarked for major public facilities were categorised as tenable slums. Prioritisation of untenable slums was based on parameters that included environmental risk, proportion of female population, Scheduled Caste/Scheduled Tribe (SC/ST) population, minority population, and Below the Poverty Line (BPL) families. Accordingly, 115 tenable slums pockets and 99 non-tenable slums pockets accounting for 19,266 households and 10,616 households, respectively have been identified. Spatially, the southern parts, which exhibit more employment and institutional base, have been mapped to have more slum areas, as compared to the northern part of corporation is presented the Map 12.10.
Table 12.6Context of Slums and Measures Taken Since 2016
Coimbatore City Municipal Corporation
Total number of slums identified in RAY scheme
214
Total number of HHs in identified slums
12.2.9Public Housing
Public housing projects that prioritize provision of safe and affordable housing for all residents are being formulated and implemented primarily through Tamil Nadu Housing and Urban Development Board (TNUHDB) and Tamil Nadu Housing Board (TNHB).
12.2.9.1 Tamil Nadu Urban Habitat Development Board (TNUHDB)
The Tamil Nadu Urban Habitat Development Board (TNUHDB), with its focus on housing for the weaker sections, has constructed over 4.40 lakhs tenements/houses, providing grants to urban poor families for housing. TNUHDB’s efforts contribute to achieving Sustainable Development Goal-11 of ensuring access to safe and affordable housing and upgrading urban poor habitations. The TNUHDB addresses the housing needs of EWS and LIG income categories. Over a period of 10 to 20 years, through various schemes under 11th finance commission, 12th finance commission, 13th finance commission, hire purchase, JNNURM and PMAY (AHP-HFA), TNUHDB has implemented 44 schemes providing a total of 18,647 tenements in Coimbatore LPA. Additionally, 7 schemes providing 1665 tenements are in progress under the PMAY-HFA. The details of the activities by TNUHDB in Coimbatore is provided below:
Table 12.7Tenements provided by TNUHDB
Schemes
Tenements
Implemented
18,647
Ongoing
1665
Proposed
2162
Sources: TNUHBD
In addition to the schemes that are on-going for providing new units, certain existing schemes have been assessed for reconstruction, having a total of 1892 tenements as provided in Table 12.8. These have been identified based on an assessment of their condition linked to the age and physical status / condition of the tenements.
Table 12.8Proposed Tenements by TNUHDB
Name of the Scheme
Type of Construction
No of Units
Periyar Nagar (SOP Ph- III)
Reconstruction
400
12.3.1Houseless Households
Households that do not live in buildings or census houses but live in the open or roadside, pavements, under flyovers and staircases, or in the open in places of worship, mandaps, railway platforms, etc., are treated as Houseless Households. According to 2011 census, there were 442 houseless households in the Coimbatore district. Considering 70% of the district households are in LPA, a total of 310 houseless households are estimated in LPA.
Table 12.10Houseless Households in Coimbatore District 2011
Coimbatore District
Houseless Households
Rural
70
Urban
372
Total District
442
Sources: Census 2011
12.3.2Temporary (Kutcha) Houses
The housing typologies are classified as permanent/ pucca, semi-permanent/ semi-pucca and temporary/ kutcha based on the residential structures (the percentage of housing typologies as in table 2.11).
Table 12.11Housing Typology
Housing Typology
District(%)
Overall LPA
Corporation
Municipality
Town Panchayat
Revenue Villages
Pucca / permanent
81.8%
88.9%
78.52%
73.79%
74.86%
Semi Pucca / Permanent
15%
9%
16.92%
22.31%
20.82%
Kutcha / Temporary
2.1%
0.5%
0.97%
2.23%
2.47%
HHS Sensus 2011
6,73,033
4,26,482
38,913
85,686
1,21,952
Kutcha / Temporary Households in LPA
2,132
377
1,910
3,012
Sources: Census of India, 2011
The Town Panchayats and Revenue villages have a relatively lower proportion of their houses under Pucca category (73.79% and 74.86% respectively). For the estimation of housing shortage, the temporary houses in which both walls and roof are made of materials, which have to be replaced frequently are considered. According to census 2011, there are a total of 7,431 temporary houses estimated in the LPA.
12.3.3 Shortage Due to Congestion
As per 2011 census, 6.5 percent of households did not have a separate room. Accordingly, the shortage due to congestion in LPA is estimated to be 43,747 units.
12.3.4 Shortage Due to Obsolescence
According to the 58th Round of NSSO, 4.3 percent of households lived in obsolete houses. Accordingly, the shortage due to obsolescence in LPA is estimated to be 28,940 houses.
12.3.5 Houses in Dilapidated Condition
As per 2011 census, 0.5%, 1%, 0.8%, and 1% houses are in dilapidated condition in corporation, municipalities, town panchayats and Revenue villages respectively as mentioned in the Table 12.12, adding up to 4,425 households being in dilapidated housing in the LPA.
12.3.6Households in Slums
According to the RAY scheme, 214 slums consisting of 29,882 households were identified. Accounting for the households allotted with alternate accommodation since 2015 (9,762 units) through schemes like JNNURM and AHP, a total of 20,120 households are assessed to be in slums requiring better housing and infrastructure conditions and percentage of shortages mentioned in the Figure 12.3.
Figure 12.3: Percentage of Housing Shortage in LPA
Table 12.13Housing Shortages in LPA for 2024
Housing shortage
Number of House-holds
Percentage of shortage
Houseless Households
310
0.3%
Temporary houses
7,431
6.8%
Shortage due to congestion
43,747
43.8%
Shortage due to obsolescence
28,940
26.6%
Dilapidated houses
4,425
4.1%
Slum houses
20,120
18.5%
Total
1,04,973
100%
Sources: Census of India, 2011, TG12 report, Urban Local Bodies
12.4 Residential Demand and Supply Market
Overall, the housing shortage for LPA is estimated to be of the order of 1,04,973 units in the LPA as per the census 2011 datum as mentioned in the Table 12.13.
Independent dwellings and modest apartment complexes are increasingly giving way to a more diverse typology of housing in Coimbatore, including apartments, villas, and luxury homes, to some extent contributed by NRI investment in the city’s real estate. Coimbatore residential property prices have increased 5-10% annually, mostly in Saravanampatti, Peelamedu, and RS Puram areas and studies show that flats have a 70% occupancy rate overall, and in respect of luxury villas, it is 50-60%.
12.4.1Residential Property Development Trends
The residential layout and residential building approvals in the LPA for the last five years (2020-2024) indicate 163 layout approvals and 55 building approvals as presented in Map 12.13. The residential layout approvals over the years demonstrate a scattered nature of developments without any specific designated residential growth direction. There are noticeable developments along the transit corridors and in the northern side of LPA compared to the southern side.
Map 12.13: Building and Layout Approvals (DTCP 2020-2024)
Building and Layout Approvals (2020 - 2024)
The pattern of layout approvals indicates the type of activities that have emerged in respective areas.
In the Municipal Corporation area, the following patterns emerge:
Kalapatti & Saravanapatti – These areas have emerged as IT and industrial hubs, with proximity to TIDEL Park and KGISL SEZ, leading to demand for high-density residential layouts and commercial spaces.
ii. Vellakinar & Thudiyalur – Located near NH-181 and Avinashi Road, these regions serve as key residential zones supporting the IT sector and industrial workforce.
iii. Veerakeralam & Chinnavedampatti – With increasing urbanization, these areas are experiencing mixed-use developments, driven by improved road networks and public transport connectivity.
iv. Kurichi – A rapidly growing locality benefiting from Coimbatore’s western expansion, where affordable housing and township projects are gaining momentum.
In the rest of LPA areas, the following type of developments have emerged:
i. Vellanaipatti & Irugur – Located near Coimbatore International Airport, these areas are seeing rapid real estate development, including premium residential layouts and logistics hubs.
ii. Pattanam & Kallapalayam – Proximity to NH-81 and NH-544 makes these regions ideal for industrial expansion, warehousing, and low-cost housing projects.
iii. Malumichampatti & Seerapalayam – Emerging as satellite towns with a focus on integrated township developments and large-scale residential layouts.
iv. Madukkarai & Kalangal – Home to manufacturing units, logistics parks, and educational institutions, leading to increasing demand for worker housing and commercial properties.
12.5.1Housing Requirement for 2041
The housing requirement assessment in relation to the current status of housing as well as projected number of households for 2041 is provided in the below Table 12.15.
Table 12.15Assessment of Housing Requirements for 2041
Category
No. of Households2024
Projected Households2041
Total Requirement of HHs (considering HH size of 3.4 upto 2031, 3.2 upto 2041)
Corporation
675835
1219933
544098
Municipalities
53254
95624
42370
Town Panchayat
133609
177402
43793
Revenue village
230230
327261
97031
Consolidated LPA
1092928
1820220
7,27,292
Housing shortage (calculated as per census 2011, 58th round NSSO, RAY scheme)
1,04,972
Total LPA
8,32,264
Including the existing housing shortage and accounting for projected population growth and household size, the total housing requirement by 2041 is estimated at 832,264 units
12.5.2Income Categories
The income categories according to PMAY guidelines are classified as EWS, LIG, MIG I and MIG II based on the annual income of the households as less than 3 lakh, 3-6 lakh, 6-12 lakh and 18 lakhs respectively. During the preparation of ‘Updation of Comprehensive Mobility Plan for Coimbatore Local Planning Area (LPA) 2023’, household interview surveys were conducted covering 12,117 households’ which also inquired into their household income levels as mentioned the Table 12.16. The number of households under different income groups across the LPA is estimated as follows:
Table 12.16Classification of income catagories
Income Group
Annual Income (INR)
Sample Household
Percentage
EWS (Economically Weaker Section)
below 3 lakhs
5214
43%
LIG (Lower income group)
3 lakh - 6 lakh
5193
42.8%
MIG I (Middle income group) and above
6 lakh - 12 lakh
1,710
14.2%
Total
12117
100%
Source: 'Updation of Comprehensive Mobility Plan for Coimbatore Local Planning Area (LPA) 2023’, Technical group report on urban housing shortage TG-12
Based on the above percentage of income distribution, the number of households required for each income category in 2041 is projected in the Table 12.17.
Table 12.17Housing requirement & income categories
Income Group
Annual Income (INR)
Percentage
Households Required in2041
EWS (Economically Weaker Section)
below 3 lakhs
43%
3,57,874
LIG (Lower income group)
3 lakh - 6 lakh
42.8%
3,56,209
MIG I (Middle income group)
6 lakh - 12 lakh
14.2%
1,18,183
The EWS and LIG are the income categories that need primary focus through public housing schemes. The MIG and HIG shall be catered through the private market.
12.5.3Land Allocation
The total area of the LPA is 1531.57 sq.km, and there is 317.67 sq.km of existing residential land use constituting 20.74% of the total area of LPA. The additional housing units is calculated with a household size of 3.4 upto 2031 and 3.2 upto 2041, considering a steady decrease in the household size, the additional households required for 2041 is estimated at 7,27,292 units. The housing shortage is estimated as 64,177 (of total 1,04,972), considering only houseless households, congested houses, slums will require
land. Hence the total additional houses/households requiring additional land will be 7,91,469. Assuming an average housing unit size as 1000 sq.ft, the total built-up area for the additional houses is calculated as 791.47 mn sq. ft and after applying a FSI of 1.5 (1.5 against 2 permitted), the land area required will be 527.64 mn sq. ft. Further including the plot coverage as 50%, roads as 25% and livable buffers as 15%, the total land area adds up to 1108.06 mn sq. ft which when converted to sq.km, it is 103 sq.km.
In continuation with the above analysis, and considering the potential to accommodate additional housing units in the existing low-density areas—up to 20% of the additional housing units projected by 2041—and the provision that residential land use can accommodate at least 20% of commercial space (as per TNCDBR), the additional land area required for residential use has been assessed to be 98.9 sq.km. The details are provided in Table 12.18 below:
Table 12.18Residential Land Area Required for LPA 2041
Particulars
Coimbatore LPA
Population (as per Census 2011)
24,57,452
Households (as per Census 2011)
6,73,033
No. of Households in 2024
10,92,928
Projected households 2041
18,20,221
Additional House/households (at the rate of 3.4 up to 2031 and 3.2 up to 2041)
Total additional housing in LPA requiring additional area
7,91,469
Assuming average housing unit size (43% EWS, 42.8% LIG, 14.2% MIG and above)
1000 sq. ft
12.6.1Proposals
Assessment of deficit: The total existing shortage has been assessed to be 1.04 lakhs. Typical to fast-growing larger cities, the slum households constitute almost 1/5th of the deficit. Addressing the deficit should be the priority in meeting the housing requirement
Assessment of new housing requirements: Based on the population projection and utilizing growth trends and accounting for the rapidly declining household size the number of new households expected by 2041 is 7.2 lakhs and a substantial part of the requirement is assessed to constitute the EWS and LIG of the society.
Estimated cost implication for implementation: Emphasis on addressing the requirement of EWS, LIG categories through collaborative efforts covering public, private, joint, cooperative and individual sectors. The fund requirement has been assessed for the implementation of 25% and 10% of the housing for EWS and LIG respectively. By 2031 to meet the full requirement of deficit as of now (about 1.08 lakh units) and the additional housing requirement of 49,613 units by 2031, assuming a unit cost of Rs. 8.5 lakhs for EWS and 16.5 lakhs for LIG as GoTN contribution*, the total fund requirement for 2031 is assessed to be about Rs. 5,347 crores. On similar assumption on the cost, to meet the additional new housing requirement for EWS and LIG categories during 2031-41, (additional 59,699 units), an additional requirement of Rs.6434 crore during 2031-during 2031-41 is estimated. In view of huge fund requirements, to meet the entire EWS and LIG housing requirement, appropriate public private partnerships is to be undertaken.
*The unit cost of EWS and LIG is assumed to be Rs. 12 lakhs and Rs. 20 lakhs respectively, of which 2 lakhs is assumed to be beneficiary contribution and 1.5 lakhs as Gol contribution and rest as GoTN contribution.
12.6.2Strategies
Housing in Coimbatore LPA has diverse characteristics in various parts due to the distinctive nature of developments. There are growing industrial, manufacturing and IT hubs, numerous educational institutions and growing medical tourism. Thus, Coimbatore is highly economically driven and the need for diverse housing to balance that growth is a pre-requisite to sustain the growth momentum.
The housing pattern in the core municipal corporation area is observed to be low-rise and high-density in nature, while in the environmentally sensitive areas and areas with natural barriers in the south, it is observed to be low-rise and low-dense, and in the industrial belt along the north eastern side of LPA (covering areas such as Arasur, Pachapalayam) it is low dense, and along the major transit corridors, there is an increase in high-rise buildings leading to higher densities.
Housing to be linked with established and emerging economic activity concentration areas: Coimbatore is one of fastest growing tier II cities with nine economic nodes. While a variety of activities are scattered throughout the city, a spatial concentration pattern is discernible in a few of the areas like Koundanpalayam, Kalapatti, and Saravanapatti with IT sector; Moppiraipalayam, Pachapalayam with EV, automobile & electronics; Pattanam and Pedampalli with Machinery & engineering. Thus, the residential developments are to target the requirement of workers in industries and IT sector.
ii. The transit corridors to be strengthened with increased housing areas/options: Improved accessibility being a prime factor for residential locations, the already evolved radial corridors, and the proposed road and rail (metro) corridors offer opportunities for increased residential development. Hence along the major transit corridors and arterial roads, a 500m buffer shall be given for residential development. It may cover the affordable housing requirement as well, appropriately. Promotion of Transit-Oriented Development (TOD) by allowing densification along mass transit systems would enable integration of residential and work-locations, thereby resulting in a significant reduction in the need for mobility by private vehicles.
iii. Affordable housing through the public sector to focus on employment locations: The public housing schemes by TNUHDB and TNHB are predominantly located in the municipal corporation. Hence, considering the growth pattern, housing for the EWS and LIG are needed in the peri-urban and close to the corporation boundary with good connectivity to the industrial and manufacturing
clusters, even while ensuring that the areas with red hazardous industries (Pachapalayam, Arasur) and environmentally sensitive nature are avoided. Evolving appropriate land sharing models to utilize public-private partnerships (PPP) options and to redevelop slums while ensuring tenure security for existing residents, would be a necessity. Promoting affordable Housing for the poor through Credit- subsidies and rehabilitation of existing slum dwellers with private sector participation using land as a resource are an imperative.
13.3.1Natural Heritage
The initial settlement of tribes and subsequent rulers in Coimbatore was fundamentally influenced by the region’s ecological factors—namely, the presence of rivers, favorable climate, and weather conditions conducive to agriculture.
The Western Ghats are UNESCO World Heritage Site (inscribed in 2012) and form the western boundary of Coimbatore district. The mountain ranges including the
Nilgiris, Valparai Hills, and Anaimalais are globally recognized for their exceptional biodiversity and ecological significance, being one of the world’s eight biodiversity “hotspots” with numerous endemics and threatened species. Key protected areas near Coimbatore include the Anamalai Tiger Reserve, Silent Valley National Park (across the Kerala border), and the Boluvampatti forest range, all crucial conservation zones linked to the Western Ghats ecosystem.
The Noyyal River, originating from the Velliangiri Hills in the Western Ghats, has been central to Coimbatore’s ecological and cultural landscape. Historically, it was part of a sophisticated water management system comprising 32 interlinked tanks and canals developed during the Chola and Kongu periods to support agriculture and recharge groundwater. The river nourished fertile plains that sustained artisan and farming communities, while also holding sacred value through temples like Perur Pateeswarar. An illustration of the Water Flow of Noyyal river system is given in Figure 13.2
Essentially, the ecological balance—integrating water resources, climate, and fertile land—has been the foundation upon which Coimbatore’s social fabric, community life, and cultural heritage have thrived. This intertwined relationship between nature and human society forms the city’s enduring natural heritage.
Figure 13.2: Illustration of Water Flow Chart of Noyyal river system from western ghats towards Coimbatore City West to the East: source: Research paper
13.3.2Built Heritage Assets in Local Planning area
13.3.2.1 Typology of Built Heritage
The typology of archaeological sites and structures found in the region and within the Local Planning Area is diverse, encompassing prehistoric settlements, ancient temples, colonial architecture, Art Deco buildings, vernacular houses, and utilitarian built forms.
A. Prehistoric or Archaeological Sites
Early historic habitation sites, ancient site mounds, prehistoric rock art sites (Fig. 13.4), megalithic burials, cairns, hero stones of varying sizes, inscriptions, commemorative remains, objects and burials, city walls, prehistoric relics such as coins, statues, and other valuable artifacts, as well as shrines and temples, are found across the region. A brief description of each typology is provided in Table 13.2.
source: Yakkai Heritage Trust, Coimbatore
Figure13.3: Rock paintings in Coimbatore’s Kumittipathy Hills reflecting Kongu history
Table 13.2Pre Historic and Medival Period Sites
S. No.
Village
Century
Typology
GPS location
1
Kovanur
Pre-Historic
Ancient Rock Painting
13.1614895,76.8912580
2
Kumittipathy
Pre-Historic
Ancient Rock Painting
10.8239129,76.8968893
3
Panapatti
Pre-Historic
Megalithic Burial -Around 30 Cairn Circles in same place
10.8592827,77.1071815
4
Idayarpalayam
Pre-Historic
Early Historic Habitation Site
10.9067337,77.1020340
5
Vellalore
Pre-Historic, 11 CE
Early Historic Habitation Site, Ancient Temple
10.981863,77.020507
13.3.3Intangible cultural heritage Assets in Local Planning area
13.3.3.1 The Legend of Koniamman
The legend says that, Kovan, the ruler of the Irula tribe, is believed to have worshipped the powerful goddess Sri Koniamman for the safety and prosperity of his people. Since then, she has been revered as a protective force and is regarded as one of the nine sister goddesses believed to have safeguarded the city across generations. The other deities include Mahakaliamman (Poomarket), Bhadrakaliamman (Thuraiyur Veedhi), Draupadiamman (K.G. Street), Vasavi Kannikaparameshwari Amman (Vysial Street), Kamakshi Amman (Big Bazaar Street), Sowdamman (Raja Street), Dandumariamman (Avanashi Road), and Ankala Parameshwari Amman (Vysial Street). Each of these goddesses is venerated in their respective shrines for various beliefs, forming a sacred network that continues to anchor Coimbatore’s spiritual and cultural identity.
(Source: Chariot festival)
Figure: 13.5: Sri Koniamman Ther Thiruvizha
Sri Koniamman Ther Thiruvizha—the Chariot Festival of Coimbatore holds immense spiritual, cultural, and communal significance (Figure: 13.5). Rooted in ancient temple traditions, the festival features a grand procession of the temple deity in a wooden chariot (ratham or ther), which is pulled through the streets by devotees. This vibrant expression of devotion and collective identity is not only a religious observance but also a celebration of urban identity. It reinforces a sense of place and belonging, reminding citizens of their shared heritage even amid rapid urban change.
Figure: 13.6: Panguni Uthiram Ther Thiruvizha in Perur Patheeswarar Temple
Similarly, Panguni Uthiram Ther Thiruvizha celebrated in Perur temple (Figure: 13.6) is also a significant festival. In other communities as well, religious festivals involve various processional and spatial movements throughout the city centered around their respective religious structures During these festivals, many events within community neighbourhoods, serving as focal points for ritual activities and social gatherings. A list of some significant events is provided in the accompanying Table 13.4.
13.3.4Urban Folklore
Urban folklore in Coimbatore is a mix of oral narratives, myths, local legends, popular sayings, and place-based beliefs that have grown with the city’s transformation from a quiet agrarian town to an industrial and educational hub.
Table 13.6Community events in and around LPA; (source: Made of Coimbatore)
Place
Legend / Associated Folklore
Sri Koniamman Temple
believed to be the guardian goddess of Coimbatore, protecting the city from disasters and disease.
Puliyakulam – Anthoniar Church
Tales of miraculous healings and divine visions during the church festival, passed down by generations.
Noyyal River & Sacred Tanks
Said to have healing powers; folklore speaks of saints and rituals performed to purify the land and people.
Karamadai
Temple tank and forest areas are said to be sacred, with tales of animals turning divine or vanishing mysteriously.
13.4.1Historical value of the urban fabric
Coimbatore’s transformation from an agrarian settlement into a dynamic industrial and cultural hub in the early 20th century unfolded in close interaction with its natural setting. The ecological framework played a foundational role in this growth. The Noyyal River, historically supported a sophisticated water management system of interlinked tanks and canals that sustained agriculture and urban life. However, industrialization and rapid urban expansion led to environmental degradation, particularly of the Noyyal River and its tank systems. Recognizing this, recent conservation efforts aim to restore key ecological features-such as the Singanallur, Ukkadam, and Valankulam tanks—bridging heritage and sustainability.
13.4.2Documentation gaps:
Coimbatore’s heritage encompasses numerous lesser-documented typologies, resulting in gaps within the region’s heritage planning and recognition framework. The lack of comprehensive documentation, protection mechanisms, and public awareness are critical to safeguard city’s cultural assets. Current data on the total extent of unprotected built heritage and archaeological remains is insufficient.
There is a need to formally recognize diverse typologies—including cultural landscapes, industrial heritage, mixed heritage, modern heritage, geo-heritage and traditional indigenous as well as emerging typologies. Such recognition will facilitate systematic documentation and conservation of built heritage, which serves as tangible testimony to Coimbatore’s rich legacy and illustrious past.
13.4.3 Proposed locations for site development integrating heritage structures
The below two sites viz., ancient well with Sculpture in Sundakamuthur an Kumuttipathy rock painting are proposed as possible locations for site development integrating heritage structures.
Table 13.7Proposed heritage site precinct development
Sl. No.
Location 1 details
Location 2 details
Details
Name & coordinatges
Ancient Well with sculpture in Sundakamuthur,16CE (10.9581591, 76.9310260)
Kumittipathy, Ancient Rock Painting, (10.8239129, 76.8968893)
14.1.1Destinations
14.1.1.1 Destinations of Coimbatore LPA
The existing tourism sites are identified and meticulously mapped as the first step in developing the tourism chapter of Coimbatore’s master plan. Pinpointing major attractions and their precise locations provides a crucial initial understanding of the city’s current tourism
infrastructure, spatial distribution, and potential. Existing tourist destinations within the Coimbatore LPA have been identified and categorized into themes according to the Tamil Nadu Tourism Policy 2023. Tamil Nadu Tourism Policy 2023 classifies tourism into twelve broad themes. They are:
Adventure Tourism
Recreation Tourism
Caravan Tourism
Rural and Plantation Tourism
Coastal Tourism
Cultural Tourism
Medical and Wellness Tourism
Religious Tourism
Eco-Tourism
MICE Tourism
Heritage Tourism
Film Tourism
In cases of overlapping tourism themes, the most prominent theme for a particular site is ensured for clarity and focused development. This primary thematic classification will also serve as a valuable framework for other sectors within the master plan, enabling them to align their own location identification and future proposals with the city’s core tourism strengths.
Table 14.1Destinations of Coimbatore LPA
S.No.
Name
Type
1
Maruthamalai Murugan Temple
Religious
2
Sri Perur Pateeswarar Temple
Religious
3
Eachanari Vinayagar Temple
Religious
4
G.D. Naidu Museum
Cultural
5
GASS Forest Museum
Eco-Tourism
6
Insect Museum, TNAU
Eco-Tourism
7
TNAU Botanical Garden
Eco-Tourism
8
Kovai Kondaatam
Recreation
9
V.O.C. Park
Recreation
10
Victoria Town Hall
13.4.4Temple Precinct Development with HRCE to enhance ancient temple precincts with social infrastructural development.
Coimbatore has some interesting and significant temples which have long been an important and intangible aspect of the socio-cultural fabric. The precincts surrounding them exhibit interesting built heritage characters and are utilised as an extension of the culture of the temples. All the temples are under HR&CE. It is important to jointly develop the precinct in collaboration with HR&CE, as the footfall of pilgrims to the temple play a big role in influencing the preceints.
Table 13.8Proposed temple precinct development
Sl. No.
Site/location
Location
1
Pateeswarar temple, (1500 years old),
Perur
2
Sangameswarar temple
Kottai near Ukkadam
3
Koniamman Temple (1000 years old),
, Town Hall
4
Kottai Easwaran Temple, (800 years old).
Kottai, near Ukkadam
The built heritage apart from the intangible cultural heritage of Coimbatore are very important in ensuring the uniqness and identity of Coimbatore are retained and add value to the day to day of life of people in spite of the growth foreseen in the coming years.
It is important the urban local bodies and the various departments, such as tourism, HR&CE ensure that the developments proposed sensitively consider these aspects and ensure wholistically development.
14.1.3Wellness and Medical Tourism
Tamil Nadu boasts top-tier medical tourism infrastructure with extensive resources: over 12,500 hospital beds, around 1 million registered doctors, numerous medical colleges and hospitals, and AYUSH resources. The potential of wellness systems, developed through centuries of the wisdom of this ancient civilization, can be done by positioning India as a center of Ayurveda, Yoga, Siddha, Naturopathy, etc, together with the spiritual philosophy that has been integral to the Indian way of life.
Coimbatore, a prominent city in Tamil Nadu, South India, has emerged as an attractive destination for medical travelers.
Coimbatore’s key strengths are in medical tourism, including its advanced medical facilities, experienced healthcare professionals specializing in cardiology, orthopedics, ophthalmology, and cosmetic surgery, and a substantial cost advantage compared to popular destinations like the United States, the United Kingdom, and even some Asian countries. Some of the major hospitals covered under medical tourism are:
GKNM Hospital
Sri Ramakrishna Hospital
Ganga Hospital
PSG Hospital
Kovai Medical Center and Hospital (KMCH)
Royal Care Super Speciality Hospital
The city and its surrounding areas offer a variety of options catering to different wellness needs, including traditional Indian systems of medicine, yoga retreats, naturopathy centers, and spa resorts.
Isha Yoga Center
Maitreyi - The Vedic Village
Indian Ayurvedic Hospital And Research Limited
RJR Herbal Ayurveda Siddha Unani And Nature Care Hospitals
Suguna Ayurgram Holistic Centre
Cauvery Ayurveda Gramam
Santhigiri Ayurveda & Siddha Hospital
Punarva Natural Health Care Centre
Anandham Yoga Natural Health Center
Uyirsakti Naturopathy & Yoga Hospital Cum Research Centre
A comprehensive study on wellness and medical tourism is crucial for formulating effective policies that enhance public access to and provision of healthcare facilities. Such a study should delve into the existing infrastructure, identify gaps, and explore the potential benefits and challenges of promoting medical tourism. The development of a robust management plan necessitates
14.1.2Destinations Around Coimbatore LPA
Based on the location of the city, the regional influence on tourism can be felt, mainly due to the presence of the Western Ghats and its ecosystem, temples, and Isha Yoga. Coimbatore is surrounded by Kerala on the west, which is mostly of the Western Ghats, Nilgiris on the north, east by Tiruppur, and northeast by Erode. The tourism impact is seen in the Nilgiris and Western Ghats region, with natural and adventure tourism as the main purpose. Vellaingiri pilgrimage and Marudhamalai Pilgrimage footfalls are mostly seen in February to May. Similarly, footfalls are higher during the summer season for visits to hills in April to June.
Table 14.2Destinations Around Coimbatore LPA
Name
Type
Kovai Coutrallam
Recreational
Poondi Velliangiri Temple
Religious
Bethesda Prayer Centre
Religious
Avinashi Lingeswarar Temple
Religious
Monkey Falls
Recreational
Valparai hill station
Recreational
Siruvani Hills
Recreational
Sholayar Dam
Recreational
Vaidehi Falls
Recreational
Salim Ali Ornithology Centre
Eco-Tourism
Adhiyogi Statue
Religious
Pilloor Dam
Recreational
Kadamparai Powerhouse
Cultural
Kallar Fruit Garden
Eco-Tourism
Aliyar Dam Park
Recreational
Baralikkadau Eco Tourism
Eco-Tourism
Baharathi Park
Recreational
Kovai Kuttralam, Siruvani Hills, Isha Yoga, and Vellingiri Hills, as a cluster of sites, fall outside the southwest of LPA. Mettupalayam falls on the northwestern side, outside LPA, with several attractions like Baralikkadau Eco Tourism, Piloor Dam, Black Thunder, and Kallar Fruit Garden. Towards Tiruppur, there are numerous tourist sites like Arulmigu Avinashi Lingeswarar Temple, Thirumuruganathaswamy Koil Poondi, Nanjarayan Tank Bike Sanctuary, and a few lakes. A few more regional tourist places are towards Erode and a few towards Pollachi and the Western Ghats.
14.2.1Tourist Footfall
Analysis of the trend of tourist footfall is done for the tourist destinations in LPA to understand the major and minor sites. This gives an idea of the people’s preferences and the level of importance of the site.
Maruthamalai Subramaniya Swamy temple is observed to have the most footfall for the past few years reaching 3,08,3354 in 2024. Similarly, Karamadai Ranganathar Temple, Perur Patteeswarar Temple, and Echanari Vinayaga Temple have high footfalls. Coimbatore has major footfalls on religious destinations. There is a slight decrease in footfall on Maruthamalai Subramaniya Swamy temple and Karamadai Ranganathar temple. All the destinations have an increase in footfall.
Map 14.3: Medical Tourism Map
Medical and Wellness Tourism Centers
Figure 14.1: Tourist footfall 2022 to 2024
G D Naidu Museum has the highest number of foreigners compared to its low domestic footfall. Perur Patteeswarar temple and Maruthamalai Murugan temple also have a high foreign tourist footfall. Other destinations have comparatively low or no foreign footfall.
Figure 14.2: Comparison of domestic and foreign tourists in 2024
Table 14.3Total Footfalls At Destinations In Coimbatore Lpa Per Year
Type of Tourist
Number of footfalls at destinations per year
14.2.2Tourist stay
The accommodation during the tour is also one of the aspects that the quality of tourism of a city is measured. The types of accommodations are:
• Hotels
Resorts
Dormitories
Serviced Apartments
Guest Houses
Vacation Homes/Holiday Cottages
Farmhouses
Cabins/Huts
Boutique Hotels
Eco-Lodges
Homestays
Apartment Hotels
Camping And Glamping
Caravan Parks
Houseboats
The existing density of hotels inside the corporation is marked, and the tourist spots are overlaid for an overview of the concentration of the accommodations for the tourists. The five-star and four-star hotels are marked for a rough typology mapping and preference of tourists.
Most of the hotels are located in the city center and along the corridors of Tiruppur and Erode. Most of the tourist spots are in proximity to hotels, except the ones in Selvapuram, due to the presence of the Lakes and the Tamil Nadu Agriculture University campus. Therefore, all the areas are served with hotel facilities for the tourist spots. Some of the 5-star hotels, namely Le Meridian and Darza Luxury Resort, are located away from the city center for an urban retreat.
Based on the Tourism Survey for Tamil Nadu (Jan to Dec 2014) report created by the Ministry of Tourism (Market Research Division), Government of India, the total number of accommodation units present was mentioned.
Table 14.5Summary of Accommodation Units in Coimbatore District
District
Total Accommodation Units
Total Rooms
Coimbatore
161
3185
Source: Tourism Survey for Tamil Nadu (Jan to Dec 2014) report, Ministry of Tourism (Market Research Division)
This does not include Company Guest houses, Guest houses run by trusts, Dormitories, free Dharamshala, tourist bungalows, and free accommodation units in the state of Tamil Nadu. Based on this, the capacity for the incoming tourist is calculated. The average occupancy rate is expected to be between 60-62% for year 2014. Given the tendency for a significant portion of domestic tourists to travel in groups, the average number of tourists per occupied room in India is between 1.5 and 2.5. Therefore, the average number of domestic tourists per room is considered 2.5 and foreign tourist as 1. The average days of stay are 1.14 for domestic and 2.14 for foreign tourists, according to the Tourism Survey report by the Ministry of Tourism. According to the report, 37% of the tourist arrivals stay overnight, who are expected to need accommodation. Therefore, based on these assumptions, the number of rooms needed is calculated below.
14.2.3Travel analysis
Micro Tourism
There are four major transport stations here in Coimbatore LPA: GandhiPuram / Omni Bus Stand, CBE Railway Junction, Airport, and Singanallur Bus Stand. Considering these transport nodes as entry points, a circuit of tourist spots that can be covered in a day is analyzed. It falls within a distance of 5km.
Table 14.7Destinations covered by Gandhipuram Bus Stand and Railway Station
Gandhipuram Bus Stand
Gandhipuram Bus Stand
CBE Railway Station
CBE Railway Station
S. No
Name
Distance in km
Name
Distance in km
1
V.O.C. Park
1
Kottai Mosque
1
2
Government Archaeological Museum
1
Valankulam Lake
1
3
KMCH
1
Koniaaman Temple
1
4
Police Museum
2
Victoria Town Hall
1
5
KG Hospital
2
Government Medical College hospital
1
6
Thandu Marriaman Temple
2
Police Museum
1
7
G.D. Naidu Museum
2
KG Hospital
1
8
GKNM Hospital
2
Thandu Marriaman Temple
1
9
Sri Ramakrishna Hospital
2
Ukkadam Periyakulam Lake
2
10
Kottai Mosque
3
G.D. Naidu Museum
2
11
Valankulam Lake
3
V.O.C. Park
2
12
Koniaaman Temple
3
Government Archaeological Museum
2
13
Victoria Town Hall
3
Selvachinthamani Lake
3
14
Government Medical College hospital
14.2.4Major tourist flow days Festivals
Coimbatore celebrates many festivals including local temple festivals. Festivals bring a large amount of religious tourists to the city. It is important to identify and create the capacity to handle these peak flows. Thai Pongal, celebrated
in January, is the most important festival and the festivities continue for more than five days.
Tahipoosam And Thirukarthigai Festival-Maruthamalai Temple
Panguni Uthiram Festival-Perur Patteswarar Temple
Sri Koniamman Temple Festival
Aranganathar Temple Festival-Karamadai
Anthoniar Church Festival-Puliyakulam
Lord Jagannath Organised By Iskcon
Tahipoosam and Thirukarthigai - Maruthamalai Temple (January/February)
These are significant Hindu festivals celebrated at the Maruthamalai Murugan Temple. Tahipoosam is dedicated to Lord Muruga and involves devotees carrying milk pots and kavadi. Thirukarthigai is a festival of lights, celebrated during the Karthigai month with rows of lamps lit in homes and temples.
Tourism Footfall: These festivals, especially Tahipoosam, attract a large number of devotees from in and around Coimbatore and potentially other parts of Tamil Nadu. Expect a significant increase in visitors to Maruthamalai Temple during this period.
Panguni Uthiram Festival - Perur Patteswarar Temple (March)
Panguni Uthiram is a popular Hindu festival celebrated in the Tamil month of Panguni (mid-March to mid-April). It typically marks the marriage of various deities. The celebration at the ancient Perur Patteswarar Temple is a significant event.
Tourism Footfall: This festival draws a considerable number of devotees to the Perur Patteswarar Temple. It’s likely to see a noticeable increase in local and regional tourism.
Sri Koniamman Temple Festival (March 1st)
The highlight of this festival is the Car Festival (Rath Yatra) of Sri Koniamman, the presiding deity of Coimbatore city. The chariot procession through the main streets is a grand spectacle.
Map 14.7: Macro Tourism Coverage
14.2.5Medical Tourism
The analysis of secondary data, coupled with recommendations from Central, State, and Coimbatore Tourism Departments, indicates that the collection of comprehensive medical tourism data is currently in a collaborative yet challenging stage. This difficulty arises from the diverse landscape of governmental bodies, private entities, and non-governmental organizations involved. The presence of numerous agents, facilitators connecting individuals with medical tourism options, and private aggregators partnering with private hospitals further complicate data aggregation. Critically, the absence of a central governing organization and standardized structure hinders the systematic collection and analysis of this vital information. Consequently, the full potential and public awareness of medical tourism remain unrealized, limiting the benefits for both the population and the government.
Medical Tourism Information Center: Considering the importance of Medical Tourism, the Department of Tourism along with the hospitals established a Medical Tourism Information Centre in the Tamil Nadu Tourism Complex and Travel Desks in Chennai and Madurai. A core committee of medical experts and the Directorate of Medical Education oversee the system.
14.2.6National Recommendations
14.2.6.1 Medical Tourism
Leverage Globally Trained Professionals: Actively promote the fact that a significant portion of Indian doctors and surgeons have received training or experience at renowned medical institutions in the US, Europe, and other developed nations.
Highlight Language Proficiency: Emphasize the widespread fluency in English among Indian doctors and nurses as a key facilitator for international patients.
• Showcase Advanced Medical Technology: Underscore the availability of top-tier medical and diagnostic equipment from leading global manufacturers in many Indian hospitals.
Promote Nursing Excellence: Recognize and market the exceptional quality and skills of Indian nurses, highlighting the robust nursing education system with its numerous training centers and high annual graduation rate.
Emphasize Cost-Effectiveness and Quality: Communicate the value proposition of affordable, first-rate medical services combined with luxury amenities that cater to budget-conscious travelers.
Develop Targeted Marketing Campaigns: Create specific marketing initiatives that highlight these advantages to potential medical tourists in key target markets.
Streamline Patient Experience: Focus on creating a seamless and positive experience for international patients, from initial inquiry to post-treatment care.
Foster International Partnerships: Explore and cultivate collaborations with international healthcare providers and organizations to build trust and referral networks.
Ensure Quality and Accreditation: Continue to maintain and promote high standards of medical care and seek international accreditations to further enhance credibility.
14.2.6.2 Wellness Tourism
Enhance Quality Promotion: Develop and disseminate high-quality publicity materials that effectively showcase India’s unique wellness offerings, including Ayurveda, Yoga, Siddha, Naturopathy, and its rich spiritual heritage.
Invest in Service Provider Development: Implement comprehensive training and capacity-building programs for wellness service providers to ensure consistently high standards of service and expertise.
Actively Participate in Global Platforms: Encourage and facilitate the participation of Indian wellness stakeholders in prominent international and domestic wellness-related events to increase visibility and attract a wider audience.
Strengthen Accreditation Standards: Promote and support the adoption of the NABH accreditation guidelines for wellness centers to guarantee quality service delivery across the nation.
14.4Proposals
14.4.1 Eco & Lake Tourism Trails
The Coimbatore City Municipal Corporation (CCMC) manages several lakes within the city, focusing on water conservation, eco-tourism, and biodiversity restoration. These lakes play a key role in groundwater recharge, flood management, and recreational activities.
Table 14.15The list of major lakes maintained by the Coimbatore Corporation
Eco Restored Lakes
Selvachinthamani Lake
Naramsampathy Lake
Periyakulam Lake
Krishnampathy Lake
Valankulam Lake
Singanallur Lake
Kumarasamy Lake
Selvampathy Lake
The Coimbatore City Municipal Corporation (CCMC) has undertaken eco-restoration efforts, including cleaning, desilting, and afforestation around lakes to enhance water conservation of these 8 lakes. Additionally, selected lakes have been developed for tourism and recreation, featuring boating, cycling tracks, and walking paths. Lakes like Singanallur and Valankulam serve as biodiversity hotspots for birdwatching. Most of the lakes are interconnected.
Coimbatore City Municipal Corporation (CCMC) has also prepared a NMT Network Plan for Coimbatore with the support of the Deutsche Gesellschaft für Internationale Zusammenarbeit (GIZ) GmbH. The plan focuses on 26 pedestrian hotspots and a 290 km network of safe and convenient roads for cycling and walking (GIZ, 2020). The Smart City proposal for an Eco-Mobility corridor connecting all these 8 lakes is in progress.
An 18 km sustainable Eco-tourism trail connecting the eight lakes can be developed and will significantly enhance visitor appeal while prioritizing ecological preservation through eco-friendly infrastructure for transport and recreation. It can enrich the bird-watching experience via informative signage. This trail will function in the Eco-mobility corridor proposed by the Smart City, offering scenic cycling tracks with potential rental/ repair, and beautifully landscaped footpaths/promenades with seating. Considering the lakes as key nodes, eco-designed and accessible restrooms, strategically located water points, and curated local eateries with robust waste management will be provided, alongside rental cycles (including tandems) and electric golf carts for transport. Beyond transport, diverse recreational activities like guided nature walks and boating can be explored, all while actively engaging local communities and prioritizing sustainable practices to minimize environmental impact and ensure the long-term ecological health of the lake ecosystems.
14.4.2Museum Tourism Connect
Given the significant number of museums within the Coimbatore Local Planning Area (LPA), a compelling Museum Linkage could be established. This linkage, curated to encompass themes such as ecology, science, technology, and police history, promises to captivate tourists, fostering engagement and sparking curiosity with exciting and diverse exhibits.
Map 14.8: Eco-Tourism Lake Trail
Eco-Tourism Lake Circuit
Table 14.16Museum Connect
S.No.
Name
1
Insect Museum, TNAU
2
GASS Forest Museum
3
Government Museum
4
Police Museum
5
Government Archaeological Museum
6
G.D. Naidu Museum
7
Experimenta Science Museum
8
Regional Science Center and Museum
9
PSG GRD Museum
Figure 14.5: Museum Connect
With a linkage of 30 km, eight different museums can be visited. Improving a museum tourist linkage involves several interconnected strategies focusing on enhancing the visitor experience, accessibility, and promotion. Some key approaches are:
Enhancing the Visitor Experience:
Improve Wayfinding and Signage: Clear, consistent signage with easy-to-understand language, universal symbols, and color-coding helps visitors navigate intuitively. Consider digital signage for dynamic content and real-time updates.
Offer Diverse and Engaging Experiences: Go beyond static displays. Incorporate interactive exhibits, multimedia (videos, animations, audio), and multi-sensory experiences to cater to different learning styles and increase engagement.
14.5.1Overall Strategy
The overall strategy of tourism in Coimbatore LPA to make it a tourist-intensive location is given below:
Destination Development:
Develop sites of heritage values identified in the heritage chapter, namely Kumitipatti Rock Art Painting, St. Mark’s church, Kuthirai Vandi Court and Forest College.
Improve infrastructure at the five main temples for increased footfall.
Sculpturing on Granite stone, Weavers of cotton sarees, Bamboo basket and screen making, Terracotta pottery, Coir rope-making, Hand-made gold jewellery, Brick-making and Bone-setting crafts should be recognised and enhanced.
Protecting Tangible & Intangible:
Implement sustainable management for the five main temples and promote Kongu Nadu cuisine.
Showcase local art forms and preserve oral traditions/ festivals like Sri Koniamman Ther Thiruvizha, Panguni Uthiram Ther Thiruvizha, Masaniamman Gundam Festival, St. Michael’s Cathedral and CSI Church festival and Ramzan at Eshwaran Kovil street.
Mapping Tourist Journey:
Create thematic connects (Eco-tourism, Museum and Religious).
Improve multi-modal connectivity and establish information centers at Gandhi Puram Bus stand and Coimbatore Railway Station.
Empowering Private Sector:
Incentivize hotels and experiential resorts.
Support local guides/operators and foster publicprivate partnerships.
Promote agri-tourism along the western side of Coimbatore.
Creating Local Identity & Pride:
• Highlight local achievements and involve communities (like Kovai Vizha, etc.) in tourism.
Focus on beautification and promote Coimbatore as safe/hospitable city.
Targeting Higher Value:
Focus on experiential tourism and encourage longer stays.
Develop the niche segments like medical and educational tourism to attract more tourists.
Authentic & Memorable Experiences:
• Offer immersive cultural encounters and naturebased activities.
• Promote culinary tourism and personalized experiences.
14.5.2Tourism Gateway Hub
Tamil Nadu Tourism Department has envisioned the creation of gateway hubs for tourism, and Coimbatore is one of them. Coimbatore, with good quality urban infrastructure, shall be developed as a Gateway Hub, from where visitor to Tamil Nadu can initiate their journey.
These Gateway Hubs shall offer a world-class standard facilities and amenities to visitors, like:
Connectivity to other parts of the country and foreign markets
Tourist facilitation and assistance
Tourist amenities like ATMs, foreign exchange, shopping, etc.
Easy mobility
Good quality hospitality spaces
Development at Gateway Hubs:
Streamlined Transit with HOHO facility: The convenience of tourists will be ensured with the deployment of Hop-On-Hop-Off (HOHO) service to connect the airports, railway stations, and major tourism sites in Gateway Hubs. This operation will be outsourced to private entities, with the Department deciding the number of routes and buses based on market research.
Emphasizing Cleanliness and Hygiene: Social awareness campaigns focusing on the cleanliness and hygiene of public spaces will be initiated. The responsibility of maintaining cleanliness and hygiene will fall under the purview of the Urban Local Body.
Allocation of Funds: An allocation of 5% from the Smart City funds will be dedicated to enhancing tourism infrastructure in primary Gateway Hubs.
Establishment of Tourism Information Centres (TICs): TICs including virtual kiosks will be established at strategic locations, such as Coimbatore International Airport, Coimbatore Junction Railway Station, Gandhipuram Bus stand and Singanallur Bus Stand.
Security Measures: Ensuring tourist safety, CCTV monitoring, and tourism security personnel will be deployed at tourism sites.
Digital Map and Guidebook Availability: High-quality digital maps and guidebooks indicating significant tourism attractions, routes, and the locations of amenities such as TICs and ATMs will be published.
Banking and Foreign Exchange Services: ATMs, banks, and foreign exchange centers will be conveniently located on all major tourist routes, markets, airports, railway stations, and bus terminals in the city.
14.5.3Medical & Wellness Tourism Strategy
Since Coimbatore’s signature tourism after religious tourism is its unique specialty of Medical and Wellness Tourism. Even though medical tourism is prominent, the structure and awareness of the system are very limited. The potential for medical tourism can be unlocked by following these strategies:
1. Establish a Local Medical Tourism Task Force under the tourism department:
Convene a dedicated task force from tourism department comprising representatives from major hospitals (both public and private, including those specializing in Ayurveda and wellness), relevant government health agencies, local medical associations, and prominent hotels and hospitality providers.
This task force will be responsible for strategizing, implementing, and monitoring medical tourism initiatives specific to Coimbatore.
2. Develop a Coimbatore-Specific Data Collection Mechanism:
The task force will build upon the state and national efforts, to create a streamlined data collection system tailored to Coimbatore’s medical tourism ecosystem.
This could involve a centralized online portal where hospitals, wellness centers, and registered facilitators in Coimbatore can input key data points such as:
Number of international patients treated (origin country, type of treatment).
Revenue generated from medical tourists.
• Types of procedures and wellness services availed.
Patient feedback and satisfaction levels.
Partnerships with international organizations or facilitators.
Collaborate with existing platforms like the Coimbatore Tourism portal to integrate medical tourism-related information and data collection tools.
Explore partnerships with local private aggregators to understand their data collection methods and identify areas for synergy and standardization.
3. Formalize and Register Local Medical Tourism Facilitators:
Implement a system for the registration and accreditation of medical tourism facilitators operating within Coimbatore.
This will ensure accountability, quality of service, and ethical practices.
Registered facilitators can be mandated to contribute to the centralized data collection system.
15.1.1Overview And Aim
Coimbatore Local Planning Area (LPA) occupies a strategic ecological position between the Deccan Plateau and Western Ghats UNESCO World Heritage site. This unique location creates a diverse landscape supporting rich biodiversity and vital ecosystem services through its hillocks, forest reserves, wetlands, tanks, rivers, and agricultural lands.
This section aims to establish environmental planning, management and resilience by:
Preserving ecological assets (forest belts, water bodies, biodiversity hotspots)
• Integrating ecological infrastructure in urban planning
SDG 12: Responsible Consumption and Production
Promoting sustainable resource management
• Reducing environmental impacts of urban activities
SDG 13: Climate Action
• Implementing climate adaptation and mitigation measures
Aligning with Tamil Nadu Climate Change Mission and India’s NDCs
SDG 14: Life below Water
• Protecting and restoring water-based ecosystems
Sustainable management of the Noyyal River and wetland systems
SDG 15: Life on Land
Conserving forests and biodiversity, particularly Western Ghats connections
Preventing habitat fragmentation around Boluvampatti, Thadagam, and Anaikatti
This framework supports Tamil Nadu’s Vision $1 Trillion economic strategy while addressing environmental challenges from rapid urbanization and climate change.
15.1.2Environmental Features
Coimbatore’s environmental history is deeply shaped by its unique regional climate, forested landscapes, water systems, and natural resources, which have collectively influenced the establishment and growth of the area over centuries.
Climate and Geography
Coimbatore sits in the Western Ghats rain shadow, enjoying a moderate climate with elevation ranging from 201m in the east to nearly 1980m at the western border with the Nilgiri Biosphere Reserve. This topographical diversity creates distinct microclimates and ecological zones.
Ecological Assets
Forests: Western and northern peripheries contain extensive reserve forests within the Western Ghats biodiversity hotspot, serving as critical watersheds and ecological regulators
Water Systems: The Noyyal River and approximately 30 historic wetlands/tanks form an interconnected hydrological network dating back to the 8th-9th centuries
Environmental Challenges
Urban expansion has impacted many wetlands and disrupted natural drainage patterns, compromising the historical water management infrastructure that enabled the region’s agricultural and industrial development.
Planning Implications: The environmental foundation—climate, forests, and water systems—remains critical for sustainable urban planning. Understanding these underlying geological and ecological systems is essential for groundwater management, soil stability, and overall environmental resilience amid continued development pressures.
The environmental layout of the Coimbatore LPA plays a crucial role in determining the environmental landscapes that are in the vicinity, mostly to the west and north. Understanding the underlying land formations is critical for sustainable planning, influencing groundwater dynamics, soil stability, and seismic risk assessment.
This environmental map (Map 12.1) serves as a decision-support tool for future spatial planning, integrating conservation imperatives with urban expansion, thereby ensuring climate-resilient and ecologically balanced growth in Coimbatore. The attached map provides a spatially rich depiction of the environmental landscape of the Coimbatore LPA, including:
Topographic Diversity: The map illustrates elevated zones like the Palamalai, Perumal Mudi, and Pichanur Peaks in the Western Ghats, gradually sloping eastwards towards the plains. This elevation gradient is crucial for orographic rainfall and microclimate regulation.
15.2.1Vegetation
Based on the classification made public by the Forest Department, Government of Tamil Nadu, the following are the dominant vegetation types, as mentioned below.
The West Coast Tropical Evergreen Forests (1A/C4)
Phoenix Dry Mixed Deciduous Forests (5/E 8a)
Table 15.3Dominant Vegetation Types within Coimbatore LPA
Vegetation Type
Description
Key Species
Environmental Significance
Spatial Distribution
West Coast Tropical Evergreen Forests (1A/C4)
Found at altitudes up to 1500 meters with heavy rainfall; characterized by dense, multi-layered canopy, epiphytes, and limited ground vegetation.
Gently sloping and lower elevation zones, particularly in reserve forests and protected patches around Thadagam, Perur, and Kovaipudur.
Green Spaces (Parks)
Managed green areas within the Coimbatore City Municipal Corporation (CCMC).
Various ornamental trees, shrubs, and lawns.
Urban cooling; recreation; aesthetic value; air quality improvement.
Located within the Coimbatore City Municipal Corporation (CCMC) limits.
Reserved Forests
Protected forest areas around the LPA, legally managed for conservation and sustainable use.
A mix of the above forest types.
Biodiversity conservation; climate regulation; watershed protection; habitat for wildlife.
Border the LPA, especially to the west and north (Thadagam, Anaikatti, and Booluvampatti)
15.2.1.1 Green Spaces
15.3.1Water Bodies
Coimbatore’s hydrological network, as shown in the Map 15.5 plays a vital role in sustaining the region’s water resources, ecological balance, and urban development. The city is naturally contoured, allowing water to drain from the western highlands to the eastern lowlands. The Noyyal River, a key water source, flows through the region, forming the southern boundary of the old city limits and feeding an extensive system of lakes, tanks, and reservoirs.
The Coimbatore Local Planning Area (LPA) comprises a well-connected system of natural drains, lakes, and manmade reservoirs that contribute to groundwater recharge, flood mitigation, and water supply for domestic, industrial, and agricultural use. These waterbodies, shown in the map below, serve as crucial storage units, particularly during monsoons, helping to regulate water availability throughout the year.
Coimbatore is enriched with natural resources, including interconnected lakes and the Noyyal River, which are essential to its ecosystem. The city has a significant number of water bodies, including 28 wetlands, many of which are fed by the River Noyyal. These water bodies play a crucial role in water storage, flood control, and maintaining ecological balance within the Coimbatore Local Planning Area (LPA).
Map 15.5: Water Bodies map
15.2.2Biodiversity
The region serves as a vital ecological corridor, linking the semi-arid Deccan Plateau with the tropical rainforests of the Ghats, and encompasses a mosaic of landscapes including reserve forests, wetlands, rivers, and agricultural lands. This diversity supports an array of flora and fauna, with notable areas such as the Singanallur Lake Urban Biodiversity Conservation Zone, which alone harbours over 720 species, including 155 bird species and 369 plant species, alongside butterflies, mammals, reptiles, amphibians, and fish. The western and northern peripheries of the LPA are dominated by reserved forests like Boluvampatti, Thadagam, and Anaikatti, which are critical for habitat connectivity, climate regulation, and groundwater recharge
15.2.2.1 Flora
The flora of the Coimbatore Local Planning Area (LPA) reflects its diverse topography, climate variations, and ecological zones, ranging from the foothills of the Western Ghats to the drier eastern plains. This diversity supports a wide array of plant species, which are crucial for maintaining ecological balance, supporting wildlife, and sustaining ecosystem services.
Table 15.7Floral Diversity by Ecological Zones
Ecological Zone
Dominant Vegetation Types & Key Species
Ecological Significance
Spatial Distribution
Western and North-Western Foothills
Tropical evergreen and semi-evergreen forests. Species include Hopea parviflora, Mesua ferrea, Calophyllum elatum.
Acts as green lungs; supports wildlife corridors including elephant movement; critical for carbon sequestration and watershed protection.
Boluvampatti, Velliangiri, Marudamalai hills adjoining the LPA western and north-western fringes.
Mid-Elevation Dry and Moist Deciduous Forests
Teak (Tectona grandis), bitter albizia (Albizia amara), Indian laurel (Terminalia arjuna), East Indian satinwood (Chloroxylon swietenia).
Provides habitat for diverse fauna; supports soil conservation and local climate regulation.
Reserve forests and protected patches around Thadagam, Perur, and Kovaipudur within the LPA.
Coimbatore boasts a significant number of urban wetlands, with major ones including Narsampathi, Krishnampathi, Selvampathy, Kumarasamy, Selvachintamani, Ukkadam Big Tank, Valankulam, Singanallur, Kuruchi Kulam, and Perur Lake. These lakes, despite their ecological importance, face severe anthropogenic pressure and threats. The Coimbatore Smart City Proposal has identified eight major lakes for rejuvenation to improve the city’s liveability and integrate them into urban development.
Master plans have been developed for each of these eight lakes under the eco-restoration program. These plans likely include interventions such as desilting, afforestation, and wetland conservation. The rejuvenation efforts also aim to establish artificial nesting platforms and promote native vegetation to attract migratory birds, alongside the implementation of real-time water quality monitoring.
Examples of specific lake interventions proposed in the Master Plan include those for Selvachintamani Lake, Periyakulam Lake, and Valankulam Lake, with a focus on lake-level interventions. Kumaraswamy Lake is noted as having a completely built-up catchment area within the core corporation limits. Singanallur Lake is highlighted as a prominent and ecologically significant water body known for its rich biodiversity.
Table 15.11Lakes and their Catchment Areas
S. No.
Lake Name
Village Name
Catchment Area (sq. km)
Capacity (M.cft)
Ayacut (in Acres)
1.
Ukkulam Lake
Pooluvampatti
2.06
24.42
232.00
2.
Pudukulam (Vedapatti Lake)
East Chitrachavadi
1.90
3.41
94.00
3.
Kolarampathy Lake
East Chitrachavadi
1.60
3.41
133.00
4.
Narasampathy Lake
Vedapatti & Telungupalayam
9.95
9.50
551
5.
Krishnampathy Lake
Telungupalayam
71.48
7.67
569.00
6.
Selvampathy Lake
Telungupalayam
4.00
9.95
206.00
15.3.1.2Rivers
Coimbatore, situated within the Noyyal River Basin, has an interconnected network of 28 wetlands and 10 major lakes, including Narasampathi, Krishnampathi, Selvampathy, Kumarasamy, Selvachintamani, Ukkadam Big Tank, Valankulam, Singanallur, Kurichi Kulam, and Perur Lake. These water bodies play a vital role in groundwater recharge and irrigation.
The Noyyal River is a crucial water source for Coimbatore, feeding many of the city’s 28 wetlands. The river is interconnected with the lakes, playing a significant role in the hydrological system of the region. However, like the lakes, the Noyyal River also faces challenges, as evidenced by tributaries with foam on the water surface, indicating potential pollution.
Emphasis is given on the importance of understanding the interconnections between the lakes and the Noyyal River for effective ecological restoration. Proposals for the rejuvenation of water bodies in the plan include initiatives along streams like the Sanganur Stream, which is currently affected by encroachments and slums. The proposed redevelopment of such streams involves relocating encroachments and implementing a blue-greengrey infrastructure approach to mitigate pollution and restore ecological health, including filtration strips and bio-filters.
The sustainable management of Coimbatore’s water infrastructure emphasizes the vital role of rivers for storage, flood control, and ecological balance. Therefore,
conservation initiatives and sustainable urban planning are essential to protect the health and functionality of the Noyyal River and its tributaries.
The Noyyal River, a historically significant tributary of the Cauvery River, originates from the Vellingiri Hills in the Western Ghats within Coimbatore LPA. It flows eastward, threading through the city’s core and nourishing a chain of ancient tanks before merging with the Cauvery in Tirupur/ Erode region.
Table 15.13Key Characteristics of the Noyyal River:
Feature
Description
Source
Vellingiri Hills (Western Ghats Biosphere)
Length
~160 km (major section within Coimbatore District) of which 55 km (approx.) flows within the LPA region
Hydrological Role
Interconnected with 28 tanks historically used for irrigation, flood moderation
15.3.1.4Ground Water
Coimbatore’s groundwater resources face significant challenges, including overexploitation in urban and periurban areas (e.g., Coimbatore North, Peelamedu) where extraction exceeds recharge rates, leading to declining water tables (up to 15m below ground level pre-monsoon) The ground water resources in Coimbatore are under significant pressure. A study conducted in December 2020 indicated that the average ground water level had gone from 10.34m to 11.75m, and ground water extraction was at 113.05%, exceeding permissible limits. Depleting ground water resources is a matter of concern for the sustainability of water supply in the region.
The Coimbatore Master Plan proposes strategies for the augmentation of groundwater resources through systematic capture and infiltration of excess water, including domestic and industrial wastewater, and storm water runoff. Nature-based solutions are also emphasised as a comprehensive and sustainable approach to urban water management, which can contribute to groundwater recharge. Rainwater harvesting devices (reverse wells) are already being installed by NGOs like Siruthuli to combat flooding and recharge groundwater.
It includes ground water qualitative and quantitative analysis. Maps showing ground water quality in terms of pH, total hardness, calcium, magnesium, chloride, fluoride, sulphate, and nitrate are part of the assessment. These analyses are crucial for understanding the current status and formulating effective management strategies for Coimbatore’s ground water resources.
Pollution from industrial effluents (e.g., heavy metals near SIDCO estates) and agricultural runoff (nitrate contamination) further degrades water quality. The district’s hard rock aquifers (weathered gneiss and charnockite) exhibit erratic yields (50–300 LPM) and low permeability, exacerbating stress during droughts. Saline intrusion risks emerge in south-eastern zones (Sulur) due to over-pumping. Despite artificial recharge initiatives (check dams, percolation ponds), the stage of groundwater extraction remains critical (201% in Coimbatore South Firka), necessitating stricter regulation and sustainable practices. Climate variability and urbanization further strain resources, demanding integrated management to ensure long-term water security.
15.3.1.6Aquifer Thickness & Depth
The thickness (Map 15.8) shows storage potential. Thicker zones exist near hilly regions and foothills (west and north), while urban cores have thin or disturbed aquifers.
The depth (Map 15.9) reflects energy cost of extraction and recharge lag. Deeper aquifers in eastern and industrial areas show signs of long-term exploitation.
Table 15.22Aquifer Characteristics in Coimbatore LPA
Zone / Region
Aquifer Thickness (Map12.14)
Aquifer Depth (Map 12.15)
Key Observations
Planning Significance
Recomm-ended Strategies
Western Hills (Anaikatti, Booluvampatti, Thondamuthur)
High (25-40 m) due to weathered rock layers and natural percolation from forested slopes
Deep (40-60 m) but sustainable due to forest recharge
Excellent recharge potential, low stress
Ecological recharge zones
Declare as groundwater conservation zones, limit bore well permits
Central Urban Core (Townhall, R.S. Puram, Gandhipuram)
Low to Moderate (10-20 m) due to built-up cover
Moderate Depth (25-35 m) with declining trend
Impervious surfaces restrict recharge
Urban recharge deficit
Mandate rainwater harvesting, install reverse wells, green roofs
Eastern Fringe (Sulur, Neelambur, Irugur)
Moderate (15-25 m) with mixed clay-sand layers
Very Deep(50-70m) due to excessive extraction
High groundwater stress
Over-exploited zone
Promote treated wastewater reuse, restrict groundwater for new industries
Coimbatore is a region rich in ecological diversity, possessing 28 wetlands, most of which are fed by the Noyyal River. These wetlands are vital ecosystems supporting a large number of plant and animal species. However, many of these wetlands, including major urban ones like Narsampathi, Krishnampathi, Selvampathy, Kumarasamy, Selvachintamani, Ukkadam Big Tank, Valankulam, Singanallur, Kuruchi Kulam, and Perur Lake, are under severe anthropogenic pressure and threat.
The Tamil Nadu Wetlands Mission highlights the ecological and socio-economic benefits of wetlands, including their role in irrigation, groundwater recharge, water purification, recreation, tourism, and disaster risk reduction. The mission aims to protect these wetlands through comprehensive conservation and management plans, involving District Level Wetland Management Committees and local communities. Key objectives include estimating the economic value of ecosystem benefits, assisting decisionmaking bodies, and analysing the impact of enhanced ecosystem services on livelihoods.
There is evidence of degradation of wetlands due to pollution and encroachments, which threatens local flora
and fauna. Initiatives such as lake restoration projects, afforestation programmes, and sustainable urban planning are being undertaken to preserve the region’s ecological balance. The Master Plan also proposes strengthening lake restoration through desilting, afforestation, and wetland conservation, as well as establishing real-time water quality monitoring.
The implementation of floating wetlands aims to establish unique lake ecosystems that support increased biodiversity and the proliferation of native flora and fauna. The specific objectives of this project include the establishment of Vetiver Floating Wetlands (VFWs) in selected Coimbatore lakes, the evaluation of their efficiency in enhancing water quality, and the assessment of the cost-effectiveness of VFW technology for lake eco-restoration.
The majority of the wetlands are hydrologically linked to the River Noyyal. Key urban wetlands include Narsampathi, Krishnampathi, Selvampathy, Kumarasamy, Selvachintamani, Ukkadam Big Tank, Valankulam, Singanallur, Kuruchi Kulam, and Perur Lake.
Table 15.16Prominent Wetlands in Coimbatore LPA
Wetland
Location / Area
Features
Ecological & Socio-economic Significance
15.3.1.5Groundwater Status & Extraction
This Map 15.6 illustrates the spatial distribution of groundwater resources within the Coimbatore Local Planning Area (LPA), including current water table depths, extraction trends, and aquifer health.
Table 15.19Key Observations of Ground Water Status
Zone Type
Locations
Condition
Planning Priority
Critically Stressed
Sulur, Singanallur, Ondipudur, Peelamedu
Over 100% extraction, falling water table
Strict regulation, recharge enforcement
Moderately Stressed
Kuniyamuthur, Perur, parts of North Coimbatore
Mixed recharge-use balance
Moderate interventions, expand green cover.
Safe/Recharge Zones
Anaikatti, Booluvampatti, Thondamuthur Hills
Natural recharge, forested slopes
Ecological preservation, zero construction policy
Map 15.6: Ground Water Status (Firka-wise) map
FIRKA WISE GROUND WATER STATUS
Table 15.20Ground Water Extraction Summary
Extraction Status
Key Blocks / Areas
Extraction Level
Key Characteristics
Recommendations
Safe
Thondamuthur, Sultanpet, Annur
< 70% of recharge
Good aquifer health, low urban/agro stress, proximity to forested recharge zones
Preserve recharge zones; promote low-impact development; integrate green infrastructure
15.3.1.7Water Resources Management
Coimbatore’s water supply relies on sources like the Siruvani and Pillur schemes, maintained by the corporation. However, the increasing water demand necessitates a strategic approach to water resources management. The aim is to provide a comprehensive framework for sustainable development, ensuring a balance between urban expansion and environmental preservation, particularly concerning water resources.
Effective resource management utility can also be derived from the Comprehensive Mobility Plan (CMP) 2023, which implicitly relates to efficient use of resources, including water for sustainable urban transport. It also emphasises ecological balance and environmental stewardship through sustainable land use practices and the conservation of natural resources, including water bodies. The Smart Water Future India (SWF India) project aims to develop a smart, sustainable water management strategy for Coimbatore, addressing water supply, wastewater management, rainwater harvesting, and groundwater management.
Recommendations and proposals for enhancing Coimbatore’s lakes include eco-restoration and biodiversity conservation through desilting, afforestation, and wetland conservation, as well as community involvement and awareness. The water resources management strategy should focus on enhancing the city’s absorbency through blue and green infrastructure to reduce pollution, respond to climate change, and improve water quality. This involves a hierarchical approach from the LPA region to the neighbourhood level, integrating solutions like permeable pavements, bio-retention, and constructed wetlands.
In Tamil Nadu, conservative zones for water bodies, including canals, lakes, and rivers, are mandated for self-certified buildings.
15.3.1.8Hydrology
The hydrological system of Coimbatore is defined by the Noyyal River and a network of interconnected lakes, tanks, and wetlands. Water flows naturally from the western highlands to the eastern lowlands, supporting groundwater recharge and flood mitigation. Urban expansion has impacted natural drainage, making the restoration and protection of these water bodies a key focus for sustainable urban management.
Table 15.23Hydrology Analysis
Hydrological Feature
Key Areas / Examples
Characteristics
Significance
Planning Highlights
Main River
Noyyal River
- Originates in the Vellingiri Hills (Western Ghats) - Seasonal, but central to the drainage system
- Lifeline river system - Feeds 28 urban and peri-urban wetlands - Critical for recharge and flood drainage
- Desilt and realign drainage channels - Prevent effluent discharge into tributaries
Tributaries / Urban Streams
Sanganur Pallam, Kousika River, Perur Stream
- Carry runoff from hills and urban zones - Heavily encroached and polluted
- Recharge feeders - Natural storm water routes
- Restore as urban waterways - Implement filtration strips and storm drains - Convert into bio-retention zones
- Defined based on topography and flow channels - Some overlap with ward boundaries
- Important for localized water harvesting and zoning
15.3.1.9Micro Watershed
The Coimbatore LPA is organized into several microwatershed units, each characterized by distinct topography and drainage patterns. These micro-watersheds play a crucial role in local water harvesting, aquifer recharge, and flood control. Planning efforts emphasize the restoration of hydrological connectivity and the integration of watershed management into urban development strategies to enhance resilience and sustainability.
Table 15.26Micro-Watershed Analysis of Coimbatore LPA
Watershed Region
Geographic Spread
Watershed Characteristics
Hydro-Ecological Significance
Key Planning Insights
Western Hill-fed Units (Anaikatti, Thonda-muthur, Marudha-malai)
Overlay industrial zones with rain gardens; introduce green roof mandates and STP reuse systems
Northern Peripheral Units (Annur, Somanur)
Fringe areas with agriculture
Traditional canal-fed watershed alignments
Stable recharge zones for agri-based livelihoods
Conserve traditional ponds; support small check dams and peri-urban farming corridors
15.4.1Urban Heat Island (UHI) Effect
The Coimbatore LPA, like many urban areas, experiences the Urban Heat Island (UHI) effect, where urban areas record significantly higher temperatures compared to surrounding rural regions. This phenomenon is driven by human activities, extensive built environments, and limited green spaces, leading to intensified heat levels. Studies have analysed Land Surface Temperature (LST) trends in Tamil Nadu, including Coimbatore, over the past two decades (2003-2023) to understand the impact of urbanisation and climate change on temperature patterns. The loss of vegetation and increase in impermeable surfaces within the expanding city contribute to rising temperatures and humidity, thereby exacerbating the UHI effect. This intensified heat impacts public health, increases energy demand for cooling, and reduces overall urban comfort.
As outlined in the Urban Heat Island Hotspot Analysis and Mitigation Strategies for Tamil Nadu report by the State Planning Commission of Tamil Nadu Government, Coimbatore is increasingly affected by the Urban Heat Island (UHI) phenomenon, despite its proximity to the Western Ghats. Rapid urbanization, infrastructure expansion, high population density, and vehicular emissions have significantly contributed to rising temperatures and intensifying heat stress in the city.
Coimbatore’s tropical climate makes it particularly vulnerable to prolonged heatwave conditions. Studies indicate a steady rise in Land Surface Temperature (LST), with levels surpassing 3 6 ° C in 2023. The city’s expanding urban footprint, coupled with a decline in green cover, has intensified localized heating, leading to elevated ambient temperatures, particularly in densely built-up areas.
The Coimbatore Local Planning Area (LPA) experiences a significant Urban Heat Island (UHI) effect — a phenomenon where urban zones record higher temperatures compared to surrounding rural areas.
This is largely attributed to:
Extensive built-up areas with heat-retaining materials (e.g., asphalt, concrete).
• Reduction in green cover due to urban expansion.
• Increased vehicular emissions and industrial activity.
Low albedo surfaces and lack of vegetative shading.
Table 15.33Mean Land Surface Temperature (LST) for Coimbatore Agglomeration
15.3.2Environmental Management
Environmental management is a cornerstone of sustainable urban development, particularly in rapidly growing regions like the Coimbatore Local Planning Area (LPA). It encompasses the systematic planning, implementation, and monitoring of policies and practices aimed at conserving natural resources, mitigating pollution, and enhancing ecosystem resilience. Environmental management holds heightened importance due to the region’s unique ecological assets-such as its proximity to the Western Ghats, diverse water bodies, and extensive green cover-which are increasingly threatened by urbanization, industrial expansion, and resource pressures.
Map 15.11: Micro Watershed map
The Master Plan integrates environmental considerations at every stage, including urban forestry, lake restoration, waste management, and climate adaptation measures, ensuring that development aligns with both ecological sustainability and regulatory compliance. This integrated approach not only addresses immediate challenges like air and water pollution, waste accumulation, and habitat degradation, but also supports long-term goals of climate resilience, public health, and enhanced quality of life for Coimbatore’s residents. By embedding robust environmental management strategies into the urban planning framework, the Coimbatore LPA aims to set a benchmark for green, resilient, and inclusive urban growth in southern India.
15.3.2.1 Urban Forestry
The Ministry of Housing and Urban Affairs (MoHUA) has launched the Climate SMART Cities Assessment Framework (SCAF) to promote holistic, climate-responsive urban development. This framework provides a structured approach for cities to effectively mitigate and adapt to climate change while planning their investments and urban strategies.
As part of this initiative, the Smart City Project in Coimbatore follows a five-stage approach, with the first stage, “Adoption Programme for Parks and Gardens,” initiated in 2022. Under this program, the Miyawaki Urban Forestry method has been successfully implemented in parks and vacant lands across the Coimbatore City Municipal Corporation (CCMC). This effort, in collaboration with NGOs and organizations across different city zones, aims to enhance green cover and contribute to urban sustainability. The following table provides details on the number of trees planted and the total plantation area under this initiative
15.4.3Green House Gas Emission
A key component of Coimbatore’s climate action strategy that is covered by ‘Coimbatore Climate Resilient City Action Plan’ (CCRCAP) formulated in collaboration with the Government of Tamil Nadu and CCMC by ICLEI, SDC and National Institute of Urban Affairs (NIUA) plays a vital role in shaping the city’s future greenhouse gas (GHG) emissions trajectory. This approach allows for the development and evaluation of multiple pathways to identify the most effective emissions reduction strategies. By mapping these trajectories, the city can establish clear and measurable targets, assess potential GHG emissions levels, and ensure alignment with its long-term sustainability goals.
The ultimate objective of this strategy is to create a comprehensive roadmap that defines the required ambition levels and specific climate actions necessary to achieve netzero emissions. By integrating scenario planning into decisionmaking, Coimbatore aims to implement targeted mitigation measures that drive a sustainable, low-carbon future.
Coimbatore has prepared a Greenhouse Gas (GHG) emissions inventory for the period 2017-18 to 2021-22, with the baseline year set as 2021-22. This inventory follows the Global Protocol for Community Scale GHG Emissions (GPC) and covers Scope 1, Scope 2, and Scope 3 emissions from various sectors.
Key findings include:
Energy consumption: In 2021-22, stationary units accounted for the largest energy use at 21.74 Million GJ, followed by residential buildings at 7.96 Million GJ.
GHG emissions: In 2021-22, stationary units were also the highest contributors to GHG emissions at 3.25 Million tonnes of CO2 emissions. While electricity accounts for 47.9% of the energy mix, it contributes to 72.6% of the GHG emissions, largely due to India’s GHG intensive thermal power-based generation system.
Sectoral contributions: Transport accounted for 23.8% of total energy consumption and 12.2% of total GHG emissions.
Trend: An observed decline in overall GHG emissions in the industrial sector in Coimbatore can be attributed to the relocation of red-category industries as per the National Clean Air Program (NCAP) Action Plan.
Establishing this baseline is crucial for setting reduction targets and devising evidence-based mitigation strategies across different sectors to achieve net-zero emissions by 2070, aligning with India’s national commitment.
Table 15.36Sector Wise Net-Zero Climate-Resilient Action Plan
15.4.4Climate Change Analysis
Climate change presents an unprecedented global challenge, with temperatures rising 1.1°C above pre-industrial levels, triggering intensified weather extremes worldwide.
Coimbatore Local Planning Area (LPA) faces significant climate challenges as it transitions toward its vision of becoming a climate-resilient hub by 2070. Located in the rain shadow of the Western Ghats with distinctive topographical variations, the region experiences unique climate vulnerabilities that affect both urban and peri-urban areas.
Negative Attributes:
74% of the city experiences temperatures exceeding 32°C with urban heat islands forming along key corridors.
Water systems show vulnerability with 113% groundwater exploitation and projected 18-24% supply reduction by 2050.
Urban flooding affects 31 hotspots impacting 6.14% of slum populations.
Industrial productivity, particularly in textiles, decreases 12-15% during extreme heat events.
15.4.2UHIE Mitigation Measures
Mitigating the UHI effect in Coimbatore LPA requires a multi-pronged approach focusing on increasing green cover, promoting cool materials, and improving urban design.
Key strategies include:
Urban Greening: Extending the sponge city approach to other parks within the Coimbatore LPA based on their hierarchy. Implementing Miyawaki urban forestry in Open Space Reservations (OSRs) and parks in areas lacking green cover to combat rising temperatures due to climate change. Developing vertical/rooftop gardens in residential, commercial, educational, community, and office buildings across areas like Saibaba Colony,
Gandhipuram, and Peelamedu. Utilising reserved sites as per Tamil Nadu CMDA Open Space Reservation requirements for developing green spaces.
• Cool Roofs and Surfaces: Encouraging the adoption of energy-efficient building materials and green building principles.
Water Body Management: Eco-restoration of lakes such as Selvachintamani Lake and Periyakulam Lake, and interventions for Valankulam Lake, as model development propositions to be included in the Coimbatore Master Plan 2041. Developing Coimbatore as a resilient “sponge city” through blue and green infrastructure, including the creation of sponge parks wherever feasible.
Green Buffers: Providing green buffer zones in old burial grounds now converted to crematoriums in the city and town panchayats.
These measures will help reduce land surface temperatures, improve thermal comfort, and enhance the overall environmental quality of the Coimbatore LPA.
15.4.2.1 Land Surface Temperature (LST)
The State Planning Commission’s assessment of night-time Land Surface Temperature (LST) trends and identification of Urban Heat Island (UHI) hotspots in Coimbatore City based on critical parameters, including population density, coastal proximity, night-time mean LST, and the percentage change in high-temperature zones.
Areas with higher population density tend to retain more heat due to extensive built-up surfaces and anthropogenic emissions, while inland regions experience reduced cooling effects compared to coastal areas. The spatial expansion of high-temperature zones over time underscores the worsening UHI effect, necessitating targeted mitigation strategies such as urban greening, climateresponsive infrastructure, and sustainable urban planning to effectively address night-time heat stress in Coimbatore.
Analysis of night-time Land Surface Temperature patterns across Coimbatore provides crucial insights into the spatial distribution and intensity of the UHI effect. Hotspots identified through LST analysis, particularly during night time, indicate areas where heat is retained longer, posing significant implications for health and energy consumption.
Historical eight-tank system offers potential for naturebased solutions to heat and flooding.
International partnerships provide frameworks for knowledge exchange and climate finance.
• High solar potential (5.5-6.0 kWh/m²/day) creates renewable energy opportunities.
Diverse ecological zones preserve traditional adaptation practices applicable to modern resilience strategies.
Table 15.40Climate Vision and Strategic Context
Strategic Aspect
Current Status
Enhanced Regional Context
Vision Statement
Committed to becoming a climate-resilient hub by 2070
Positioned as Western Tamil Nadu's first comprehensive climate-resilient urban region integrating both urban core and peri-urban areas
Policy Integration
Aligned with Paris Agreement and Tamil Nadu SAPCC
Enhanced coordination between CCMC and surrounding panchayats for unified climate action across administrative boundaries
International Partnerships
Participation in 'CapaCITIES' project (Swiss Agency for Development and Cooperation)
Potential for expansion to include South-South climate cooperation with similarly situated textile/industrial centres in Global South
Implemen-tation Approach
Focus on climate hazard resilience and adaptation strategies
Multi-scalar implementation framework spanning micro (ward), meso (zonal) and macro (LPA) levels with tailored intervention packages
Source: Tamil Nadu's State Action Plan on Climate Change (SAPCC)
15.4.4.1Climate Risk
A comprehensive Climate Risk and Vulnerability Assessment (CRVA) has been conducted for Coimbatore city using the ‘Net Zero Climate Resilient CITIES’ methodology. This assessment analysed historical weather data (1981-2022), future climate projections (up to 2070 from SAPCC, IIT Madras, and ENVIS studies), and vulnerability data collected from local departments, along with spatial analyses and stakeholder discussions. The IPCC’s climate risk framework, evaluating heat risks through observed and projected heat extremes, exposure mapping (including urban heat islands), and socio-economic vulnerability mapping at the ward level, was followed. This localized approach helps identify when and where to take action and directs resources to the most vulnerable populations and areas.
The Intergovernmental Panel on Climate Change (IPCC) defines climate-related risks as the result of interactions between climate hazards, vulnerability, and exposure of human and natural systems. A comprehensive
assessment conducted by IIT Madras and ICLEI South Asia under the Coimbatore City Municipal Corporation (CCMC) framework has analysed climate risks and vulnerabilities affecting the city’s urban systems and population.
The climate change risk assessment for Coimbatore evaluates the potential negative consequences of climate hazards (like extreme heat, urban flooding, and air pollution) resulting from the interaction of these hazards with the exposure and vulnerability of urban systems and populations. This involves analysing the likelihood and potential consequences of climate impacts on critical urban infrastructure and communities.
Table 15.41Climate Change Risk Assessment
Assessment Component
Methodology
Coimbatore-Specific Application
Assessment Framework
IPCC climate risk framework using 'Net Zero Climate Resilient CITIES' methodology
Adapted to accommodate unique terrain diversity from Western Ghats foothills to eastern plains
Data Sources
Historical weather data (1981-2022), future climate projections (to 2070)
Incorporated localized data from Coimbatore AQI monitoring network and 12 AWS stations across LPA region
Analytical Approach
Heat risk analysis through observed and projected heat extremes, UHI mapping, socioeconomic vulnerability assessment
15.4.4.2Climate Trends And Projections
Coimbatore Local Planning Area (LPA) is witnessing notable changes in climate patterns, with government data indicating a steady rise in both temperature and rainfall variability. According to the Indian Meteorological Department (IMD), the region recorded its highest annual mean temperature anomaly in 2024, continuing a warming trend observed over the past decade. Projections from the Tamil Nadu State
Climate Change Cell and IMD suggest that, compared to the late 20th century, average maximum and minimum temperatures in Coimbatore are likely to increase by over 1 ° C by the 2020s and could exceed 2 - 3 ° C by mid- to latecentury. Rainfall trends in the LPA show increasing variability, with more frequent high-intensity precipitation events and extended dry spells, heightening risks of urban flooding and water stress. These climate trends and projections, as documented by Indian government agencies and state-level studies, highlight the growing need for adaptive measures to address heatwaves, water resource challenges, and climateinduced urban vulnerabilities in Coimbatore.
Table 15.42Climate Change Parameters and Projections
Climate Parameter
Historical Trend (1981-2022)
Future Projection (by 2070)
LPA-Specific Implications
Temperature
Warming at 0.014°C per decade
Maximum temperatures: +1.3°C to +3.1°CMinimum temperatures: +1.2°C to +3.3°C
Intensified urban-rural temperature gradient with 3.5-4.2°C differential between CBD and peripheral areas
Thermal Comfort
Baseline of 107 “thermal discomfort” days annually (1985-2014)
Projected increase to 150 days per year by 2050
Impact on industrial worker productivity estimated at 12-15% reduction during peak summer months
Rainfall Pattern
Slight decline in annual rainfall with increased irregular precipitation
Annual rainfall increase of 1.5% to 6% by 2050 with more short-duration, high-intensity events
Eastern LPA zones (Sulur, Kalapatti) projected to experience 22% higher flash flood risk than western zones
Urban Heat Island
15.4.4.3Climate Vulnerability Assessment
The vulnerability assessment identifies urban systems (such as water supply, wastewater management, solid waste management, and transport) and populations that are most susceptible to the adverse impacts of climate change in Coimbatore. For instance, wards experiencing both high urban heat and water supply complaints are identified as particularly vulnerable. Similarly, areas prone to waterlogging and with high instances of solid waste dumping are highlighted for their vulnerability to urban heat and flooding. Accessibility to emergency services during climate disasters is also a key aspect of vulnerability assessment.
Table 15.43Vulnerability Profile of Coimbatore LPA
Climate Hazard
Vulnerable Areas
Affected Populations/ Assets
Enhanced Vulnerability Context
Urban Heat Island (UHIE)
Wards 3-12, 19-28, Peelamedu, RS Puram
74% of the city faces LST ≥ 32°C, high morbidity risk
Concentrated in high-density commercial corridors with albedo values below 0.3; critical for 64,500 elderly residents
Urban Flooding
Lanka Corner, Kuniyamuthur, Muthusamy Colony
31 hotspots, 6.14% slum population directly impacted
Flash flood vulnerability exacerbated by 42% reduction in natural drainage pathways since 2000; 14 critical infrastructure nodes at risk
Seven industrial clusters contributing to three persistent air quality non-attainment zones; vulnerable populations include 42,000 textile workers
15.4.4.4Consolidated Climate Vulnerable Hotspots
Based on the climate risk and vulnerability assessment, several consolidated vulnerable hotspots have been identified in Coimbatore. These are areas and populations facing a high degree of risk due to the convergence of climate hazards and fragile urban systems. Critical wards impacted by climate hazards and issues with water supply, wastewater, solid waste management, and transport have been mapped, along with the population impacted in these areas. Identifying these hotspots allows for targeted interventions and resource allocation to enhance resilience where it is most needed.
The consolidated urban systems vulnerability hotspot map for Coimbatore highlights the impact of extreme heat and flooding across its 100 wards.
Table 15.46Wards and Population Impacted by Climate Hazards
Criticality
Ward Numbers along with fragile urban systems
Population Impacted
Total Population impacted with respect to the total population (%)
Extreme (Critical wards with four and more urban fragile systems)
Ward 28 (WS, T, D, H) - Ward 87 (WS, T, D, H)
71,896
3.14%
High (Critical wards with three urban fragile systems)
Note: WS - Water Supply; WQ - Water Quality; WW - Wastewater; SWM - Solid Waste Management; T - Transpor
Note: WS - Water Supply; WQ - Water Quality; WW - Wastewater; SWM - Solid Waste Management; T - Transpor
15.4.5Resilience Implementation Strategies
Table 15.49Resilience Implementation Strategies for Coimbatore LPA
Strategic Pillar
Key Actions
Coimbatore LPA Specific Context
Effective Governance
- Establish Coimbatore Metropolitan Climate Council integrating LPA regions - Climate Cell in CCMC with a Nodal Officer and departmental climate leads - Allocate 5% of municipal development charges to Climate Resilience Fund - Set up High-Powered Steering Committee involving PSG, SACON, industries - Climate-responsive budgeting in CCMC
- Climate Council to cover 65 wards + surrounding peri-urban panchayats - 36 smart climate monitoring nodes proposed across LPA zones - Dedicated climate budget anticipated to mobilize ₹200 crore by 2030
Urban Land Use Policy Alignment
- Climate-resilient zoning in LPA 2041 Land Use Plan - Mandate EV charging nodes every 2 km along arterial roads - Green infrastructure zones for wetland buffers - Retrofitting permeable pavements in 30% of built-up areas prone to UHI - Integration of Nature-based Solutions (NbS) in 100% new layouts
- EV readiness for ~4,200 charging points by 2041 - Wetlands mapped: Singanallur Lake, Valankulam, Periyakulam - 22% area designated for green infrastructure under proposed zoning
Strengthening Data Collection & Management
- Adopt Climate Data Policy for Coimbatore LPA - Real-time GHG, water use, AQI monitoring at ward level - High-resolution climate vulnerability mapping (0.5 km² grids) - Integrate BISAG, ICCC datasets for predictive modelling - Quarterly resilience performance audits at city and zonal levels
- 12 Automatic Weather Stations (AWS) operational across LPA - 100% wards to have climate risk profiles by 2026 - Target to reduce data latency from 90 days to 15 days for critical indicators
Supporting Priority Climate Action
- Green Public Procurement Policy for CCMC and ULBs - Climate literacy programs reaching 3 lakh residents by 2030 - Expand EV adoption to 25% of all vehicles by 2041 - Launch Climate Innovation Challenge with local startups - Green Bond issuance targeting ₹500 crore for resilience projects
- Urban Greening: 1 million trees by 2030 (5x increase from 2021 baseline) - Water resilience: 150 new RWH systems planned for public buildings - Target reduction of GHG emissions by 15% by 2030 (base year2020)
15.5Pollution
The Master Plan identifies air pollution, water pollution, and noise pollution as key environmental concerns in the Coimbatore Local Planning Area (LPA). According to the Tamil Nadu Pollution Control Board (TNPCB), the main sources of pollution in Coimbatore include:
Effluent Discharges: Industries, particularly in sectors such as textiles, dyeing, and foundries, contribute significantly to water pollution. Effluents with high Total Dissolved Solids (TDS), chlorides, and hardness have been detected in groundwater near industrial areas like Sulur Taluk, despite the presence of effluent treatment plants.
Air Emissions: Industrial emissions are a major source of air pollution. The TNPCB monitors emissions from industries using continuous air quality monitoring systems connected to the CARE AIR Centre.
Vehicular Emissions: Vehicular pollution is a critical issue due to Coimbatore’s growing urbanization and increasing traffic density. Vehicles contribute to ground-level pollutants such as Suspended Particulate Matter (SPM), sulphur dioxide ( S O 2 ) , and nitrogen oxides ( N O 2 ) , which have a direct impact on ambient air quality.
Domestic and Municipal Waste: Untreated domestic sewage and municipal waste are significant contributors to water pollution in wetlands and lakes. For example, high TDS levels in surface water samples from Achchankulam Lake indicate contamination from municipal wastewater.
Solid Waste Management Issues: Improper disposal of solid waste leads to leachate generation, which contaminates both surface water bodies and groundwater. This is particularly evident in areas lacking adequate waste management infrastructure.
Agricultural Runoff: Runoff containing fertilizers and pesticides contributes to nutrient loading in water bodies, leading to eutrophication and degradation of aquatic ecosystems.
Noise Pollution: Urbanization and traffic growth have also led to increased noise pollution levels in residential and commercial zones.
These sources highlight the need for stringent monitoring, enforcement of pollution control measures, and sustainable urban planning to mitigate environmental degradation in Coimbatore.
Table 15.52Consolidated list of the major Environmental Pollution Acts of India.
Act / Rule
Year
Purpose / Focus
15.5.1Air Pollution
The Coimbatore Local Planning Area (LPA) faces escalating pollution challenges, driven by rapid urbanization, industrial growth (particularly textiles and manufacturing), and increasing population density. The disruption of traditional ecological balance, marked by encroachment on water bodies and loss of green cover, exacerbates these issues. Effective and integrated management of various pollution types is critical to ensure environmental sustainability, public health, and the overall quality of life within the region, aligning with the goals of the Coimbatore Master Plan 2041.
Air pollution in Coimbatore LPA is primarily attributed to vehicular emissions, industrial activities (textile mills, foundries, engineering units), construction dust, and road dust resuspension. Key pollutants of concern, exceeding National Ambient Air Quality Standards (NAAQS) in certain areas, include particulate matter (PM10 and PM2.5), nitrogen oxides (NOx), sulphur dioxide (SO2), carbon monoxide (CO), and ground-level ozone (O3). Specific industrial zones like Peelamedu and other areas with heavy traffic congestion often experience elevated pollutant levels.
Table 15.53Air Pollution Sources & Hotspots
Source
Key Pollutants
Hotspots
2023 Levels (µg/m³)
Vehicular emissions
PM2.5, NOx, CO
Avinashi Road, Gandhipuram Junction
PM2.5: 72
Textile industries
SO2, VOCs
SIDCO Industrial Estate
SO2: 19
Construction sites
PM10, Silica dust
Ramanathapuram, Vadavalli
PM10: 128
Waste burning
Dioxins, PM2.5
Vellalore dumpyard periphery
PM2.5: 84
Source: AQI.in, TNPCB
Figure 15.6: Ozone (O3) emissions in Coimbatore (2020 - 2025)
15.5.2Water Pollution
River and water body pollution due to sewage, improper waste management, and industrial discharge is a significant environmental challenge. The degradation of water resources has led to water scarcity, and the unscientific disposal of domestic and industrial waste into water bodies has contaminated both surface and groundwater. The Noyyal River is particularly affected by untreated industrial discharge from dyeing industries (containing surfactants
and heavy metals) and domestic sewage, has been leading to visible frothing. The Tamil Nadu Pollution Control Board (TNPCB) periodically monitors the city’s waterways under the MINARS program. The study by Priya et al. (2011) corroborates the degraded water quality of Coimbatore’s wetlands due to domestic and industrial sewage discharge. Ukkadam and Singanallur wetlands were found to have particularly poor water quality, unsuitable even for irrigation due to high sodium absorption ratio (SAR) and electrical conductivity.
Water pollution in Coimbatore LPA has become a critical issue due to rapid urbanization, industrial expansion, and poor waste management. Major water bodies, including the Noyyal River, Singanallur Lake, and Periyakulam, are severely impacted by untreated sewage, industrial effluents, agricultural runoff, and solid waste dumping. Untreated sewage from residential areas is directly discharged into canals like Sanganur Pallam, polluting groundwater and surface water. Industrial effluents, particularly from textile and chemical industries, release toxic chemicals into the Noyyal River, worsening water quality. Agricultural runoff from wetlands in Perur and Thondamuthur contributes to nitrate contamination, leading to algal blooms in water bodies. Additionally, solid waste dumping has degraded lakes like Periyakulam, while urban encroachments on water bodies such as Valankulam and Selvachinthamani have reduced their capacity to retain and filter water.
The Noyyal River exhibits severe contamination with BOD (28 mg/L) and COD (94 mg/L) downstream of industrial discharge points. Singanallur Lake shows heavy metal accumulation (Cr: 1.2 ppm, Pb: 0.8 ppm), while groundwater in Peelamedu has TDS levels exceeding 2,100 mg/L due to
leachate infiltration.
Table 15.59Water Quality Status (2023)
Water Body
Contaminants
Levels vs CPCB Norms
Primary Sources
15.4.4.5Climate Resilience Planning
Coimbatore’s approach to resilience planning represents a strategic integration of climate adaptation and mitigation measures tailored to the unique environmental challenges facing the Local Planning Area. As temperatures continue to rise at 0.014°C per decade (1981-2022) and urban heat islands intensify along key corridors, it is crucial to establish a comprehensive framework for transforming Coimbatore into a climate-resilient hub by 2070.
The resilience strategy addresses critical vulnerabilities identified through detailed climate risk assessments: 74% of the city experiences temperatures exceeding 32°C; 31 flood hotspots impact vulnerable populations; and water systems show vulnerability with 113% groundwater exploitation. These challenges are compounded by Coimbatore’s distinctive geography spanning Western Ghats foothills to eastern plains.
A multi-scalar implementation approach spanning micro (ward), meso (zonal), and macro (LPA) levels is essential. Priority interventions include blue-green infrastructure networks connecting the eight-tank system with urban watersheds, cool roof programs in highdensity commercial districts, and zone-specific rainwater
harvesting codes. For industrial zones, particularly the textile sector facing 12-15% productivity loss during heat waves, specialized adaptation measures include emission-zoned DCR overlays and worker cooling stations.
Governance innovations include a proposed Metropolitan Climate Council integrating all LPA administrative units and a dedicated climate resilience fund with multi-stakeholder participation. The resilience framework aligns with Tamil Nadu’s State Action Plan on Climate Change while establishing Coimbatore as Western Tamil Nadu’s pioneering climate-resilient urban region— balancing rapid development with ecological sustainability for current and future generations.
Interface zone between core city and IT corridor requiring transit-oriented microclimate management
15.5.3Noise Pollution
The report briefly mentions that noise pollution has a harmful impact on human and animal life, primarily caused by machinery and transport. Coimbatore LPA faces increasing noise pollution due to heavy vehicular traffic, industrial activities, construction, and commercial establishments. High noise levels, often exceeding permissible limits, are particularly prevalent in areas like Gandhipuram, Ukkadam, and Avinashi Road, where dense traffic and public transport hubs contribute significantly to the problem. Industrial zones such as SIDCO Industrial Estate and Peelamedu generate noise from machinery, while ongoing construction in areas like Saravanampatti adds to the overall pollution. The impact of this pollution is severe, leading to health issues such as stress, hearing impairment, and cardiovascular diseases, particularly affecting residents near high-noise areas like 100 Feet Road and Dr. Nanjappa Road.
Wildlife in the Coimbatore Forest Division, near Marudhamalai and Periyanaickenpalayam, is also disrupted due to increased urban noise, affecting animal behavior and migration patterns. Furthermore, excessive noise reduces productivity in workplaces and schools, making learning and concentration difficult in institutions located near busy roads. Noise levels in Coimbatore often exceed the prescribed limits, with commercial areas recording 75–80 dB and residential zones frequently surpassing 55 dB, violating regulatory guidelines set by the Tamil Nadu Pollution Control
Board (TNPCB). Night-time noise levels exceed CPCB limits (55 dB) by 18–22 dB in commercial zones. High-risk areas include Gandhipuram (78 dB) and L&T Bypass (72 dB) due to unmuffled engines and congested traffic. The 2023 noise mapping initiative identified 12 critical zones requiring acoustic barriers.
Table 15.61Noise Pollution Profile
Zone Type
Key Sources
dB Levels (Peak)
Compliance Gap
Commercial
Loudspeakers, traffic
78 dB
+23 dB
Industrial
Machinery, generators
68 dB
+13 dB
Residential
Night-time construction
62 dB
+7 dB
Source: TNPCB
Impacts Of Noise Pollution
15.5.4Land Pollution
The dumping of solid waste, particularly at the Vellalore landfill, and the discharge of untreated effluents onto land can lead to soil contamination and degradation. The presence of hazardous waste from industrial clusters like Kurichi, even if managed according to regulations, poses a potential risk to soil quality.
Soil degradation in Coimbatore LPA is driven by factors such as:
Industrial Contamination: Areas near industrial clusters such as the Kurichi Industrial Area, as identified by the TNPCB as a Critically Polluted Area, are vulnerable. Metal processing, foundries, and textile units contribute heavy metals and other chemical pollutants. TNPCB data indicates that improper disposal of industrial waste leads to soil degradation, impacting soil fertility and land use in adjacent areas.
Agricultural Practices: Overuse of chemical fertilizers and pesticides, though promoted by the Department of Agriculture, degrades soil quality over time and impacting long-term agricultural productivity. Reports from the Tamil Nadu Agricultural University (TNAU) show that intensive irrigation without proper drainage causes waterlogging and salinization, rendering agricultural land infertile, especially in areas dependent on tank irrigation.
Urban Waste Disposal: Unscientific disposal of municipal solid waste, a responsibility of the local municipal corporations, leads to soil contamination with pathogens and toxic substances. Leachate from landfills, monitored by the TNPCB under the Solid Waste Management Rules, pollutes surrounding soil and groundwater resources.
Soil Erosion: Deforestation and unsustainable land use practices, particularly in the Western Ghats regions within the LPA, contribute to soil erosion. The Forest Department data underscores that loss of topsoil reduces land fertility and increases sedimentation in water bodies.
Industrial sludge dumping in Kurichi (Pb: 145 mg/kg, Cd: 8.7 mg/kg) and excessive fertilizer use in Annur (NPK imbalance: 4:1:0.5) have degraded 12% of LPA’s arable land. Urban expansion caused a 9% loss of topsoil carbon stock (2015–2023).
Table 15.63Soil Health Indicators
Degradation Type
Causes
Affected Areas
Key Metrics
Heavy metal toxicity
Tannery effluent
SIDCO, Kurichi
15.5.5Light Pollution
Light pollution, though often overlooked, is an emerging environmental concern in Coimbatore’s rapidly urbanizing landscape. Excessive and misdirected artificial light can disrupt natural ecosystems, impact human health, and waste energy. Specific concerns in the Coimbatore LPA include:
Skyglow: Excessive artificial light illuminating the night sky, obscuring stars and celestial objects. This is prevalent in densely populated areas and industrial zones.
Glare: Excessive brightness causing visual discomfort and reduced visibility, particularly from poorly designed streetlights and building illumination.
Mitigation measures include adopting shielded lighting fixtures, using lower intensity lighting, implementing lighting curfews, and promoting dark sky-friendly lighting designs in new developments.
Unregulated LED billboards in CBD areas (RS Puram, DB Road) exceed 3,000 lumens/m², disrupting circadian rhythms. The 2024 sky glow assessment showed a 27% increase in light trespass zones, affecting nocturnal ecosystems in Marudamalai foothills.
Table 15.64Light Pollution Metrics
Source
Affected Areas
Lux Levels
Mitigation Needs
Commercial signage
Cross Cut Road
2,800 lux
Shielding, curfew hours
Street lighting
Avinashi Road
1,950 lux
Adaptive dimming systems
Sports complexes
CODISSIA Ground
3,200 lux
Directional lighting
Source: Coimbatore Smart City Mission
15.5.6Pollution Mitigation Measures
To comprehensively cover pollution mitigation strategies for the Coimbatore Master Plan, integrating insights from Indian government resources, Tamil Nadu state sources, and relevant studies, the following measures are proposed as below.
15.5.6.1 Water Pollution
Sponge City Initiatives: Implement Sponge City initiatives to enhance water absorption, reduce runoff, and filter pollutants, focusing on blue and green infrastructure. Rejuvenate lakes and streams with soft landscaping and bio-filtration, creating sponge parks that enhance water infiltration and pollutant removal, supported by the National Wetland Conservation Programme. Restore and maintain traditional lake interconnectivity systems to improve water flow and dilution capacity, mitigating the impact of sewage and industrial discharge.
Policy Interventions: Enforce mandatory separation of sewage and storm water drainage systems to prevent sewage contamination of water bodies. Promote the use of treated wastewater for non-critical applications (e.g., irrigation, industrial cooling) to reduce freshwater demand and pollution, aligning with the National Water Mission. Implement rainwater harvesting systems in all new buildings and incentivize existing buildings to adopt rainwater harvesting, enhancing groundwater recharge and reducing runoff.
Wastewater Management: Expand sewage treatment plant (STP) capacity to treat all domestic sewage generated in the city, adhering to TNPCB standards for effluent discharge. Ensure industries comply with zero-liquid discharge (ZLD) norms, particularly in the textile and foundry sectors, to prevent industrial effluent contamination of water bodies.
15.5.6.2 Solid Waste Pollution
Sustainable Solid Waste Management: Implement sustainable solid waste management strategies, including bio-mining of legacy waste, establishing Bio-CNG and Waste-to-Energy plants, expanding Material Recovery Facilities (MRFs), and implementing smart waste collection systems. Promote a circular economy by encouraging waste reduction, reuse, and recycling, aligning with the Swachh Bharat Mission. The goal is to move towards a zero-waste policy, reduce landfill dependency, and minimize leachate contamination of soil and groundwater.
Landfill Management: Implement scientific landfill management practices, including leachate collection and treatment, to prevent soil and groundwater contamination, adhering to the Solid Waste Management Rules, 2016 as monitored by the TNPCB. Explore options for converting waste to energy or other useful products to reduce landfill burden, in line with national waste management policies.
15.5.7Ecosystem Services Assessment
Ecosystem Services Assessment and Pollution Mitigation in Coimbatore LPA
To comprehensively address pollution mitigation in the Coimbatore Local Planning Area (LPA), it is essential to integrate an ecosystem services assessment. Ecosystem services are the benefits that humans derive from ecosystems, including provisioning services (e.g., water, food), regulating services (e.g., air and water purification, climate regulation), supporting services (e.g., nutrient cycling, soil formation), and cultural services (e.g., recreation, aesthetic value).
Table 15.66Ecosystem Services Framework
Ecosystem Service
Regional Significance
Mitigation Strategy
Implementation Mechanism
Quantitative Benefits
Water Purification
Wetlands, lakes, and 12 critical water bodies filter pollutants
Wetland restoration with native vegetation; Riparian buffers
National Wetland Conservation Programme; Lake Management Committees
Potential 30-40% improvement in BOD/COD levels in restored water bodies; Singanallur Lake case study shows reduction in eutrophication
Flood Regulation
Natural areas absorb excess water; 31 flood hotspots identified
Riparian buffer zones; Permeable surfaces in urban watersheds
Noyyal & Kaushika riverfront development; Stormwater management zones
Capacity to absorb 40-60mm/hr precipitation in restored wetlands; ~15% reduction in peak flood levels
Air Quality Regulation
Green spaces absorb pollutants; SIDCO Estate, Peelamedu are pollution hotspots
Urban forestry; Green infrastructure on buildings
National Afforestation Programme; TNPCB monitoring network
1 hectare urban forest can capture ~10 tons CO₂/year; Projected 15% PM2.5 reduction in greened corridors
Climate Regulation
Forests mitigate urban heat islands affecting 74% of city area
Miyawaki afforestation in degraded urban lands; Cool roof programs
National Mission for Green India; Metropolitan Climate Council
Mini-forests reduce ambient temperature by 2-4°C; Carbon sequestration of 1,000+ tons annually
15.6.1Fault Line Mitigation
The presence of this fault line elevates the probability of seismic activity, ground movement, and structural instability in the region. Given the dense urbanization, critical infrastructure, and industrial hubs along this corridor, adopting comprehensive seismic mitigation strategies is imperative. These strategies must encompass seismicresistant construction practices, enforcement of stringent building regulations, strategic land-use planning, and robust emergency preparedness measures to enhance safety, resilience, and long-term sustainability.
Map 15.14: Seismic Zone map
SEISMIC ZONE AND FAULT LINE MAP
Coimbatore Local Planning Area (LPA) is situated in Seismic Zones II (Low Risk) and III (Moderate Risk) as per the Bureau of Indian Standards (BIS) seismic zoning map (IS 1893:2016). The region’s proximity to the Neotectonic Fault Zone (Western Ghats foothills) and historical seismic activity necessitate stringent mitigation strategies.
Mitigation Measures:
Land-Use Zoning: Restrict high-density developments within 500m of active fault lines (e.g., Marudamalai, Anaikatti hills).
Building Codes: Mandate compliance with IS 1893 for new constructions, especially in Zone III areas (Peelamedu, Gandhipuram).
Structural Audits: Retrofit critical infrastructure (hospitals, schools) as per NDMA guidelines.
Regulatory Compliance:
TNPCB: Monitors industrial units in seismic zones for structural stability.
Hill Area Conservation Authority (HACA): Restricts development in ecologically sensitive villages near fault zones (e.g., Thondamuthur, Vellakinar).
Source: BIS Seismic Zoning Map, Tamil Nadu SDMA Risk Zones, NDMA Guidelines
15.6.2Seismic-Resistant Building Codes
Applicable IS Codes:
IS 1893 (Part 1):2016: Earthquake-resistant design for structures.
IS 13920:2016: Ductile detailing of reinforced concrete structures.
IS 4326:2013: Earthquake-resistant construction for masonry buildings.
IS 13828:1993: Improving earthquake resistance of earthen buildings.
Urban centers with high population density and commercial activity are particularly susceptible to structural damage during seismic events. To ensure structural stability, buildings must strictly adhere to IS 1893:2016 (Indian
Seismic Code) and NBC 2016 (National Building Code).
Foundation Strengthening: In soft-soil regions like Ukkadam and Singanallur, adopting raft or pile foundations is crucial to prevent differential settlement and enhance load-bearing capacity.
Base Isolation Systems: Hospitals, emergency response centers, and government buildings in Gandhipuram and Townhall must integrate seismic base isolators and dampers to absorb vibrations and reduce seismic impact.
Ductile Reinforced Concrete (RC) Frames: New constructions in fault-prone zones should incorporate ductile RC frames with flexible joints to improve shock resistance.
Building Height Regulations: To minimize risks of collapse, high-rise constructions along the fault corridor must adhere to strict height restrictions and comply with earthquake-resistant design principles.
15.6.3Structural Reinforcements For Industrial & Commercial Zones
As industrial and commercial zones house manufacturing units, IT parks, and business hubs and structural resilience is essential to minimize economic losses and ensure workforce safety.
Shear Walls & Braced Frames: Essential for factories and manufacturing industries in Peelamedu and Ganapathy to enhance lateral stability and resist seismic forces.
Seismic Expansion Joints: Large commercial structures along Avinashi Road and Mettupalayam Road must integrate expansion joints to mitigate stress concentration and prevent structural failure.
Retrofitting of Older Buildings: Aging structures in R.S. Puram and Race Course require reinforcement with steel jacketing, fiber-reinforced polymer (FRP) wraps, and advanced retrofitting techniques to improve durability.
Ground Stabilization Techniques: In areas prone to soil liquefaction such as Ondipudur and Chinniampalayam, implementing grouting, deep soil mixing.
15.6.4Land-Use Planning For Areas With Fault Line Proximity
Effective urban planning and zoning are critical for minimizing seismic risks in areas adjacent to the fault line. Strategic interventions include:
Buffer Zones with Green Cover: Establishing tree belts and green buffer zones in Chinnathadagam and Veerapandi can reduce environmental stress and act as protective barriers against soil erosion.
Restricted Development in High-Risk Zones: Essential public infrastructure, such as schools, hospitals, and emergency service centers, should be strategically located away from seismically active zones like Thudiyalur and Kadampadi.
Seismic Micro zonation mapping: Conducting soil stability and seismic vulnerability assessments across construction zones ensures location-specific building codes and risk-based development planning.
Strict Compliance & Periodic Audits: Municipal authorities must enforce regular building inspections in residential and commercial zones, particularly in Saibaba Colony and Ramanathapuram, to ensure adherence to seismic safety norms.
15.6.6Institutional Framework For Disaster Management
National Disaster Management Authority (NDMA): Guides retrofitting of lifeline structures (bridges, power plants).
Tamil Nadu State Disaster Management Authority (TNSDMA): Implements seismic risk reduction programs.
District Disaster Management Authority (DDMA): Oversees overall planning, response, and recovery efforts.
• Municipal Emergency Operations Centre (EOC): Functions as the nerve center for real-time monitoring and disaster response.
Building Materials & Technology Promotion Council (BMTPC): Trains masons/engineers in earthquakeresistant techniques.
Nodal Agencies for Specific Hazards:
Public Works Department (PWD) for flood control Tamil Nadu Pollution Control Board (TNPCB) for industrial hazards Geological experts for seismic activity monitoring Health and sanitation departments for epidemic control
15.6.7Emergency Preparedness And Mitigation Measures
Disaster preparedness includes retrofitting critical infrastructure, enforcing building codes, and establishing seismic monitoring stations to mitigate earthquake risks. For flood control, storm water management, wetland conservation, and early warning systems are essential. Drought resilience can be achieved through water conservation strategies, efficient irrigation methods, and sustainable groundwater recharge. Industrial and fire hazards can be managed by ensuring compliance with safety norms, conducting fire safety drills, and strengthening firstresponder capacities.
An effective emergency response plan involves setting up evacuation shelters, deploying rapid response teams, and conducting public awareness campaigns to educate citizens about disaster preparedness. Community participation is key, with initiatives like Community Disaster Response Teams (CDRTs), school safety programs, and NGO collaborations playing a vital role in disaster mitigation. Post-disaster recovery will focus on rebuilding sustainable infrastructure, financial aid for affected families, and longterm rehabilitation programs to restore livelihoods and ensure social resilience.
In addition to structural interventions, disaster preparedness plays a pivotal role in mitigating seismic hazards. A well-coordinated emergency response framework should include:
Evacuation Routes & Emergency Shelters: Pre-identified safe zones near Gandhipuram Bus Stand, Ukkadam Lake, and Peelamedu Airport to facilitate efficient evacuation.
Seismic Early Warning Systems: Deployment of real-time earthquake monitoring stations in high-density areas like Saibaba Colony and R.S. Puram for prompt alerts and risk assessment.
Public Awareness & Earthquake Drills: Conducting regular safety training, simulation exercises, and awareness campaigns in Singanallur, Saravanampatti, and Sundarapuram to educate residents and businesses.
Resilient Transport Infrastructure: Ensuring seismicresistant design for bridges, flyovers, and highways along Avinashi Road and Pollachi Main Road to maintain connectivity during emergencies.
15.6.5Hazard Identification & Risk Assessment
Earthquakes: Structural vulnerabilities exist in older buildings around Town Hall, Ukkadam, and Oppanakara Street, requiring retrofitting measures to withstand seismic activity.
Floods: Low-lying areas like Singanallur, Ukkadam, Peelamedu, and Ganapathy are prone to urban flooding due to poor drainage systems and heavy monsoons.
The Noyyal River floodplain poses additional risks, necessitating improved stormwater management and early warning systems.
Droughts: Water scarcity is a major concern due to irregular rainfall affecting Siruvani and Pillur reservoirs, impacting water supply in areas like Saibaba Colony, Vadavalli, and Thondamuthur. Rainwater harvesting and groundwater recharge projects must be prioritized in Kalapatti and Kurichi, where groundwater depletion is severe.
Industrial Hazards: Sidco Industrial Estate, Kurichi Industrial Area, and Peelamedu Industrial Zone house multiple chemical and textile industries, posing risks of fire accidents, toxic leaks, and pollution-related hazards. Strict adherence to fire safety norms, hazardous waste disposal regulations, and real-time monitoring systems is essential.
Urban Fires: Densely populated commercial hubs like Gandhipuram, Cross Cut Road, Oppanakara Street, and Town Hall are highly susceptible to fire outbreaks due to congested spaces and flammable materials. Enhancing fire safety audits, installing early warning systems, and improving emergency response times are crucial.
15.7Comprehensive Planning Recommendations
Comprehensive Planning Recommendations aimed at enhancing ecological integrity, environmental sustainability, climate resilience, pollution mitigation, and disaster preparedness through nature-based, communitycentric, and sustainable planning practices across the Local Planning Area. The following table presents strategic recommendations:
Table 15.68Comprehensive Planning Recommendations
Section
Key Recommendations
1. Ecology
• Enforce Hill Area Conservation Authority (HACA) guidelines and extend eco-sensitive zoning to critical forest-edge villages like Anaikatti and Boluvampatti. • Establish wildlife and green corridors to connect fragmented habitats within the LPA, enhancing biodiversity continuity. • Create Urban Biodiversity Registers (UBRs) and periodic ecological audits to inform policy decisions. • Restore degraded quarries and scrublands using native afforestation, rain gardens, and eco-parks
2. Environment
• Rejuvenate the city's lake and wetland systems (e.g., Ukkadam, Singanallur) through desilting, reed-bed plantation, buffer zoning, and eco-tourism linkages. • Integrate blue-green-grey infrastructure with storm water networks using bio swales, pervious pavements, and constructed wetlands. • Promote zero-waste precincts via decentralized bio-methanation, community composting, and waste valorisation. • Institutionalize urban forestry programmes targeting roadside medians, public campuses, and buffer parks. • (Groundwater Focus) Launch aquifer mapping and recharge enhancement using reverse wells, rain gardens, and percolation trenches in high-stress zones (Peelamedu, North Coimbatore).
3.ClimateChange
• Designate Urban Heat Island (UHI) zones and apply cool roofing, vertical gardens, and heat-resilient street design in hotspots. • Institutionalize the Climate Resilience Cell within CCMC to lead vulnerability assessments, CAP updates, and annual resilience reports. • Mandate rooftop solar and EV-charging integration in all public and large commercial buildings, aligned with Net-Zero goals. • Develop climate-responsive building norms using GRIHA and ECBC+ for large-format residential and mixed-use projects. • Promote nature-based climate adaptation solutions such as urban wetlands, shaded corridors, and reflective pavements.
Public Recreational and Educational Proposal
Lakes will be developed not only as ecological assets but also as community-centric public spaces that promote wellness, education, and culture. The development shall follow the
Table 15.72Recreation-with-Conservation model
Feature
Description
Walking and Cycling Tracks
Eco-friendly 2.5-3m wide periphery trails with permeable surfaces, shaded pathways, and solar lighting.
Children's Nature Park & Play Zones
Themed play areas integrated with landscape design using natural and eco-safe materials.
Bird-Watching Towers & Decks
Elevated platforms in biodiversity-sensitive zones for birdwatchers, students, and researchers.
Amphitheater or Open-Air Stage
Spaces for community gatherings, cultural performances, and environmental awareness events.
Yoga & Wellness Zones
Landscaped and peaceful zones for yoga, meditation, and wellness programs, open to all age groups.
Floating Gardens & Wetland Parks
Floating vegetated mats and peripheral wetland systems to filter water and support aquatic biodiversity.
Boating (Non-motorized)
Designated zones for eco-friendly, non-motorized boating where ecologically viable, e.g., Sulur Lake.
Rain Gardens & Butterfly Gardens
Thematic gardens that absorb storm water runoff, promote pollinators, and add to the visual appeal.
Figure 15.12: Visuals of proposed lakefront development
Public Engagement and Governance
• Formation of Lake Management Committees (LMCs) with representation from:
Local residents/RWAs
Urban Local Body officials
School/college eco-clubs
NGOs and environmental groups
Adopt-a-Lake Program: Corporates and institutions can support maintenance under CSR.
15.9.1Eco-Tourism Upgradation (Water Bodies, Forests, and Agrarian Areas)
Marudur Eco Park Proposal – Biodiversity Learning & Wetland Interpretation Park
The proposed Eco Park in Marudur envisions the development of a Biodiversity Learning and Wetland Interpretation Park rooted in the natural ecology of the region. Located near seasonal water bodies and agrarian landscapes, the site provides an ideal setting for a naturebased tourism hub.
Karamadai Eco Park Proposal – Forest Ecology & Community Interaction Park
The proposed Eco Park in Karamadai is envisioned as a Forest Ecology and Community Interaction Park, set against the backdrop of the Western Ghats foothills and nearby reserved forests. The park will serve as a green buffer and recreational space, promoting awareness of native biodiversity, forest ecosystems, and sustainable practices. Key features may include nature interpretation trails, native tree gardens, birdwatching zones, with active involvement from local communities in park management and ecotourism services.
Thenkarai Hillock Eco Park Proposal – Sacred Grove Revival & Hill Ecology Interpretation Zone
The Thenkarai Hillock Eco Park proposal focuses on conserving the unique hill ecology, promoting cultural heritage, and supporting low-impact eco-tourism. The proposal includes stone pathways will guide visitors to hilltop
viewpoints that offer panoramic views of the Coimbatore landscape and serve as quiet zones for meditation or yoga.
An eco-adventure zone with zip lines and rope bridges, designed in collaboration with safety experts, will offer outdoor activities for youth without disturbing natural contours. A community-led forest nursery and green livelihood centre will empower local residents through ecoentrepreneurship such as seed ball making, native plant sales, and tribal craft markets. The hillock will also serve as a climate observatory node with basic meteorological instruments for citizen science and environmental monitoring
15.9.1.1 Urban Green Cover Enhancement (Including Reserved Forest and Reserved Land)
Rejuvenation of Lakes
This proposal outlines a strategic initiative for the rejuvenation of twelve ecologically and hydrologically significant lakes and ponds within the Coimbatore Local Planning Area (LPA). These water bodies, which span both urban and peri-urban zones, play a crucial role in maintaining ecological balance, supporting groundwater recharge, and acting as natural buffers against urban flooding. Over the years, these lakes have suffered from various forms of degradation such as siltation, encroachment, wastewater inflow, and loss of biodiversity.
Each lake has been assessed based on its ecological value, current environmental challenges, and potential for public use. The table below summarizes the key attributes of the proposed rejuvenation plan, including nodal agencies, ecological importance, major environmental concerns, and suggested public recreational features.
Table 15.71List of Proposed Lakes for Rejuvenation in Coimbatore LPA
Sr. No.
Lake / Pond Name
Primary Nodal Agency
Ecological Importance
Environmental Issues
Proposed Public Recreational Features
1
Kolaram-pathy Lake
CCMC
Seasonal water source; supports local fauna
Siltation, waste dumping, bund encroachments
Walking path, bird-viewing deck, native tree garden
Ecological Sensitivity: Minimal hardscaping, use of native vegetation, preservation of natural gradients, and creation of riparian buffers.
Inclusivity & Accessibility: Universal design standards ensuring access for all age groups and abilities.
Low-impact Infrastructure: Use of permeable materials, solar lighting, decentralized utilities, and natural cooling through tree canopies.
Table 15.73Proposed Public Amenities & Features in River Front Development
Amenity Type
Description & Purpose
Pedestrian and Cycling Tracks
3–5 m wide greenways along both banks promoting non-motorized transport and wellness activities. Features include native shaded trees and solar-powered lighting.
Plazas and Riverfront Squares
Landscaped public gathering zones at key nodes (e.g., Perur, Sundakkamuthur, Kovilpalayam) with seating, vending kiosks, and cultural/art installations.
Community Amphitheatres
Open-air performance spaces set in natural terrain for cultural programs, community events, and traditional performances.
Eco-learning and Interpretation Zones
Information kiosks and signage illustrating river ecology, biodiversity, water cycles, and cultural heritage in Tamil and English.
Children’s Nature Parks
Eco-friendly play areas with interactive, sensory elements, water features, and educational themes for early environmental engagement.
Yoga and Wellness Decks
Quiet, green platforms for yoga, tai chi, and meditation, especially in calm zones like Kaushika and Sanganoor tributaries.
Rain Gardens and Bio-swales
Landscaped drainage gardens with native plants for filtering urban runoff and improving aesthetics while managing storm water.
Floating Gardens & Wetlands
Vegetated floating islands in wider river stretches (e.g., Noyyal near Singanallur) that improve water quality and support avian life.
Boating and Nature Trails
Non-motorized boating zones and interpretive nature trails with resting points and educational markers in scenic river segments.
Sacred Riverfront Zones
Development of traditional ghats, temple corridors, and sacred groves to preserve and enhance spiritual connections to the river (e.g., near Perur temple).
16.2.1Residential
The existing residential area within the corporation limits covers 115.39 Sq. Km, accounting for 44.76% of the total corporation area. Residential land use holds the largest share within the corporation limit. In the vicinity of the Town Hall, which represents the older part of the settlement, lowrise but high-density development is predominant. In contrast, areas such as Sai baba colony, R.S. Puram and Race Course feature High-Income Group (HIG) layouts characterized by low-rise, low-density development. Group housing and highrise developments are primarily located in Bharathi Nagar, Nava India and Shri Nagar. The southern boundary of the Corporation is defined by the Noyaal River, along which there is currently no residential development.
The major arterial roads of Coimbatore have played a significant role in shaping the settlement patterns across the city. Along Mettupalayam Road, residential development has taken the form of ribbon-like settlements extending outward from the city center. Areas such as Thudiyalur, Goundampalayam, and GN Mills show a gradual transition from dense urban settings to more semi-urban and rural landscapes as one moves northward. In contrast, development along Annur Road remains relatively sparse, with predominantly low-density settlements and large tracts of undeveloped land, reflecting an early stage of urbanization.
Avinashi Road stands out as one of the most intensely urbanized corridors, featuring a mix of dense residential neighborhoods like Peelamedu and Nehru Nagar, as well as high-rise developments, commercial establishments, and institutional zones. The corridor’s proximity to the airport, and major industrial estates has been a key driver of growth. Trichy Road similarly displays a blend of old residential colonies such as Ramanathapuram and Singanallur, alongside newer residential enclaves and gated communities. Here, ribbon development is pronounced, with residential, commercial, and institutional uses closely integrated along the corridor.
Kochi Road (Palakkad Road) exhibits a different pattern, where residential development is more fragmented and interspersed with industrial activities. Moving toward Madukkarai, the corridor is marked by scattered residential colonies, low-rise houses, and emerging plotted developments influenced by nearby industrial zones and transport hubs.
16.2.1.1 Slums
The Coimbatore Corporation is administratively divided into five zones, each comprising 20 wards. Within the corporation limits, slums are classified into five morphological categories: those near residential areas, in proximity to industries, around kulams (large water tanks), linear settlements along roads, railway tracks, and drains (nullahs), and slums in agricultural zones. Under the Rajiv Awas Yojana (RAY) scheme, 214 slum pockets have been identified and assessed based on tenability criteria such as land ownership, land use, location, and health risks. Of these, 115 slums (housing 19,266 households) are classified as tenable, while 99 slums (10,616 households) are considered non-tenable. The spatial distribution of these slums is illustrated in Map 12.10 provided in the Housing chapter.
16.2.3Industrial
Coimbatore, often referred to as the ‘Manchester of South India,’ is known for its vibrant industrial base comprising micro, small, medium, and large-scale enterprises, with a notable concentration in the manufacturing of textile garments, electrical components and spare parts.
The industrial land use within the corporation covers 16.21 square kilometers, representing 6.29% of the total corporation area. Four major industrial clusters are located within the LPA: CODISSIA, SIDCO, TIDEL Park (ELCOT), and SIDCO in Kurichi. In addition to these, several small and medium-scale industries are distributed along key corridors such as Mettupalayam Road, Avinashi Road, and Annur Road.
Kurichi was originally developed as a new town with the objective of supporting small- and medium-scale industries. The area hosts a range of manufacturing units that produce ancillary components for the automobile industry, spare parts for electrical equipment, and various products related to the textile sector.
Papanayakanpalayam, on the other hand, has historically served as a hub for traditional textile industries. Notable establishments in this area include Lakshmi Mills (now repurposed into the LULU Mall), ARC Spinning Mill, KPR Spinning Mills and Super Spinning Mills, among others. These industrial zones have played a significant role in shaping the economic and industrial landscape of Coimbatore.
16.2.2Commercial
The commercial land use within the corporation area covers 11.04 square kilometers, accounting for 4.28% of the total corporation area. Commercial establishments are primarily concentrated along major arterial roads such as Avinashi Road, Mettupalayam Road, and Sathyamangalam Road, typically following a ribbon development pattern. In the core town area, key commercial hubs include Cross Cut Road, Sukrawarpet, T.B. Road, and R.S. Puram, which serve as major retail and shopping destinations within the corporation limits. Nanjappa Road is known for its concentration of mechanical spare parts shops.
The commercial developments along Annur Road, particularly in Saravanampatti village, are characterized by the emergence of Information and Technology (IT) establishments, positioning the area as a growing IT hub within the region.
The former Lakshmi Mills site has been redeveloped into the LULU Mall, which now functions as a major recreational and commercial complex. Similarly, other prominent commercial and entertainment centers such as Brookefields, Fun Republic, and Prozone Mall also contribute significantly to the city’s commercial landscape.
Map 16.1:Continuous Building Area – Coimbatore Corporation
Continous Building Area - Coimbatore Corporation
CHIL SEZ IT Park in Coimbatore, located in Keeranatham, hosts a range of IT and ITES companies, including software development, BPO, KPO, IT consulting, product engineering, and digital solutions. Notable firms include Bosch, NTT Data, Maxval, and Cotiviti. The park offers modern amenities and supports both global and domestic technology companies in a state-of-the-art environment.
16.2.4Special and Hazardous Industries
According to the Tamil Nadu Pollution Control Board (TNPCB), special and hazardous industries are defined as those that generate or handle hazardous wastes, substances, or emissions that pose significant risks to human health and the environment. These industries are typically classified under the “Red” category in TNPCB’s pollution index.
Within the Local Planning Area (LPA), special and hazardous industries occupy 1.25 square kilometers, accounting for 0.48% of the total corporation area. The highest concentration of these industries is found in Kurichi town. Additionally, some of these industries are also located within the CODISSIA and SIDCO layouts situated within the corporation limits.
16.2.5Institutional
Institutional land use within the Local Planning Area (LPA) encompasses educational institutions, government offices, and public buildings. Coimbatore is widely recognized for its strong presence of educational institutions, many of which are located within the LPA. Prominent institutions such as PSG College, Kumaraguru College of Technology, Ramakrishna Institutions, Coimbatore Institute of Technology (CIT), and Tamil Nadu Agricultural University are situated within the corporation limits.
In addition to educational establishments, key government institutions—including the Central Jail and the District Collector’s Office—are also located within the corporation area. The total institutional land use covers 24.92 square kilometers, accounting for 9.67% of the total corporation area.
Figure 16.4: District Collector Office Coimbatore
16.2.6Open Space and Recreational
The Open Space and Recreational land use within the Local Planning Area (LPA) covers 0.90 square kilometers, accounting for 0.35% of the total area of corporation. VOC Park serves as a prominent recreational zone, featuring major sports complexes, a public park, and a zoo. Other significant recreational areas within the corporation limits include Gandhi Park and the Race Course.
To further enhance recreational infrastructure, eight lakefront development projects have been undertaken under the Smart City Mission. These include Selvachinthamani
Lake, Narasampathi Lake, Periyakulam Lake, Krishnampathi Lake, Valankulam Lake, Singanallur Lake, Kumarasamy Lake, and Selvampathi Lake. These developments aim to improve public access, environmental sustainability, and the overall quality of urban open spaces.
Figure 16.5: Walking Track in Race Course
Figure 16.6: Periyakulam Lake Front Development
16.2.7 Agriculture
Traditional agricultural practices are minimal within the corporation limits; however, plantation-based agriculture is still observed. These agricultural activities are predominantly concentrated in the western region and along the banks of the Noyyal River in the southern part of the corporation area.
The total agricultural land use within the corporation spans 56.79 square kilometers, accounting for 22.03% of the total area. This includes both wetland and dryland agricultural areas present within the corporation boundaries.
16.2.8Transportation
Two major national highways—NH 181 (Mettupalayam Road) and NH 948 (Sathyamangalam Road)—pass through the corporation limits. Additionally, NH 81 (Trichy Road), which originates from Chidambaram, transitions into NH 181 at the L&T Bypass Junction. Key state highways such as SH 164 (Anaikatti Road) and SH 167 (Maruthamalai Road) also run within the corporation boundaries.
The city is served by three major bus terminals: Ukkadam Bus Stand, Gandhipuram Bus Stand, and the Omni Bus Stand. Other important bus facilities include Mettupalayam Bus Stand, Singanallur Bus Depot, and Singanallur Bus Stand. Rail connectivity is provided through Coimbatore Junction, Vadakovai, and Podanur railway stations.
Furthermore, an international airport is located within the corporation limits, providing both domestic and international air connectivity. The total land use for transportation is 17.75 square kilometers, accounting for 6.89% of the corporation area.
16.2.9Water Body
The area under water within the corporation limits covers 13.56 square kilometers, accounting for 5.26% of the total area. Two major rivers flow through the corporation area: the Noyyal River and the Sanganur Pallam.
In addition, there are eleven prominent lakes within the corporation limits, including Narasampathi Lake, Krishnampathi Lake, Selvampathi Lake, Kumaraswamy Lake, Selvachinthamani Lake, Valankulam, Chinnakulam, Periyakulam, Kurichikulam, Singanallur Tank, and Sengulam. Alongside these, several smaller water bodies are also present, contributing to the city’s hydrological network.
Table 16.2Existing Land Use of Coimbatore Corporation
Land Use
Area (In Sq. Km)
Percentage of Land Use
Residential
115.39
44.76%
Commercial
11.04
4.28%
Industrial
16.21
6.29%
Special and Hazardous Industries
1.25
0.48%
Institutional
24.92
9.67%
Open spaces and Recreation
0.90
0.35%
Agriculture
56.79
22.03%
Transportation
17.75
6.88%
Waterbody
13.56
5.26%
Total
257.81
100.00%
DIRECTORATE OF TOWN &COUNTRY PLANNING - TAMIL NADU
DATA SOURCE
DTCP, Coimbatore
SCALE
0 0.4250.85 1.7 2.55 3.4Km
PROJECTION : UTM ZONE 43NDATUM : WGS 1984
Map 16.2: Existing Land Use Map 2024 – Corporation
16.3.1Residential
The residential land use within the four municipalities covers an area of approximately 22.33 square kilometers, accounting for 22.80% of their total area. These municipalities—Karamadai to the north, Karumathampatti to the east, Gudalur to the west, and Madukkarai to the south— are strategically positioned and function as gateways for the urban development of the Coimbatore Local Planning Area (LPA).
In Karamadai Municipality, residential development is predominantly linear, following a ribbon pattern along major roadways. In Karumathampatti, growth is concentrated between Avinashi Road and the railway line, indicating a corridor-based development pattern. Gudalur, located at the foothills of the Western Ghats, exhibits residential concentration primarily along Mettupalayam Road. Madukkarai Municipality, situated along the Kochi Highway, features a mix of high-rise developments and gated communities, with a notable focus on senior citizen housing. This spatial variation in development patterns highlights the diverse urban growth dynamics within each municipality.
16.3.2Commercial
The commercial land use within the municipalities covers an area of approximately 1.50 square kilometers, constituting 1.53% of the total area. Commercial activities are predominantly observed as ribbon developments along major highways and arterial roads, reflecting a linear growth pattern aligned with transportation corridors.
Karamadai Municipality, situated along Mettupalayam Road on the northern side of the LPA, benefits from its strategic location on the route to Udhagamandalam (Ooty), a prominent tourist destination. As a result, numerous
restaurants, lodges, and small retail outlets (petti shops) have emerged to cater to the needs of tourists.
In Karumathampatti, which lies within a significant industrial corridor, commercial establishments primarily serve the needs of industrial workers and businesses, with a focus on industrial support services and trade.
Madukkarai Municipality, located near the interstate border of Tamil Nadu and Kerala along the Kochi Highway, features commercial developments such as restaurants, motels, and service establishments catering to interstate travelers.
In Gudalur, commercial activity is also concentrated along Mettupalayam Road, exhibiting a ribbon development pattern similar to that observed in Karamadai.
16.3.3Industrial
The industrial land use within the municipalities covers an area of approximately 4.41 square kilometers, accounting for 4.50% of the total area. Among the four municipalities, significant industrial concentration is observed primarily in two—Karumathampatti and Madukkarai.
Karumathampatti Municipality exhibits the highest concentration of industrial activities within the Local Planning Area (LPA). It hosts a large number of manufacturing units, making it a key industrial node. The Anna Industrial Park, located on the northern side of Karumathampatti, accommodates a range of Micro, Small, and Medium Enterprises (MSMEs). These include ancillary units supporting the automobile sector, textile industries, electrical component of manufacturing units, and warehousing facilities.
In Madukkarai Municipality, industrial establishments are predominantly situated along the Kochi Highway. This area benefits from its proximity to Kurichi, a major industrial hub within the LPA, which has influenced the growth of industrial activities in the adjoining Madukkarai region.
16.3.4 Special and Hazardous Industries
The land use designated for special and hazardous industries covers approximately 3.31 square kilometers, accounting for 3.38% of the total area. These industries are predominantly concentrated in Karumathampatti and Madukkarai municipalities.
Madukkarai Municipality is home to the ACC Cement Plant, one of the major industrial establishments in this category. In addition to this, several other small- and medium-scale hazardous industries are dispersed across the municipalities, contributing to the industrial profile of the Coimbatore Local Planning Area (LPA).
16.3.5 Institution
The institutional land use within the municipalities covers an area of approximately 4.18 square kilometers, representing 4.27% of the total area. Key contributors to this category include the weekly market in Karamadai, the Army Training Institute in Madukkarai, and various polytechnic and technical institutions located in Karumathampatti. These establishments play a significant role in supporting the socioeconomic and educational infrastructure of the Coimbatore Local Planning Area (LPA).
16.3.6 Open Space and Recreation
The land allocated for open space and recreational use within the municipalities amounts to approximately 0.49 square kilometers, representing 0.50% of the total area. A notable recreational facility within this category is the race track located in Karumathampatti Municipality. In addition, several small parks and green spaces are distributed across residential areas and planned residential layouts, contributing to the recreational needs and overall livability of the urban environment.
16.3.7Agriculture
Agricultural land use occupies approximately 54.07 square kilometers, accounting for 55.21% of the total municipal area—indicating that over half of the land within the municipalities is dedicated to agricultural activities. While Madukkarai and Karumathampatti municipalities exhibit increasing industrial and residential development, the remaining two municipalities—particularly Gudalur—retain a predominantly agricultural characteristics.
Gudalur Municipality, located at the foothills of the Western Ghats, has the highest proportion of land under agricultural use. The favorable topography and soil conditions in this region support sustained agricultural practices, highlighting the continued importance of agriculture in
shaping the land use patterns within the Coimbatore Local Planning Area (LPA).
16.3.8Transportation
As all four municipalities are situated at the entry points of the Local Planning Area (LPA), they are intersected by major highways that serve as critical transportation corridors. Prominent among these are Mettupalayam Road (NH 181), Avinashi Road (NH 544), and Kochi Road (NH 544). The land use designated for transportation infrastructure occupies approximately 3.54 square kilometers, accounting for 3.61% of the total area.
In terms of rail connectivity, two railway stations are located within the municipalities: Somalur Railway Station in Karumathampatti and Madukkarai Railway Station in Madukkarai. These stations enhance regional connectivity and support the movement of both passengers and goods, contributing to the overall accessibility and economic development of the LPA.
16.4.1Residential
The residential land use in the Local Planning Area (LPA) accounts for 179.78 square kilometers, which constitutes 15.29% of the total area. Outside the Coimbatore Corporation limits, residential development predominantly follows a ribbon development pattern along major highways, often with a single-depth layout.
Areas such as Thudiyalur, Koundampalayam, and Neelambur have witnessed the emergence of gated communities and high-rise residential developments. In contrast, other parts of the LPA have predominantly low-rise and low-density residential patterns. Madampatti, located along Siruvani Main Road, is experiencing a rise in retirementfocused gated communities.
In the southeastern region of the LPA, residential density remains relatively low, primarily due to inadequate road connectivity, which hinders large-scale development in that area.
16.3.9Water Body
The land classified under water bodies covers an area of approximately 4.11 square kilometers, accounting for 4.20% of the total municipal area. Although there are no major water bodies within these municipalities, this category includes several smaller channels and drainage networks that serve as feeder systems to larger water bodies located outside the municipal boundaries. These water courses play a crucial role in managing stormwater, supporting local irrigation, and maintaining the hydrological balance within the Local Planning Area (LPA).
Table 16.3Existing Land Use of Municipalities
Existing Land Use
Area (In Sq. Km)
Percentage of Area
Residential
22.33
22.80%
Commercial
1.50
1.53%
Industrial
4.41
4.50%
Special and Hazardous Industries
3.31
3.38%
Institutional
4.18
4.27%
Open spaces and Recreation
0.49
0.50%
Agriculture
54.07
55.21%
Transportation
3.54
3.61%
Waterbody
4.11
4.20%
Total
97.94
100.00%
Map 16.3: Existing Land Use of 2024 – Municipality
16.4.2Commercial
The commercial land use within the Local Planning Area (LPA) covers 7.12 square kilometers, accounting for 0.61% of the total area. A significant portion of commercial establishments is concentrated along major roads, forming small Central Business Districts (CBDs) in key settlements.
Notable commercial clusters are observed along Mettupalayam Road in locations such as Periyanayakkan Palayam, along Annur Road in Sarkarsamakulam and Idikarai; along Avinashi Road in Neelambur, and Irugur; along Trichy Road in Sulur; along Pollachi Road in Malumichampatti and Kinathukadavu; and along Kochi Road.
In addition to these commercial nodes, the LPA also includes seven regulated markets and one sub-regulated market. Furthermore, the area accommodates six agricultural
godowns and two non-agricultural godowns, contributing to the overall commercial land use in the region.
16.4.3Industrial
The industrial land use within the Local Planning Area (LPA) covers approximately 57.83 square kilometers, representing 4.92% of the total area. Industrial activities are primarily concentrated around key industrial layouts and their adjoining villages.
Notable industrial clusters include the CODISSIA layout at Mooperipalayam, along with nearby villages such as Pachapalayam and Masakoundenchettipalayam; Anna Industrial Park in Kittampalayam and its surrounding areas, including Kaniyur, Neelambur, and Irugur; and the SIDCO Industrial Estate in Chettipalayam. An additional industrial zone is located within the CODISSIA layout at Arasampalayam.
Specific industrial specializations are observed across various regions: Neelambur and its neighboring villages have developed as hubs for automobile, motor, and pump manufacturing; Chettipalayam and Kallapalayam are recognized for their electrical automation industries; Sarkarsamakulam and Kannampalayam host a significant number of food processing units; Periyanaickenpalayam and Idikarai specialize in pump and electrical engineering; Madukarai is known for cement manufacturing; and Somayampalayam is noted for steel and chemical industries.
Coimbatore’s industrial sector is distinguished by its diverse manufacturing base, producing textile machinery, engineering components, electric motors, automotive parts, industrial pumps, and wet grinders. These industries significantly contribute to regional economic growth and bolster the national industrial output.
16.4.5Institutional
The institutional land use within the Local Planning Area (LPA) covers 28.01 square kilometers, accounting for 2.38% of the total area. This category includes prominent institutions such as the CRPF Training College in Narasimhanaickenpalayam, Bharathiar University, and Anna University.
A significant concentration of higher educational institutions is observed in the southern part of the LPA, particularly along Pollachi Road and Kochi Road. This area houses 29 engineering colleges, 13 arts and science colleges, and 8 polytechnic colleges, contributing to the region’s reputation as an educational hub.
In addition to these academic institutions, an Air Force training station is located along NH 81 (Palladam Road), further contributing to the institutional land use in the planning area.
16.4.6 Open Space and Recreational
The open space and recreational land use within the Local Planning Area (LPA) covers 0.98 square kilometers, accounting for 0.08% of the total area. The LPA includes two race tracks—one located in Karumathampatti and the other in Chettipalayam.
In addition to these facilities, notable recreational and cultural attractions such as the PSG GRD Museum of Science and Technology, Maharaja Theme Park, and Kovai Kondattam Theme Park are situated within the planning area, contributing to the recreational infrastructure of the region.
16.4.7Agriculture
Agriculture constitutes the predominant land use in the rest of the Local Planning Area (LPA), covering approximately 806.26 sq. km, which accounts for 68.57% of the total area. Also, the Hill lock and HACA area has been
included within the Agricultural land use area. The majority of wet agricultural land is concentrated along the banks of the Noyyal River and the Sanganoor Pallam, with access to water supports for intensive cultivation. In addition to these riverine zones, significant stretches of agricultural land are found in the western part of the LPA, particularly along the foothills of the Western Ghats. These areas benefit from fertile soil and favorable climatic conditions conducive to diverse cropping patterns.
Further agricultural activity is observed in regions such as Periyanayakanpalayam and Agharasamakulam, where both wet and dry farming practices are prevalent. On the southern side of the LPA, towards Pollachi, a high concentration of agricultural land is evident, reflecting the region’s agrarian character and its role in local food production. The agricultural landscape across the LPA supports a variety of crops, including paddy, coconut, banana, vegetables, and pulses.
16.4.4Special and Hazardous Industries
Industries classified under the ‘Red’ category by the Tamil Nadu Pollution Control Board (TNPCB), due to their potential environmental impact, fall under the category of Special and Hazardous Industries. Within the Local Planning Area (LPA), this category occupies 17.04 square kilometers, representing 1.45% of the total area.
A significant concentration of these industries is observed in the northern part of the LPA, particularly in Panchapalayam. In the southern region, active quarrying operations are found in the Madukkarai and Kinathukadavu taluks, further contributing to the special and hazardous industrial land use in that area.
16.4.8Hillock
Hillocks are predominantly located in the northern and western regions of the Local Planning Area (LPA), covering an area of approximately 9.40 square kilometers, which constitutes about 0.80% of the total area. These natural landforms play a significant role in influencing the ecological character of the region. They contribute to the overall vegetation cover in the surrounding areas by supporting natural drainage patterns, acting as catchment zones for rainfall, and facilitating groundwater recharge. Furthermore, these hillocks serve as microclimatic regulators by moderating temperature variations and supporting diverse plant species, thereby enhancing the green cover and ecological balance within the LPA.
16.4.9Forest
The forest area in the rest of LPA located Within the Tenkarai Town Panchayat, there is a single forest area encompassing approximately 2.65 square kilometers, accounting for 0.23% of the total land area. Additionally, several Reserve Forests are located along the southern boundary of the Local Planning Area (LPA), including the Bolampatty Reserve Forest, Thadagam Reserve Forest, and Anaikatty Reserve Forest. These forests form part of the
ecologically significant Western Ghats, a globally recognized biodiversity hotspot. They play a vital role in the conservation of flora and fauna, the protection of water resources, and the prevention of soil erosion.
16.4.10HACA Villages
A total of 19 villages located along the western boundary of the Coimbatore Local Planning Area (LPA) have been officially notified under the jurisdiction of the Hill Area Conservation Authority (HACA), in accordance with G.O.(Ms) No. 44 H&UD, dated 02.04.1990. These villages fall within the ecologically sensitive zones of the Western Ghats, a globally recognized biodiversity hotspot. The primary objective of this notification is to conserve the fragile ecological balance of the region by regulating development and safeguarding the natural environment. All developmental activities in these areas require prior approval from the competent authorities, and the construction of unauthorized structures is strictly prohibited. The conservation efforts in these HACA-designated villages play a vital role in preserving biodiversity, maintaining the natural landscape, and enhancing green cover in the western part of Coimbatore. Additionally, these measures align with the broader goals of sustainable urban development and environmental protection. The 19 HACA-notified villages include Sundakamuthur, Gudalur, Kalikkanayakkanpalayam, Ettimadai, Puluvapatti, Thondamuthur, Narasimanayakkanpalayam, Veerapandi No. 24 (part), Madhampatti, Nayakkanpalayam, Theethipalayam, Somayampalayam, Nanjundapuram, Perur Chettipalayam, Chinnathadagam, Devarayapuram, Ikkarai Boluvampatti, Alandurai, and Thenkarai. These villages act as a critical ecological buffer and support the long-term sustainability of the Coimbatore region.
16.4.11Transportation
The existing land use dedicated to transportation within the Local Planning Area (LPA) of Coimbatore is approximately 31.84 sq. km, which constitutes 2.71% of the total area. The LPA is traversed by several major national and state highways that facilitate regional and interstate connectivity. Avinashi Road (NH 544) connects Coimbatore to Salem, Bangalore, and Chennai, while Palakkad Road (NH 544) links the city to Thrissur, Kochi, and Thiruvananthapuram. Trichy Road (NH 81) provides access
to Karur, Trichy, and Nagapattinam, and Mettupalayam Road (NH 181) connects to Ooty and Karnataka. Sathyamangalam Road (NH 948) extends towards Chamrajnagar and Bangalore, and Pollachi Road (NH 83) links Coimbatore to Palani and Dindigul. Additionally, Thadagam Road (SH 162) connects to Anaikatti, and Marudhamalai Road (SH 167) leads to Vadavalli. In terms of public transport infrastructure, the LPA includes several bus stands located outside the Coimbatore Corporation limits, such as Sulur Bus Stand, Somanur Bus Stand, and Periyanayakanpalayam Bus Stand. The railway network within the LPA is supported by three major stations—Sulur Road, Periyanayakkanpalayam, and Chettipalayam. Furthermore, the region also houses an air force station and an associated airport facility.
16.4.12Water Body
The land classified under “land under water” in the rest of the Local Planning Area (LPA) covers approximately 46.96 sq. km, accounting for 3.99% of the total area. This includes rivers, streams, lakes, ponds, and other surface water bodies that play a critical role in the region’s hydrology, agriculture, and ecological balance. The major watercourses traversing the LPA include the Noyyal River, Sanganoor Pallam, Tanniyasi Odai, Perumpallam, and Elarumai Pallam, which serve as key drainage channels and sources of irrigation for nearby agricultural lands.
In addition to these streams, several significant lakes and tanks are present within the LPA. Notable among them are Pallapalayam Lake, Sulur Lake, and Achankulam, which contribute to groundwater recharge, act as flood buffers, and support local biodiversity. These water bodies also offer potential for recreational development and eco-tourism, while some serve as traditional water sources for domestic and agricultural use.
Table 16.4Existing Land Use of Rest of LPA
Existing Land Use
Area (In Sq. Km)
Percentage of Area
Residential
179.78
15.29%
Commercial
7.12
0.61%
Industrial
57.83
4.92%
Special and Hazardous Industries
17.04
1.45%
Institutional
28.01
2.38%
Open Spaces and Recreation
0.98
0.08%
Agriculture and Others
806.26
68.57%
Transportation
31.84
2.71%
Waterbody
46.96
3.99%
Total
1175.82
100.00%
Table 16.5Summary of Existing Land Use of Coimbatore LPA
Land Use
Area (in Sq.km)
Percentage of Area
Residential
16.5.1Building Approvals
The residential building approval data compiled over the past decade provides valuable insights into the growth trends within the Coimbatore Local Planning Area (LPA). The thematic representation in Map 16.4 effectively illustrates the spatial distribution of residential development. The Old Coimbatore Corporation area exhibits the highest volume of building approvals, reflecting a clear trend of urban renewal. This surge is largely attributed to the demolition of aging structures and the construction of modern residential buildings, indicating a densification of the urban core.
Additionally, surrounding localities such as Vilankurichi, Kalapatti, Vellakinar, and Veerakeralam are witnessing substantial development, positioning them as emerging urban growth nodes. These areas benefit from proximity to established city centers while offering relatively affordable land and improved infrastructure, making them attractive for new residential projects.
Peripheral zones including Sulur, Kaniyur, Madampatti, and Irugur demonstrate moderate but consistent growth. Their development potential is amplified by enhanced connectivity through national highways (NH 81, NH 544) and railway lines, which facilitate commuter movement and logistics. This pattern suggests a gradual outward expansion of urban development, aligning with broader trends of suburbanization.
growth trends within the Coimbatore Local Planning Area (LPA). The thematic representation in Map 16.4 effectively illustrates the spatial distribution of residential development. The Old Coimbatore Corporation area exhibits the highest volume of building approvals, reflecting a clear trend of urban renewal. This surge is largely attributed to the demolition of aging structures and the construction of modern residential buildings, indicating a densification of the urban core.
Additionally, surrounding localities such as Vilankurichi, Kalapatti, Vellakinar, and Veerakeralam are witnessing substantial development, positioning them as emerging urban growth nodes. These areas benefit from proximity to established city centers while offering relatively affordable land and improved infrastructure, making them attractive for new residential projects.
Map 16.5: Residential Building Approvals in Coimbatore LPA
RESIDENTIAL BUILDING APPROVALS
Peripheral zones including Sulur, Kaniyur, Madampatti, and Irugur demonstrate moderate but consistent growth. Their development potential is amplified by enhanced connectivity through national highways (NH 81, NH 544) and railway lines, which facilitate commuter movement and logistics. This pattern suggests a gradual outward expansion of urban development, aligning with broader trends of suburbanization.
16.5.2Residential Layout
The mapping of residential layout approvals over the past decade provides a strategic understanding of land use transformation within the Coimbatore Local Planning Area (LPA), particularly the conversion of agricultural land into residential zones. This spatial analysis highlights the town’s growth direction and identifies key areas of current and future urban expansion.
Within the Corporation limits, Kalapatti and Saravanapatti have emerged as high-demand zones due to their proximity to TIDEL Park and KGISL SEZ, fostering IT and industrial growth. Similarly, Vellakinar and Thudiyalur, located near NH-181 and Avinashi Road, serve as critical residential hubs for the workforce. Veerakeralam, Chinnavedampatti, and Kurinchi are experiencing rapid urbanization, supported by enhanced infrastructure and transport connectivity.
In the extended LPA, areas like Vellanaipatti, Irugur, Pattanam, and Kallapalayam are benefits from their proximity to national highways and the airport, making them ideal for logistics, warehousing, and premium residential layouts. Satellite towns such as Malumichampatti, and Seerapalayam are evolving through township projects and industrial activities.
Future growth is projected in Idigarai, Panimadai, Mylampatti, and Pappampatti, owing to affordable land and key infrastructure corridors. Scenic zones like Thondamuthur and Kalikanayakan Palayam are gaining popularity for eco-friendly and premium housing. The development of Veerapandi and nearby localities is driven by industrial proximity, positioning them as upcoming mixed-use growth centers.
Map 16.6: Residential Layout Approvals in Coimbatore LPA
RESIDENTIAL LAY OUT APPROVALS
16.5.3Industrial Buildings
The industrial building approvals over the past ten years have been analyzed to assess growth trends, demand concentration, and infrastructure availability within the Local Planning Area. This analysis provides valuable insights into spatial patterns of industrial development and helps identify potential zones for future industrial expansion. Data from the past decade has been compiled, and a thematic map has been prepared, as illustrated in Map 16.7.
Over the past few decades, the village of Kurichi, located within the Coimbatore Corporation limits, has recorded the highest number of industrial building approvals. Among the villages under the Local Planning Area (LPA), Appanayakkanpatti, Karumathampatti (Municipality), Moppiripalayam (Town Panchayat), Masagoundenpalayam, Keeranatham, and Bilichi have each seen approvals exceeding 100,000 square meters of industrial built-up area, indicating a significant concentration of industrial development in these locations. In addition, the adjoining villages—Seerapalayam, Somayampalayam, Idigarai, Mylampatti, and Kaniyur— are emerging as the next tier of industrial growth centers. These villages exhibit strong potential for future industrial development due to their strategic proximity to established industrial zones, improved infrastructure including road networks and utility services, availability of affordable and suitable land parcels, and supportive planning policies aimed at promoting decentralized industrialization. These factors collectively position these areas as key contributors to the region’s ongoing and future economic expansion.
Map 16.7: Industrial Building Approvals in Coimbatore LPA
INDUSTRIAL BUILDING APPROVALS (2014 - 2024)
16.5.4Summary
An analysis of building and layout approvals for residential and industrial developments within the Coimbatore Local Planning Area (LPA) has been carried out to understand urban growth trends. The increasing number of residential approvals reflects a rise in housing demand due to population growth and urban expansion. Similarly, industrial layout approvals indicate Coimbatore’s continued growth as an industrial hub. These trends are essential inputs for proposing appropriate land use allocations in the Master Plan.
Past Planning Efforts
17.1 Background
The Coimbatore LPA has two distinctive landforms One is the plain terrain, which dominates the LPA, offers a favorable landscape for urban development, agriculture, and industrial activities. In contrast, Western ghats on the western side of the LPA influence climate, water availability, and vegetation, contributing to the region’s ecological balance and natural resources. Under the Town and Country Planning act of Tamil Nadu 1971, under section 10(4), G.O(Ms). No.188 dated 25.10.2022 it was confirmed to be a local planning area. As per the URDPFI classification, Coimbatore LPA comes under a metropolitan city I with an overall population of 24,57,452.
17.1.1Evolution of Local Planning Area
Coimbatore Local Planning Area
The Coimbatore Local Planning Area was initially notified under Section 10(1) of Town and Country Planning Act, as per G.O (Ms) No. 399 R.D & L.A Department dated 22.02.1974 consisting of 45 Revenue Villages of Coimbatore Taluk and 10 Revenue Villages in Palladam Taluk. The same area is confirmed in G.O (Ms) No. 1502 R.D & L.A Dept Dated 21.06.1974.
Subsequently, an additional 29 revenue villages in Coimbatore Taluk, 14 revenue villages in Palladam Taluk, and 4 revenue villages in Avinashi Taluk were included and notified under Section 10(1) of the Town and Country Planning Act through G.O. (Ms) No. 256, H&UD Department, dated 22.02.1978. This area was later confirmed under Section 10(4) in G.O. (Ms) No. 503, H&UD Department, dated 17.04.1980.
The Composite Local Planning Area comprises Coimbatore Corporation, Madukkarai Township, 31 Town Panchayats, and 55 revenue villages. The existing Master Plan has been prepared for an area of 1,287 sq. km and was approved under Section 28 of the Town and Country Planning Act through G.O. (Ms) No. 661, H&UD Department, dated 12.10.1994. Notably, the existing Master Plan has been formulated excluding the Kurichi New Town Development.
Kurichi New Town Development Plan
A separate master plan was developed for Kurichi New Town, covering an area of 47.97 sq. km, which encompasses the three revenue villages of Kurichi, Malumichampatti, and
Siripalayam. The planning area was officially notified under Section 10(1) through G.O. (Ms) No. 151 H&UD, dated 15.02.1980, and subsequently confirmed under Section 10(4) via G.O. (Ms) No. 444 H&UD, dated 19.06.1983.
The Kurichi New Town Development Authority was established under Section 11(4) of the Town and Country Planning Act, as per G.O. (Ms) No. 333 H&UD, dated 24.04.1984. The final master plan for Kurichi New Town received approval through G.O. (Ms) No. 327 H&UD, dated 14.03.1995.
In 2009, the Coimbatore district was bifurcated, and the new district, Tiruppur was formed. As part of this reorganization, four revenue villages from Coimbatore Local Planning Area namely, Paruvai, Kodangipalayam, Ichipatti, and Samalapuram were separated from Coimbatore LPA and included in Tiruppur district. The Four revenue villages are now is a part of Tiruppur Master Plan.
Considering the urban expansion and population growth in Coimbatore, the LPA has been expanded. Since the Kurichi New Town is located adjacent to the planning area, it is also included in the planning area and declared under section 10(1) through G.O(Ms) No. 41 H&UD dated 26.02.2014. The same is confirmed under Section 10(4) through the G.O(Ms) No. 188 dated 25.10.2022. The planning area is increased from existing 1287 Sq. Km to 1531.57 Sq. Km. This includes 1 corporation, 4 Municipality, 21 Town Panchayats and 66 Revenue Villages as shown in the Map 17.1. The Draft Master Plan is prepared for this area and published under G.O(Ms) No. 07 dated 13.01.2024.
17.2.1Administrative Boundary
The administrative boundary of the Coimbatore Planning Area 2001 encompasses the Coimbatore Corporation, Madukkarai Municipality, 31 Town Panchayats, and 55 revenue villages. The total extent of the planning area is 1,287 square kilometers. A detailed area-wise breakdown of the Local Planning Area is provided in Table 17.1, while Map 17.1 illustrates the administrative boundary as defined in the existing 2001 Master Plan.
Table 17.1Administrative Boundary of Coimbatore Master Plan 2001
S.No
Administrative Unit
No. of Units
Total Area (In Sq.Km)
1
Coimbatore Corporation
1
105.60
2
Madukarai Township
1
21.47
3
Town Panchayat
31
447.69
4
Village Panchayat
55
712.24
Total
1287.00
Source: Coimbatore Master Plan 2001
17.4.2Commercial Use
Commercial land use within the Local Planning Area (LPA) is primarily concentrated in the core areas of the city, accounting for approximately 0.23% of the total land area. These zones serve as hubs for wholesale and retail trade, as well as warehousing activities. Major commercial corridors include Dewan Bahadur Road, Cross Cut Road, both sides of Avinashi Road up to Race Course Road, Jail Road, and N.S.R. Road. The concentration of commercial establishments along these prominent routes highlights the city’s traditional commercial spine and its role in supporting economic activity within the urban fabric.
17.2.2Detailed Development Plans
Section 19 of the Tamil Nadu Town and Country Planning Act provides for the preparation and implementation of Detailed Development Plans (DDPs) for specific areas within the Local Planning Area (LPA). A total of 276 DDPs have been prepared within the Coimbatore LPA. However, only 60 DDPs have been approved during the period from 1974 to 2012 and are in effect. These plans were formulated to optimize land utilization, enhance infrastructure, and promote environmental sustainability, thereby facilitating balanced and orderly urban development. In addition, 11 Town Planning Schemes have also been prepared and approved from 1933 to 1972.
These Detailed Development Plans are proposed to optimize land use, improve infrastructure, and promote environmental sustainability, ensuring balanced development. Figure 17.1 shows the sanctioned Detailed development plan in Coimbatore corporation. Figure 17.2 existing land use map for corporation, where the detailed development plan boundaries are clearly demarcated. At
present there are 71 approved, 114 draft and 91 consented detailed development plans are used for approval and change of land use within the LPA boundary.
There are 247 scheme roads proposed in the detailed development plans, Table 17.2 shows the status of the scheme roads.
Table 17.2Status of scheme roads in DDP
S.No
Proposed Roads
No. of Roads
1
Roads already completed
58
2
Roads to be developed
53
3
Roads not feasible
136
Total
247
Figure 17.1: D.D. Plan no. 12
Figure 17.2: Existing Land Use Map of Coimbatore Corporation
17.4.3Industrial Use
Industrial land use within the Coimbatore Local Planning Area (LPA) accounts for approximately 1.40% of the total land area. The region hosts a significant number of
17.5 Projection and Analysis of the Existing Master Plan
large-scale industries, particularly in sectors such as textiles, textile machinery, cement, rubber, transport equipment, foundry engineering, and various branches of engineering that produce finished goods. In addition to these, a substantial presence of medium and small-scale industrial units further contributes to the city’s industrial profile. The major industrial clusters are predominantly located along key transportation corridors, including Mettupalayam Road, Avinashi Road, Trichy Road, Sathy Road, and Pollachi Road, reflecting a well-established industrial base aligned with regional connectivity.
17.4.4 Educational Use
Educational land use within the Coimbatore Local Planning Area (LPA) constitutes approximately 1.23% of the total land area. A significant number of technical and higher educational institutions are situated within the LPA, with a notable concentration along major corridors such as Avinashi Road and Mettupalayam Road.
17.5.1Analysis of the Existing Master Plan
The master plan focuses on a structured approach to urban development by identifying key growth centres within urban nodes to guide balanced regional expansion. It emphasizes the enhancement of connectivity through a robust transportation network linking major roads and areas of economic activity. Land is allocated optimally through well-defined land use zoning to ensure efficient utilization of space and resources. The plan aims to stimulate the local economy by leveraging existing textile mills and promoting manufacturing industries, thereby generating employment opportunities. Housing requirements are addressed based on the needs of the projected population, ensuring adequate and planned residential development. Additionally, commercial zones are strategically established along major link roads to support economic activity and improve access to goods and services.
17.5.2 Population Projection
The population for the entire Local Planning Area was projected to reach 21.60 lakh by the ultimate year 2001. However, according to the actual census data of 2001, the
17.6 Existing Master Plan for Kurichi New Town Development Plan 2011
population stood at only 17.41 lakh. This indicates a shortfall of 3.65 lakh from the projected figure. The net residential density projected for Coimbatore LPA is 70 persons per hectare.
17.5.3Employment Projection
According to the Coimbatore Master Plan, the workforce for the year 2001 was projected to comprise 38.36% of the total population, amounting to an estimated 8.28 lakh individuals. However, the actual data from the 2001 Census reveals a significantly higher workforce participation rate of 46.07%, with a total of 5.48 lakh individuals engaged in various economic activities. This substantial increase in the working population, both in terms of percentage and absolute numbers, clearly reflects the rapid economic development and the expansion of employment opportunities within the Local Planning Area.
17.6.1Administrative Boundary
The Kurichi New Town Development Plan encompasses three revenue villages: Kurichi, Malumichampatti, and Seerapalyam. Among these, Kurichi functions as a Special Grade Town Panchayat, while Malumichampatti and Sirupooluvapatti are governed as Village Panchayats. The total planning area covers approximately 47.97 square kilometers.
The primary reason for initiating the development plan is the presence of a significant number of small- and mediumscale industries along the Coimbatore–Dindigul Highway. This industrial activity has led to unplanned and haphazard growth in the region. In order to manage this unregulated development and promote organized urban expansion, the Kurichi New Town Development Plan has been formulated.
17.6.2Summary of the Report
The Kurichi New Town Development Plan, 2011 is structured into two parts. Part A provides a comprehensive assessment of the existing conditions, including demographic characteristics, economic structure, housing, industrial activity, and transportation systems. Part B focuses on land use zoning, strategic planning, and the proposed land use framework.
According to the 1991 Census, the population of Kurichi New Town was 72,325, with a decadal growth rate of 30.14%. The net residential density stood at 205 persons per hectare, with Kurichi Town exhibiting the highest residential density among the areas covered.
As per the 1991 census, 32% of the total population were classified as working individuals. The economic base of the area is predominantly industrial, with Kurichi Town housing 302 small- and medium-scale industrial establishments. Employment data reveals that 13.75% of the workforce is engaged in primary activities, while a significant 86.25% is employed in secondary sector activities, underscoring the town’s industrial character.
Map 17.2: Existing Master Plan 2001 and Kurichi NTDP – Boundary
EXISTING MASTER PLAN 2001 & KURICHI NTDP - BOUNDARY
17.7 Land Use Breakdown
The residential areas in Kurichi New Town are predominantly located along the National Highway connecting Coimbatore and Dindigul, forming a pattern of ribbon development. In addition to this linear growth, residential settlements are also observed in clusters surrounding the existing industrial establishments. The residential land use accounts 27.57% of LPA.
Within the Kurichi New Town planning area, there are a total of 302 small- and medium-scale industrial establishments. Of these, 252 units are located in Kurichi, 36 units in Malumichampatti, and 14 units in Siripalayam. The majority of these industries are engaged in the manufacturing of engineering goods. The planning area also includes one private industrial estate and one government industrial estate. Industrial establishments are predominantly situated on either side of the National Highway.
17.8.1Population Projection
According to the 2011 Census, the existing population of the Kurichi New Town area is 142,484. However, the Kurichi New Town Development Plan had projected the population for 2011 to be approximately 1,24,000. This indicates an increase of around 18,484 people beyond the projected figure, clearly highlighting a population growth.
The primary reason for this population growth is attributed to the presence of small and medium-scale industries within the planning area, which attract a working population. Additionally, the Kurichi New Town is located adjacent to the Corporation boundary, further contributing to the rise in population due to urban spillover and increased residential demand in the area.
17.8.2Employment Projection
According to the 2011 Census, the total workforce population within the Local Planning Area (LPA) is 42,394, which accounts for 29.75% of the total population. In contrast, the Kurichi New Town Development Plan had projected a workforce population of 48,774, representing 39.33% of the total.
However, it is evident that the projected workforce population has not been realized. This shortfall can be primarily attributed to the tendency of people to prefer Kurichi New Town as a residential area rather than an industrial or employment hub. Furthermore, a significant portion of the working population employed within the LPA resides outside its boundaries, which also contributes to the discrepancy between the projected and actual workforce numbers.
17.9 Land Use Comparison for Coimbatore Master Plan and Kurichi NTDP
17.9.1Coimbatore Master Plan 2001
In this section, the proposed land use outlined in the Coimbatore Local Planning Area (LPA) Master Plan of 2001 is compared with the existing land use as of 2024, in order to assess the extent of development achieved over the two-decade period. It is important to note that this land use comparison excludes the four villages of Samalapuram, Ichipatti, Kodangipatti, and Paravai, as these areas were merged with the Tiruppur LPA following the bifurcation of the district. The analysis aims to identify the gaps between the proposed and actual development, as well as highlight areas where development has exceeded the projections of the previous master plan.
Land Use Comparison for Coimbatore Corporation
Residential
In the Coimbatore LPA Master Plan of 2001, residential land use was proposed over an area of 70.71 sq. km, with a projected net residential density of 13 persons per hectare. However, based on the existing land use data from 2024, the actual residential area amounts to 40.28 sq. km. The 2001 Master Plan proposed residential development across most parts of the LPA, with the exception of the southern region. In contrast, the 2024 existing residential land use is distributed in all directions, though with noticeable gaps in continuity. The southern part of the LPA continues to remain underdeveloped in terms of residential land use, falling short of the projections made in the earlier master plan.
Commercial
In the Coimbatore LPA Master Plan of 2001, commercial land use was proposed over an area of 4.05 sq. km, accounting for 3.84% of the total Local Planning Area, with a primary focus on the core business district. However, the existing land use data from 2024 indicates that commercial land use has increased to 6.86 sq. km, representing 6.05% of the total area. This significant growth highlights an expansion of commercial activities within the planning area. Furthermore, commercial establishments are predominantly observed along major road corridors, indicating a shift toward linear commercial development.
Industrial
In the Coimbatore LPA Master Plan of 2001, industrial land use was proposed over an area of 5.84 sq. km, accounting for 5.53% of the total planning area. In comparison, the existing land use data from 2024 reveals that industrial land use has expanded to 7.19 sq. km, representing 6.81% of the total area. This indicates a noticeable growth in industrial development within the LPA. In 2024, industrial activities remain concentrated along the originally proposed corridors—Annur Road, Avinashi Road, and Palladam Road.
17.9.2Kurichi New Town Development Plan 2011
The Kurichi New Town Development Plan was initially formulated due to the presence of numerous small and medium-sized industries within the planning area. As industrial development along Avinashi Road progressed, the majority of industrial establishments relocated to Arasur and Kanniyur villages. This section provides a comparison of land use between the proposed land use of 2011 and the existing land use in 2024.
Residential
In the 2011 Master Plan, the proposed residential land use was 20.75 sq. km, constituting 43.26% of the total area, with a planned net residential density of 60 persons per hectare. However, as per the existing land use in 2024, the residential area measures only 17.38 sq. km, accounting for 36.24% of the total area. This indicates that the proposed residential land use has not been fully realized. Observations reveal that residential development has occurred in a scattered manner, with vacant lands interspersed between built-up areas.
Industrial
Kurichi New Town was originally envisioned as an industrial hub, owing to the presence of numerous small and medium-scale industries within the region. The 2011 Master Plan allocated 12.73 sq. km—equivalent to 26.54% of the total area—for industrial use. However, the existing land use as of 2024 indicates that only 5.98 sq. km, or 12.46% of the total area, is currently utilized for industrial purposes, highlighting a substantial deviation from the proposed plan.
This gap can be attributed to several factors. One of the primary reasons is the relocation of a significant number of industrial establishments toward the Avinashi Road corridor, which offers better connectivity and infrastructure. Additionally, the rapid growth of urban population and the resulting urban sprawl have exerted pressure on land resources, leading to a shift in land use priorities.
As Kurichi lies in close proximity to the Coimbatore Corporation area, the town has increasingly experienced residential expansion. This has gradually transformed its industrial character into a predominantly residential one, as demand for housing and related infrastructure has taken precedence over industrial development. The change in land use pattern reflects the evolving urban dynamics and the need to adapt planning strategies accordingly.
Commercial
In the 2011 Master Plan, the proposed commercial land use was 1.83 sq. km, accounting for 3.81% of the total area. However, the existing commercial land use as of 2024
stands at only 0.89 sq. km, representing 1.85% of the total area. This clearly indicates that the proposed commercial land use has not been fully realized. The original proposal identified commercial development along the L&T Bypass and Pollachi Road. However, current observations show that commercial activity is primarily concentrated in the Central Business District (CBD) of Kurichi Town and to a limited extent along Pollachi Road, falling short of the intended development outlined in the master plan.
34,520
1 8
2
5
39,984
1 7
2
5
46,338
1 6
1
5
Su ltanpet Block
27,250
1 3
1
2
30,466
1 2
1
2
34,1 48
1 1
0
2
Su lur Block
1 ,36,1 64
3 1
3
1 1
1 ,94,073
1 9
-5
1 0
2,93,363
-1
-1 8
9
Thondamuthur Block
52,664
1 0
-1
3
60,640
9
-2
3
68,656
7
-3
3
Total Revenue Vi l lages
555,347
-
-1
-
744,476
-
-1 6
-
1 ,047,241
-4
-54
-
Total Gap assessed in Coimbatore LPA
3 1 ,62,392
-
-30
-
42,04,955
-78
-1 52
-
58,24,706
-3 1 6
-358
-
30,466
-1
0
34,148
-1
0
0.002
0
Sulur Block
1,36,164
-5
-1
1,94,073
-6
-2
2,93,363
-10
-2
0.02
0.006
Thondamuthur Block
52,664
-2
0
60,640
-2
-1
68,656
-2
-1
0.004
0.003
Total Revenue Villages
5,55,347
-16
-2
7,44,476
-20
-5
10,47,241
-31
-7
0.062
0.021
Gap in Total Coimbatore LPA
31,62,392
-31
-2
42,04,955
-52
-5
58,24,706
-91
-7
0.184
0.021
Kinathukadavu
0 (Surplus)
(Sur0plus)
0 (Surplus)
0 (Surplus)
(Sur0plus)
(Surplus)
Madukkarai
0 (Surplus)
(Sur1plus)
-1 (0.10sq.km)
0 (Surplus)
(Sur0plus)
0.18sq.km
Mettupalayam
1 (Surplus)
(Sur0plus)
0 (Surplus)
0 (Surplus)
(Sur0plus)
(Surplus)
Perur
2 (Surplus)
10(Surplus)
1 (Surplus)
2 (Surplus)
(Sur4plus)
(Surplus)
Total Deficit
(Surplus)
(Surplus)
-4 (0.40sq.km)
-2 (0.20sq.km)
(Surplus)
1.02sq.km
Table 11.39Administration wise Gap Analysis and Area Requirement for Other Amenities as per URDPFI
Admin
Library
Anganwadi
Bank Facilities
Community Halls
Total Area required
Population Threshold
15000
5000
1 Lakh
15000
for the Deficits (in Sqkm)
Corporation
-186 (-0.372sq.km)
-257 (0.072sq.km)
161 (Surplus)
-35 (0.07sq.km)
0.514sq.km
Total
-6 (-0.012
-6 (0.0018
-4 (0.01
-19 (0.038
0.0618
Municipalities
sq.km)
sq.km)
sq.km)
sq.km)
sq.km
Town Panchayats
-19 (0.038sq.km)
-15 (0.0045sq.km)
-1 (0.003sq.km)
-39 (0.076sq.km)
0.1215sq.km
Annur Block
-2 (0.002sq.km)
27 (Surplus)
-1 (0.003sq.km)
-5 (0.01 sq.km)
0.015sq.km
Karamadai Block
0 (Surplus)
9 (Surplus)
0 (Surplus)
-2 (0.004sq.km)
0.004sq.km
Kinathukadavu
-3 (0.006
8 (Surplus)
0 (Surplus)
-3 (0.006
0.012
Block
sq.km)
sq.km)
sq.km
Madukarai Block
-5 (0.01sq.km)
6 (Surplus)
-1 (0.0025sq.km)
-8 (0.016sq.km)
0.0285sq.km
PN Palayam Block
-10 (0.02sq.km)
-21 (0.0063sq.km)
-3 (0.0075sq.km)
-23 (0.046sq.km)
0.0798sq.km
SS Kulam Block
-2 (0.004sq.km)
10 (Surplus)
0 (Surplus)
-3 (0.006sq.km)
0.01 sq.km
Sultanpet Block
0 (Surplus)
3 (Surplus)
0 (Surplus)
-2 (0.004sq.km)
0.004sq.km
Sulur Block
-12 (0.024sq.km)
-3 (0.0009sq.km)
-3 (0.0075sq.km)
-20 (0.034sq.km)
0.0664sq.km
Thondamuthur
-2 (0.004
5 (Surplus)
-1 (0.0025
-2 (0.004
0.0105
Block
sq.km)
sq.km)
sq.km)
sq.km
Total Deficit in
-247 (0.494
-302 (0.0072
-14 (0.035
-164 (0.326
0.8622
LPA
sq.km)
sq.km)
sq.km)
sq.km)
sq.km
Inference of Gap and Area requirement assessment:
Orphanages and Old Age Homes: All planning zones report a surplus of orphanages and Old Age Homes. This indicates that the current infrastructure sufficiently caters to the population threshold of 5 lakh. However, it is to be noted that the existing data was obtained from open source and may have disparities. Post Offices: Post office infrastructure is in surplus across all planning zones.
Regulated Markets: A total deficit of 4 regulated markets is observed in the LPA. This corresponds to a land requirement of approximately 0.40 sq.km. Deficits are primarily found in Coimbatore North, Coimbatore South, and Madukkarai Taluks. This indicates a need to enhance formal market access.
Uzhavar Sandhai (Farmer Markets): There is a deficit of 2 units, requiring 0.20 sq.km of land. The shortfall is concentrated in Coimbatore North. This highlights the enhanced provision for decentralised farmer markets to support local agriculture and consumer access.
Libraries: A total deficit of 247 libraries has been identified across the LPA. The cumulative land requirement to bridge this gap is approximately 0.494 sq.km. The highest shortfall is observed within the Coimbatore Corporation area with a deficit of 186 libraries, followed by Town Panchayats (19 libraries) and Sulur Block (12 libraries). Spatially, the library infrastructure is relatively adequate in blocks such as Karamadai and Sultanpet, which exhibit no shortfall.
Anganwadi: The assessment indicates a total deficit of 302 Anganwadi centres across the LPA. The land required to address this shortfall is estimated at 0.0072 sq.km. The Corporation has the highest deficit with 257 centres, followed by Town Panchayats (15 centres) and PN Palayam Block (21 centres). Several blocks such as Annur, Karamadai, and SS Kulam exhibit surpluses.
Bank Facilities: The LPA reflects a cumulative shortfall of 14 bank branches. The total land area required for this amenity deficit is around 0.035 sq.km. Though the magnitude of the deficit is lower compared to other amenities, areas such as PN Palayam, Sulur, and Thondamuthur show gaps in banking access. The Corporation demonstrates a surplus, indicating that banking services are predominantly urban-focused.
Community Halls: A total of 164 community halls are deficient across the LPA. The estimated land requirement to meet this demand is 0.326 sq.km. The maximum gap is reported in Town Panchayats with 39 halls, followed by 35 in corporation (after deducting the existing community halls of 225 number), Sulur Block (20 halls) and PN Palayam Block (23 halls). The shortfall in community spaces is more pronounced in peri-urban and developing areas, which require enhanced public assembly infrastructure.
11.8 SWOT Analysis on Social Infrastructure
In conclusion, the total area required to meet the identified deficits in all socio-cultural amenities is approximately 1.88 sq.km. The Coimbatore Corporation contributes the largest share of the deficit both in terms of number of facilities and area required. Town Panchayats and blocks such as PN Palayam, Sulur, and Madukkarai also emerge as priority rural zones for intervention. Conversely, blocks such as Karamadai, Sultanpet, and SS Kulam exhibit minimal or no shortfalls, providing potential to balance spatial distribution of amenities through strategic planning.
The Detailed Project Report (DPR) for the proposed International Cricket Stadium in Coimbatore has been prepared. The project is being benchmarked against prominent national and international cricket stadiums to incorporate best practices in architectural design, operational efficiency, and user experience. Concurrently, the tendering process is in progress, with all requisite procedures being duly undertaken. This project is expected to serve as a significant milestone in the development of sports infrastructure in Coimbatore LPA and will contribute meaningfully to the promotion of cricket and other sporting activities in the region.
With the International Cricket Stadium proposal, the per capita open space is expected to increase by 0.06 sq.m per person, resulting in a total of 1.858 sq.m per person when combined with the existing infrastructures.
11.9.5.6 Medical Devices Testing Laboratory
The proposed Medical Devices Testing Laboratory in Coimbatore will be established on 1.28 acres of government land at Jeeva Nagar, Kavundampalayam. It will be a NABL-accredited facility equipped to test Category A and B medical devices, including in-vitro diagnostic equipment, as per the Medical Devices Rules under the Drugs and Cosmetics Act. The facility will house advanced equipment for chemical, biological, and performance testing. The initiative is part of the Strengthening of State Drug Regulatory System scheme and aims to improve regulatory compliance and quality assurance within the state’s healthcare system.
To ensure responsible use and long-term sustainability of mini libraries at both terminals and community parks, the following measures are recommended:
Facilitate access for students through student passes to promote youth engagement.
Introduce minimal or nominal user fees for the general public to ensure accountability and support operational costs.
Adopt a membership-based model to monitor usage and enable service enhancements.
This initiative promotes inclusive, knowledgeoriented urban development and optimizing the use of public infrastructure for educational and community benefit.
- B.E in Robotics & Automation Engineering
- B.Tech in Semiconductor Fabrication Technology
Master's Level
- M.Tech in Advanced VLSI & Chip Design
- M.Sc in AI-Enabled Embedded Systems
- MBA in Electronics Product Management
4. Medical Electronic Devices & Equipment
Bachelor's Level
- B.Tech in Biomedical Imaging & Diagnostics
- B.Sc in Healthcare IoT & Wearable Devices
Master's Level
- M.Tech in Medical Robotics & Surgical Systems
- M.Sc in Biomedical Data Analytics
- MBA in Medical Device Regulatory Affairs
5. Agro & Food Processing
Bachelor's Level
- B.Tech in Precision Agriculture & Agri-Tech
- B.Sc in Food Safety & Quality Assurance
Master's Level
- M.Tech in Advanced Food Biotechnology
- MBA in Agri-Business & Supply Chain Optimization
- M.Sc in Sustainable Packaging & Cold Chain Management
11.10 Future Ready Social Infrastructure:
The proposed action plans for the Coimbatore LPA are strategically aligned to leverage existing strengths, address critical weaknesses, capitalize on emerging opportunities, and proactively mitigate potential threats. Building upon the district’s commendable momentum on human development indicators and its established urban networks in healthcare and education, the recommendations aim to enhance equitable access and service delivery across both urban and rural areas.
To address existing disparities—particularly in rural and peri-urban areas—the action plan proposes the decentralization of key infrastructure through the establishment of new taluk-level hospitals, veterinary healthcare facilities, and fire stations, thereby narrowing the urban–rural divide in healthcare, safety, and education services. Simultaneously, it seeks to harness opportunities for academic and skill-based advancement by introducing Institutes of National Importance, additional medical colleges, and upgraded skill development infrastructure aligned with emerging sunrise sectors.
Potential threats, such as limited recreational open spaces and constraints on land availability, are addressed through proposals such as relocation of Jail, the Semmozhi Poonga and the International Cricket Stadium—which serve dual roles in optimizing land use and improving overall liveability.
These proposals collectively lay the groundwork for a resilient and socially inclusive future, ensuring equitable access to healthcare, education, safety, and socio-cultural facilities across LPA. In doing so, they also align with Tamil Nadu’s $1 trillion economy vision by promoting inclusive growth and improving quality of life for all segments of the population.
Under safety and security:
The key proposals include the relocation of the existing jail facility and the establishment of new fire stations to ensure equitable spatial distribution of emergency services across the LPA.
In recreational and open space facilities:
The short-term proposals include the development of Semmozhi Poonga, an International Cricket Stadium and International Hockey Stadium, enhancing urban liveability. With the implementation of all three proposals, the per capita open space is expected to increase by 0.107 sq.m per person, resulting in a total of 1.905 sq.m per person when combined with the existing infrastructures.
For socio-cultural development:
Mini-library proposals are phased progressively to meet the demand of the projected populations—libraries at the Railway Junction and 63 community parks in the short term, to 3 new terminals and 47 community parks in the medium term, and ultimately to 80 community parks in the long term, strengthening cultural engagement and public access to knowledge resources.
This phased implementation approach not only addresses current deficiencies but is also designed to accommodate the anticipated growth in population and service demand. By aligning each phase with identified infrastructure gaps and projected demographic trends, the proposals/recommendations ensure that Coimbatore LPA evolves into a resilient, socially inclusive, and future-ready progressive space.
12.1 Introduction
Housing is a basic necessity, along with food and clothing. Access to adequate housing is considered a basic right and is a key requirement to achieve a comprehensive improvement in the quality of life of citizens. Housing is also a key component to fuel the economic growth and its spatially balanced pattern of development. Safe, secure, and affordable housing enriches communities with increased opportunities for access to employment and educational opportunities, leading to an improved quality of life and a better civil society. Housing also plays a vital role in fostering social inclusion, promoting economic opportunities, and shaping the physical and cultural landscape of a city. Adequate housing encompasses more than just four walls and a roof, it includes access to essential services such as clean water, sanitation, and reliable infrastructure that makes the houses liveable.
This Chapter examines the existing housing situation within the planning area, providing a comprehensive overview of current housing conditions. It analyses key characteristics such as housing typologies, tenure patterns (owner-occupied vs. rental), age and condition of housing stock, affordability, and spatial pattern of distribution across the region. Identification of the extent of prevalent housing challenges, including issues related to overcrowding, inadequate infrastructure, and accessibility, is also in focus. Furthermore, it also explores the current dynamics of the housing market, considering factors like population growth, migration patterns, and economic influences on housing demand and supply. This assessment serves as a foundation for developing housing strategies and policies to ensure access to safe, affordable, and suitable housing for all residents within the planning area.
Housing demand in Tamil Nadu, particularly in Coimbatore, is being driven by both population growth and increasing migration to urban centres in search of better employment opportunities. Rapid industrial expansion, access to increasing quality educational institutions, and improved urban infrastructure complement each other in propelling employment opportunities and increasing in-migration into the Coimbatore region. There is a significant clarity that to sustain the momentum of growth, adequate and affordable housing is a prerequisite and it deserves special consideration in addressing the essentials in a city for improving its liveability.
12.2 Current Housing Scenario
The first master plan of Coimbatore (1994) noted that the pattern of residential development in the Coimbatore LPA followed the most common pattern observed in other urban areas of Tamil Nadu - high densities in the older parts and low density in the newly planned developments, particularly in peripheral areas. The newly planned areas had better street patterns and shaped plots, whereas older parts, which were primarily spontaneous/ organic developments, were supported by context-based infrastructure developments later. The pattern of development was already evident along the transportation lines, and accordingly, future developments were also formulated in consonance with the same.
Coimbatore, at present, is experiencing a vibrant growth in all sectors. Over the last two decades, diversification of its industrial base from its earlier textile and pump industries base to include IT and ITes sectors, major infrastructure upgrades such as the Coimbatore International Airport, and improved road connectivity have boosted real estate development/sales. At the city scale, the spatial patterns of location of activities need to be taken into cognisance to appropriately address the issues of demand and supply of housing in due regard to the income groups and affordability, overcrowding in core urban areas, evolution of slums, and need for infrastructure upgradation. As cities grow and evolve, addressing housing needs becomes increasingly complex, requiring innovative solutions and collaborative efforts to ensure equitable access to safe, affordable, and sustainable housing options for all. This plan envisages addressing such critical issues in consonance with the emerging growth patterns in Coimbatore, through measures for the delivery of affordable and adequate housing.
As of 2011, the Coimbatore district had a total population of 34,58,045, with 9,58,035 households (Table 12.1), with the average household size working out to 3.6. There has been a declining trend in the household size over the years, which was 3.8 in 2001, declined by 0.2 in 2011.
Table 12.1Population and Household of Census 2011
Coimbatore
Population
Households
Household
District
2011
2011
size 2011
Urban
26,18,940
7,15,878
3.66
Rural
8,39,105
2,42,157
3.46
Total
34,58,045
9,58,035
3.60
Sources: Census of India, 2011
As per census 2011, Coimbatore Local Planning Area (LPA) had a population of 24,57,452 and 6 , 7 3 , 0 3 3 households with the average household size being 3.6. The LPA accounted for about 70 % of the district’s households. As per the assessment by the constituent Local Bodies of the LPA, the population in 2024 has been of the order of 37,15,957. The Multiple Indicator Survey in India, NSS report no.589 (78/5.1/1), 2020-2021, indicates that the average household size in Tamil Nadu was 3.5 (3.4 in urban areas and 3.7 for rural areas). Accordingly, based on an average household size of 3.4, the households for the assessed population in 2024 are estimated to be 10,02,929, as mentioned in the Table 12.2 registering an increase of 62.4% with respect to the number of households from 2011 to 2024. The trends demonstrate a period of accelerated urbanization and declining household size, underscoring the need for appropriate approaches to accommodate the expanding population and evolving household dynamics.
Table 12.2Existing Households Details in LPA
Coimbatore LPA
Population2011
Households2011
Household Size 2011
Population2024
Households2024 (@3.4persons per household)
Increase in No. of Household
Corporation
15,84,719
4,26,482
3.72
22,97,839
6,75,835
58.5%
Municipality(4)
1,39,444
38,913
3.58
1,81,065
53,254
36.9%
Town panchayat(21)
3,03,834
85,686
3.55
4,54,271
1,33,609
55.9%
Revenue village (66)
4,29,455
1,21,952
3.52
7,82,782
2,30,230
88.8%
Total
24,57,452
6,73,033
3.65
37,15,957
10,92,929
62.4%
Source: Census of India, 2011, Population 2024 (Coimbatore City Municipal Corporation), 2024 HH projected
Map 12.2: Density of households 2011
DENSITY OF HOUSEHOLDS 2011
12.2.1.2 Distribution and Density of Households 2024
The increase in number of households and its spatial distribution exhibit an increased residential development along the major roads and closer to the corporation boundary as presented in Map 12.3. Facilitated by the concentration of employment opportunities and aligned with the growth corridors to major cities of the Coimbatore region, the north and eastern parts of the LPA with substantially growing as compared to the southern side, which is constrained by natural barriers to some extent.
Table 12.4Density of Households 2024
Coimbatore LPA
Population2024
Households2024
Household Density 2024
Corporation
22,97,839
6,75,835
2,621
Municipality
1,81,065
53,254
546
Town panchayat
4,54,271
1,33,609
424
Revenue village
7,82,782
1,33,609
267
Total
37,15,957
10,92,929
714
Sources: Urban Local Bodies
The household density in the municipal corporation as of 2024 is 2621 per sq.km., as against 1654 in 2011. The growth of households during this period in municipalities is 36.8% (increased from 399 to 546 households per sq.km), town panchayats 55.8% (272 to 424 households per sq.km) and in respect of Revenue villages 88% (142 to 267 households per sq.km) during 2011 to 2024 is mentioned in Table 12.14.
In regard to the spatial pattern of household concentration as of 2024, the core areas (wards) of the municipal corporation depict a higher level of household concentration is exhibit in the Map12.5. The ward-wise density distribution in the Municipal Corporation is depicted in Map 12.6. Among all the wards within the Coimbatore Municipal Corporation, Ward 32 (proximity to Central Business District (CBD), ward 41(P.N Pudhur having Tamil Nadu Agriculture University and few MSME industries), ward 44 (KK Pudhur), ward 45 and 47 (located in proximity to CBD) have higher household densities as presented in Map 12.4.
Map 12.3: Distribution of Households 2024
DISTRIBUTION OF HOUSEHOLDS 2024
Map 12.4: Density of Households 2024
DENSITY OF HOUSEHOLDS 2024
Map 12.5: Distribution of Households 2024 (Corporation)
Distribution of Households 2024 (corporation)
DIRECTORATE OF TOWN & COUNTRY PLANNING - TAMIL NADU
DIRECTORATE OF TOWN & COUNTRY PLANNING - TAMIL NADU
DIRECTORATE OF TOWN & COUNTRY PLANNING - TAMIL NADU
DIRECTORATE OF TOWN & COUNTRY PLANNING - TAMIL NADU
DIRECTORATE OF TOWN & COUNTRY PLANNING - TAMIL NADU
DATA SOURCE Coimbatore City Municipal Corporation
DATA SOURCE Coimbatore City Municipal Corporation
DATA SOURCE Coimbatore City Municipal Corporation
DATA SOURCE Coimbatore City Municipal Corporation
DATA SOURCE Coimbatore City Municipal Corporation
SCALE 0 0.4250.85 1.7 2.55 3.4 Km PROJECTION : UTM ZONE 43N DATUM : WGS 1984
SCALE 0 0.4250.85 1.7 2.55 3.4 Km PROJECTION : UTM ZONE 43N DATUM : WGS 1984
SCALE 0 0.4250.85 1.7 2.55 3.4 Km PROJECTION : UTM ZONE 43N DATUM : WGS 1984
SCALE 0 0.4250.85 1.7 2.55 3.4 Km PROJECTION : UTM ZONE 43N DATUM : WGS 1984
SCALE 0 0.4250.85 1.7 2.55 3.4 Km PROJECTION : UTM ZONE 43N DATUM : WGS 1984
DIRECTORATE OF TOWN & COUNTRY PLANNING - TAMIL NADU
DIRECTORATE OF TOWN & COUNTRY PLANNING - TAMIL NADU
DIRECTORATE OF TOWN & COUNTRY PLANNING - TAMIL NADU
DIRECTORATE OF TOWN & COUNTRY PLANNING - TAMIL NADU
DIRECTORATE OF TOWN & COUNTRY PLANNING - TAMIL NADU
Map 12.6: Density of Households 2024 (Corporation)
77°0'0"E
Density of Households 2024 (corporation)
29,882
Total number of evicted slums
64
Total number of houses allocated under JNNURM and AHP
9,762
In addition to the 214 slums under the RAY scheme, more slum pockets were also identified under various other schemes and missions of the government. A total of 64 slums were evicted and through schemes like JNNURM and Affordable Housing in Partnership (AHP) component, 9,762 houses have been allocated to rehabilitated slum dwellers by TNUHDB as mentioned in the Table 12.6.
The untenable slum areas in Coimbatore are categorized as such due to their high vulnerability to environmental and infrastructural risks. These settlements are located extremely close to water bodies, railway lines, and major roads such as state and national highways, making them unsafe for habitation. Slums like Uppiliar Thittu, Gandhi Nagar, Annaimedu, Periyar Nagar, V.O.C. Nagar, Karuppakal Thottam, Mullai Nagar, Echanari Railway Gate, and Sampath Street are exposed to frequent flooding, accidents and lack of infrastructure, rendering them unsuitable for in-situ development.
The Tamil Nadu Urban Habitat Development Board (TNUHDB) should prioritize the resettlement and rehabilitation of untenable slums in the above-mentioned location by identifying alternative sites. It should also undertake the rehabilitation of tenable slums through in-situ development in a phased manner.
Map 12.10: Location of Slums
Slums in Coimbatore City Municipal Corporation
DIRECTORATE OF TOWN & COUNTRY PLANNING - TAMIL NADU
DATA SOURCE Tamil Nadu Urban Habitat Development Board (Slums Identified in Rajiv Awas Yojana)
SCALE
0 0.4250.85 1.7 2.55 3.4 Km
PROJECTION: UTM ZONE 43N DATUM: WGS 1984
Kalaignar Karunanithi Nagar (SOP Ph - IV)
Reconstruction
360
Muthamizh Nagar (NOP II)
Reconstruction
460
Ukkadam Lake View (Slauter House)
Reconstruction
672
Total
1892
Sources: TNUHBD
12.2.9.2 Tamil Nadu Housing Board (TNHB)
The TNHB undertakes housing and area development schemes (consisting of plots) for EWS, LIG, MIG and HIG income groups. The projects by TNHB in Coimbatore LPA varied from individual houses, flats and plots through area development schemes as presented in the Table 12.9.
Table 12.9Housing Provided by TNHB
Projects
Tenements
Flats
2233
Individual Houses
4647
Area Development Schemes (Plots)
9311
Sources: TNUHBD
Spatially, the TNUHDB and TNHB implemented schemes are predominantly located in the core municipal corporation and on the periphery of the corporation boundary as shown in Map 12.11. The ongoing schemes are also located inside the corporation boundary as shown in Map 12.12. While these have addressed the issues of close proximity of housing units to the employment locations, in view of the growth envisaged in the outer areas, including factor of affordability, in the coming years, it is imperative that the focus area would move to the emerging areas of activity and population concentration expected in the coming years.
Map 12.11: Implemented Public Housing Scheme (TNUHBD & TNHB)
IMPLEMENTED PUBLIC HOUSING SCHEMES
Map 12.12: Ongoing Public Housing Schemes (TNUHBD)
ONGOING PUBLIC HOUSING SCHEMES
12.3 Housing Shortage
The housing shortage has been calculated based on the approach used in the Technical Group on Housing – XII Five Year Plan (TG 12) by the Ministry of Housing and Urban Poverty Alleviation, Government of India. This approach considers multiple factors, which inter-alia include deficit in housing stock against the existing number of households, number of Temporary Houses, shortage due to congestion (overcrowding) and shortage due to obsolescence.
Table 12.12Dilapidated Houses in LPA 2011
Condition
Corporation
Municipality
Town panchayat
Revenue village
Dilapidated
0.5%
1%
0.8%
1%
Dilapidated Houses
2,132
389
685
1219
Sources: Census of India, 2011
v. Keeranatham & Gudalur – Benefiting from IT sector spillover from Saravanapatti, driving residential and infrastructure growth.
In terms of the spatial patterns of approvals availed, the core corporation and expansion areas as high activity zones (more than 100,000 Sq. m):
Coimbatore Corporation received the highest approvals due to rapid urbanization, commercial growth, and increasing population density.
i. Vellanaipatti, located next to the corporation, is witnessing spill-over development, driven by its proximity to IT parks, industries, and improved connectivity.
The emerging residential and commercial hubs with moderate levels of approvals accorded (50,001 - 100,000 Sq.m) include the following:
i. Thenkarai, Madampatti, Veerakeralam, Vedapatti, Vellalur, Thudiyalur, Vellakinar, Chinnavedampatti, Kalapatti
ii. Kalapatti & Chinnavedampatti are near IT corridors, influencing high-rise approvals.
iii. Vellalur is near the Integrated Bus Terminus, making it a key transit-oriented zone.
iv. Thudiyalur & Vellakinar are along the Coimbatore-Mettupalayam corridor, which is seeing increasing urban development
These Villages are experiencing moderate approvals due to:
Proximity to Coimbatore city and arterial roads (NH-544 & NH-81).
Presence of educational institutions, employment hubs, and logistics parks.
12.5 Household Projections
The slow-growth zones (lower approval areas with 1,000 - 10,000 Sq.m) include the villages of Arisipalayam, Myleripalayam, East Chitrachavadi, Somayampalayam, Keeranatham, Vilankurichi, Irugur, and Vadavalli. This could be attributed to
Limited infrastructure & basic amenities, making them less attractive for large-scale development.
Environmental constraints, such as hilly terrain (Vadapatti, Vadavalli) or waterbody proximity.
Lower land prices and less commercial interest, leading to slow real estate activity.
Irugur, despite being a railway hub, has limited approvals due to industrial zoning restrictions and lower housing demand.
Household projections have been attempted to assess the likely requirement of houses by the horizon period.
Table 12.14Projection of Household and Density 2041
Coimbatore LPA
Population 2041
Households 2041
Household density 2041
Corporation
39,03,784
12,19,933
4732
Municipality
3,05,996
95,624
980
Town panchayat
5,67,685
1,77,402
563
Revenue village
10,47,241
3,27,263
380
Total
58,24,706
18,20,221
1188
Based on the historical census data, the population for 2041 in the Coimbatore LPA has been projected as 58,24,706 comprising of 39,03,784, 3,05,996, 5,67,685 and 10,47,241 population in the corporation, municipalities, town panchayats and Revenue villages respectively as mentioned in the Table 12.14.
Accordingly, the households for the same were projected as 12,19,933, 95,624, 1,77,402 and 3,27,263 households with a density of 4844, 1030, 577, 374 in corporation, municipalities, town panchayats and Revenue villages respectively. The total number of households in LPA by 2041 is projected as 18,20,221 with a household density of 1,188 households per sq.km as presented in the Map 12.15. A gradual decline in the household size has been adopted with a household size of 3.2 from 2031 onwards (considering the HH size in 2011 was 3.6 and 2024 was 3.4 approximately). The spatial distribution of households continues to present a scenario of dense core with a noticeable growth along the major connecting roads as presented in the Map 12.14. Goundampalayam and Veerakeralam show possibilities for an increased density due to the existence of educational institutions and universities as well as the availability of social amenities and character of the area.
Map 12.14: Distribution of Projected Households 2041
DISTRIBUTION OF HOUSEHOLDS 2041
Map 12.15: Density of Projected Households 2041
DENSITYOF HOUSEHOLDS 2041
Total Built -up Area
79,14,69,000 sq. ft
Assumed FSI consumption (1.5 against the 2 permitted)
1.5
Land area required after applying FSI
52,76,46,000 sq. ft
Land area required after including plot coverage (adding 50%)
79,14,69,000 sq. ft
Land area requirement including infrastructure (adding 25% roads, 15% liveable spaces)
110,80,56,600 sq. ft
Total land requirement (converted to sq.km)
103 sq.km
Assuming 20% of the requirement will be built on the existing residential area
82 sq.km
Adding 20% of a permissible commercial space in residential landuse
98.9 sq.km
In case of FSl increase to 2.5, FSl 2 may be consumed, which will result in the requirement of additional residential land use to 74.1 sq.km, and if FSl is increased to 3.5 with likely consumption of 3, it may result in the requirement of additional area under residential land use to the extent of 49.4 sq.km
9: Total Residential Land Area Required fo
ided in the table below: It is to be noted that, for the estimation, the assumed FSI is 1.50 against ssessment details for the constituent units in terms of the Corporation, Municipalities, To
Category
re lEasxnididset uinnstgieal
HPoruo 2sj0ee4ch1toeldds
Total requirement (c Ho 3H on.4fs s Hi uidzHpeetsro oinfg2031 , 3.2upto 2041 )
Assuming ho avuesreahgoeld d E LeWHInGSsa,i,t ( 1 4y44-23. H2.%8%H%/ M IG and above)
B Rueils StT-iqdout.epa fnt altriaela
reLqaunidr fet adre Saq.
Land area r i sne cqcqo.luvu ftiedrre (iaandgdg aed pfit inlnoegtr50%)
Land area requirement in (af i irdnnadcs siltnuqrgdu.kic 2nmtg5u%re roads, 1 5% livable spaces)
r (eT tcqooout snaiqvrlee. lkmarmtneed)dnt
2A0s%su omf i tnhge w r tei rhlqeleus bii eerdxee bimsnuttieilitnang otl sn area
Adding 20% of a c r poe semspriamdmceieesnrstc iiniaiballle landuse
Corporation
1 1 5.28
1 21 9933
5,44,098
1 000
54,40,98,000
36,27,32,000
54,40,98,000
76,1 7,37,200
71
57
68
M unicipal ities
22.326
95624
42,370
1 000
4,23,70,000
2,82,46,667
4,23,70,000
5,93,1 8,000
6
4
5
Town Panchayat
57.97
1 77402
43,793
1 000
43,793,000
2,9 1 ,95,333
4,37,93,000
6,1 3,1 0,200
6
5
5
Revenue vi l lage
1 21 .8
327261
97,03 1
1 000
9,70,3 1 ,000
6,46,87,333
9,70,3 1 ,000
1 3,58,43,400
1 3
1 0
1 2
Consol idated LPA
3 1 7.376
1 820220
7,27,292
1 000
72,72,92,000
48,48,61 ,333
72,72,92,000
1 ,01 ,82,08,800
95
76
9 1
Housing shortage (calcu lated as per census 201 1 )
64,1 77
1 000
6,41 ,77,000
4,27,84,667
6,41 ,77,000
8,98,47,800
8
7
8.0
Total LPA
7,91 ,469
1 000
79,1 4,69,000
52,76,46,000
79,1 4,69,000
1 ,1 0,80,56,600
1 03
82
98.9
12.6 Proposal & Strategies
iv. Public sector to focus on weaker section housing: Utilising appropriate instruments such as financial tools like shelter charges, and the public sector institutions – TNUHDB and TNHB addressing this segment are critical. Promotion of publicprivate participation and exclusive private sector engagement through appropriate support is essential to achieve the significant quantum of weaker section/ affordable housing requirement. Prevention of Unauthorised Development: through strengthening enforcement measures and effective coordination between agencies to curb unauthorised colonisation with strict penalties is essential. Infrastructure upgradation in slum areas to make them livable needs to be prioritised.
v. Housing delivery to be systematically phased – numerically and spatially in LPA: With a significant growth in population projected by the horizon year, the housing delivery through multiple modes need to focus on the numeric as well as spatial distribution of housing development, in sync with the requirement projected during various intermittent years. The residential land requirement strategy has incorporated provision for accommodation of at least 20% of the projected additional households (projected households by 2041 minus existing households as of 2024) within the already developed residential areas.
vi. Densification in low-dense areas to achieve optimal density development: Adopt a strategy of densification of low dense areas to an optimal level, so that the additional residential land requirement
is minimal. Redevelopment of old Abadi areas and dilapidated housing can be encouraged and promote mixed-use development to optimise land use efficiently. Encourage Redevelopment and Revitalisation of old neighbourhoods, slums and dilapidated housing through formulation of special projects for such areas.
vii. Promote Mixed-use option in new developments: Encourage mixed-use in new developments to optimise land use, enhance connectivity and reduce reliance on private vehicles.
viii. Rental housing to be encouraged nearer to employment concentration areas: With more than half of the Coimbatore district population forming migrants, and the rapid increase in activities including educational and other social facilities, there is an evolving need for substantial quantum of affordable rental housing in proximity to the prominent work clusters, both within the core area and more so in peripheral locations. According to census 2001, the proportion of total migrant population in the Coimbatore district was 11.9% which increased to 54.4% in census 2011. This shows that the migrant population plays a key role in the demographic characteristics of Coimbatore. Hence provision of rental housing with focus on the migrant population is necessary. Implemention of “Rent-to-Own” model, where dwellers pay affordable rent, eventually contributing toward equity would encourage a transition to ownership. Extensive participation appropriate schemes in line with the ARHC programme should be evolved for Coimbatore and implemented in and around employment concentration areas to address the expected substantial increase in rental accommodation for migrant labour as well as for the population that would opt for rental accommodation rather than ownership.
ix. Women’s hostels to be promoted nearer to employment locations: The accommodation for women is largely concentrated in the core areas, while the educational institutions are spread across the LPA and IT industries are developing in
the north. Women’s housing facilities are needed in both northern and southern peripheral areas of the LPA, particularly near proposed transit corridors. Hostel accommodation could be developed under the Site Adjacent Factory Employee (SAFE) Accommodation scheme.
x. Night Shelters for the homeless: The projected number of night shelters should be placed in strategic locations in line with the expected congregation of homeless citizens. Based on the projected population for LPA in 2031 and 2041, assuming 100 beds in a shelter, a total of 42 shelters and 58 shelters respectively would be the requirement for 2031 and 2041.
xi. Spatial prioritization of residential accommodation in LPA: The spatial prioritization is to be aligned with the economic activity growth in the LPA. Accordingly, immediate emphasis should be to encourage residential developments in the existing developed residential zones within existing settlements. It is noted that the current density in the constituent units is lower than those recommended in the URDPFI guidelines and accordingly, in the initial years emphasis should continue on infilling of already developed residential areas. Parallelly, the newly proposed residential areas should be developed in sync with the development of economic activities as well as other employment generating developments. The metro Corridors, the ring road, the widened radial corridors would be parallelly developed with residential activities, to be in commensurate with economic activity development.
xii. Collaborative effort towards integrated economic and residential development : residential development requires collaborative effort in synchronization with economic activity growth, the residential activity development is a joint effort by public, private, joint, cooperative and individual sectors is necessary to ensure context-based cooperation among the collaborators. the rental housing option can be encouraged through provision of housing by the industries themselves by offering the residential land adjacent to the major industries.
HERITAGE CONSERVATION
13.1 Historical and Cultural background
The name Coimbatore comes from the Tamil Koyampuththoor, often shortened to Kovai. It is believed to have originated from Koyamma, a local tribal goddess, with the area once called Koyamma-pudur (town of Koyamma). This gradually evolved into Koyampuththoor. The British later anglicized it to Coimbatore.
The Coimbatore region has a rich history dating back to prehistoric times, as shown by the presence of cairns, dolmens, kistavens, and hero stones. During the Sangam Age, tribes like the Kurumbar, Kosar, and Malavar lived here, as recorded in literature and inscriptions. The area was part of Kongu Nadu, ruled by Kongu Velirs (chieftains), and had trade links with Rome, evidenced by Roman coins found in the region.
In the 3rd century, the Rashtrakurttas from Karnataka invaded and ruled much of Kongu Nadu for around 150 years (250–405 A.D.). They were succeeded by the Ganga dynasty, whose rule lasted nearly five centuries, though limited records exist. Later, Adithya I of the Chola dynasty annexed Kongu Nadu, and Rajaraja I strengthened administration by appointing viceroys. The Chola administrative system continued in various forms for nearly 400 years.
Following the Chola decline, Kongu Nadu was divided among the Pandyas, Hoysalas, and Chera rulers. While the Cheras held minimal influence, the Pandyas and Hoysalas administered through appointed Viceroys (Dandanayakas). In the early 13th century, Hoysala ruler Narasimha II asserted dominance in the region. Eventually, the Pandyas lost power to Malik Kafur, who established the Madurai Sultanate.
The Vijayanagar Empire regained control of the region through Kumara Kampanna’s expedition, ousting the Madurai Sultanate. During this time, the Umnathur chieftains governed northern Kongu Nadu under Vijayanagar authority until Krishna Devaraya’s reign. After Vijayanagar’s decline, the Madurai Nayakas gained independence, while the Wodeyars rose in Mysore. Both powers ruled parts of Kongu Nadu until their fall. By the late 18th century, the region came under the control of Hyder Ali and Tipu Sultan.
After Tipu Sultan’s fall, the region came under the East India Company, and Coimbatore district was officially established in 1800 A.D. While the 19th century was relatively quiet, the early 20th century saw Coimbatore grow into a
major textile and industrial hub. The freedom movement featured notable leaders like A. Ayyamuthu, E.V. Ramasamy Naicker, Subri, C.P. Subbiah, T.S. Avinashilingam Chettiar, and Tiruppur Kumaran. Alongside the political awakening, social reforms and trade flourished.
The timeline of significant events and the associated locations are given in Table 13.1
Table 13.1Chronology of significant events in Kongu region
Timeline
Settlements/locations
Events
1 AD
Perur, Vellallur Kongunad region Aiyyasamy Hills (10 A.D.)
● Perur was initially a forest of Peepal trees, it was home to the Irula tribe. The Patteeswarar temple built by Karikala Chola. ● Hosted a Roman trading settlement from the time of Augustus Caesar to Constantine. ● Exported spices, agricultural tools, cornelian jewellery, and cotton textiles to Rome. Around 500 Roman coins were found; Roman Senators' togas were sourced from here. ● Rock inscription mentions Rajakesari Peruvazhi (Kongu Peruvazhi), an ancient trade route linking east and west coasts via Palghat Pass, Perur, Vellalur, and Sulur.
1200 AD
Perur Nadu Kuvanpudur (weavers' village) Kongu Region (875-1200 AD)
● Irula tribe lived here and called it Kovanpudur after their ruler Kovan. His deity was Koniamman.; Kottaieswaran Temple ● Under Chola and Kongu Chola rule.
● Virundeeswaraar Temple ● Malik Khafur invasion; Rise of Vijayanagara empire; ● representative of Chikkadevarayar (1672-1704) ruled from the Madheraja Mahal.
Anglo-Mysore Wars ● 1st attack on the Coimbatore fort during Mysore war, Hyder Ali's chieftain, captured the fort from the British; 2nd attack by Colonel Fullerton. Fort recaptured by Tippu Sultan; The coming of British to Coimbatore; - 3rd attack: Gen Meadows from Trichy captured Karur and took over Coimbatore. ● Several houses and the fort were also destroyed. ● 4th attack. With the fall of Tipu Sultan, British took over the village of Kovanur, along the tea trade route. 1804 Coimbatore made district headquarters
Textile Revolution in the country; ● Cotton cultivation, trading and weaving were the major occupations in Coimbatore. Cotton sent to England for the textile mills there. With the increasing demand for cotton, the farmers took to cultivating it in a big way, and prospered. With Nilgiris becoming the summer capital, the British acquired several tea and coffee estates up the hills. ● Beginning of Industrialization in Coimbatore and sprawl of textile industries; ● Textiles and beginning of Independence movement; ● Golden era for Coimbatore mills ● Establishment of Secondary Industry to complement the Textile Industry
Textile Revolution in the country; ● Cotton cultivation, trading and weaving were the major occupations in Coimbatore. Cotton sent to England for the textile mills there. With the increasing demand for cotton, the farmers took to cultivating it in a big way, and prospered. With Nilgiris becoming the summer capital, the British acquired several tea and coffee estates up the hills. ● Beginning of Industrialization in Coimbatore and sprawl of textile industries; ● Textiles and beginning of Independence movement; ● Golden era for Coimbatore mills ● Establishment of Secondary Industry to complement the Textile Industry
13.2 Socio-Cultural Significance
Coimbatore, is a city with a rich socio-cultural fabric woven from centuries of migration, industrial growth, and communal harmony. Often referred to as the ‘Manchester of South India,’ owing to its rich history of ‘textile industries’.
Historically, Coimbatore attracted settlers from different parts of Tamil Nadu and neighbouring Kerala, Karnataka, and Andhra Pradesh.
The city’s economy transitioned from agriculture to a thriving textile and engineering hub by the early 20th century. This was facilitated by access to hydropower from the Siruvani and Bhavani rivers and the entrepreneurial zeal of the local populace. Notable industrial establishments like Lakshmi Mills and Stanes Mills played pivotal roles.
Coimbatore is also home to great personalities who left a lasting impact. Visionaries like G.D. Naidu, often referred to as the “Edison of India,” revolutionized the city’s industrial and educational sectors. In cinema, filmmakers like Pakshiraja and the establishment of studios such as Central Studio and Chamundeswari Studio brought fame and cultural recognition to Coimbatore as a filmmaking center.
Figure 13.1: Archival image of Raja street (1914); one of the oldest and most significant streets in Coimbatore, located in the Town Hall area, the historic commercial and administrative heart of the city.
13.3 Cultural Heritage fabric
Coimbatore actively supported India’s independence movement through the Swadeshi campaign, labor protests, and educational reforms. Leaders like T.S. Avinashilingam and C. Subramaniam played key roles. The city’s textile industry backed khadi promotion, and Gandhi’s visits inspired mass participation, making Coimbatore a significant center of nationalist activity in Tamil Nadu.
The city stands as a beacon of inclusive development, where tradition blends seamlessly with modern enterprise. It is this unity in diversity, alongside the contributions of its people, that continues to define the socio-cultural soul of Coimbatore. Coimbatore’s cultural identity is deeply rooted in its diverse communities and the occupations they embraced.
Coimbatore, with its rich legacy of cultural diversity and industrial dynamism, embodies a unique synthesis of tradition and progress. Its heritage is not confined to monuments or architecture alone, but extends deeply into the intangible fabric of community life - rituals, festivals, religious harmony, traditional occupations, and the pioneering spirit of its people.
The city’s cultural values-communal coexistence, entrepreneurship, and respect for tradition-are reflected in its heritage assets. The cultural heritage fabric is more than physical structures; they are living symbols of social history, economic shifts, and shared identity.
Coimbatore’s cultural heritage, reflects its vibrant past and the amalgamation of ancient traditions, colonial influences, and modern industrial progress. The intangible heritage and natural landscape continue to shape the region’s cultural identity. The broad classification of cultural heritage assets is presented in the following sub-sections:
6
Kovilpalayam
11 CE
Jain Sculpture
13.1390030,77.0295601
7
Karumathampatti
13 & 14 CE
Memorial Stone -3 Memorial Stones in same place
13.0952306,77.1541104
8
Pattanam
13-16 CE
Ancient Temple, Memorial Stones, Inscription
10.9890388,77.0518402
9
Ukkadam
15 CE
Pulikutti Memorial Stone
10.9892915,76.9679212
10
Arasur
15 & 16 CE
Pulikutti Memorial Stone, Memorial Stones- 4 Memorial Stones in same palce
13.093923,77.102001
11
Sundakamuthur
16 CE
Ancient Well with sculpture
10.9581591,76.9310260
12
Chennappachetti Pudhur
16 CE
Pulikutti Memorial Stone
13.1617366,76.9348737
13
Saminayakkan palayam
16 CE
Pulikutti Memorial Stone
13.1749943,76.9783141
14
Vellalapatti
16 CE
Pulikutti Memorial Stone
13.0969349,77.0698006
15
Pothanur
19 CE Colonial Period
Memorial Stone
10.9616830,76.9909852
Figure: 13.4: (a) Medieval period structures: Ancient well in Sundakamuthur village and (b) Commemoratives memorial stone in Arasur
Map 13.1: Pre Historic and Medival Period Sites
B. Religious structures
a) Temples:
The temples broadly represent Dravidian architectural styles influenced by the Chola, Pandya, Vijayanagara, and Nayak dynasties. The Hindu Religious and Charitable Endowments Department of the Government of Tamil Nadu has listed around 211 temples in the ‘Heritage Temple’ category (over 100 years old) in Coimbatore district. Of these, 37 are located within the Local Planning Area boundary. Notable ancient temples are:
Pateeswarar temple, Perur (1500 years old), Sangameswarar temple (Kottai near Ukkadam), Marudamalai Temple, Marudamalai Hills (1200 years old), Koniamman Temple, Town Hall (1000 years old), Kottai Easwaran Temple, Kottai, near Ukkadam (800 years old).
b) Churches:
There are 15 Roman Catholic ‘vicariates’ in Coimbatore district and few in the LPA. Number of historic churches is unknown, however notable Churches of South India (CSI) are CSI All Souls’ Church and CSI St. Mark’s Church.
c) WAQF properties:
Many Masjids, Dargahs, Madarasas and similar monuments associated with Islam are found in the region. however notable mosques are Athar Jamath Masjid and Kottai mosque.
d) Gurudwara:
Gurudwara Singh Sabha, located in the RS Puram area, is the city’s primary gurudwara and community center for the Sikh population in and around Coimbatore. It was originally built in 1970.
C. Colonial architecture
British-era buildings showcasing Gothic and Indo-Saracenic styles, characterized by pointed arches, stained glass windows, and ornate facades. Notable examples include administrative buildings, institutions, and schools such as the TNAU Agricultural College and Research Institute (1906), Clock Tower, Stanes High School (1862), Coimbatore Central Prison (1858), St. Michael’s School (1860), Coimbatore Corporation Building (1865), and Victoria Town
Hall (1892). This period also witnessed the establishment of early textile mills and warehouses, which featured utilitarian designs with exposed brickwork and high ceilings. Prominent examples include Lakshmi Mills and Stanes Mill (1911).
13.3.2.2 Protected and unprotected Heritage structures in LPA
There is one centrally/ASI protected site within the LPA, located in Chettipalayam. One rock painting site, is in the scheduled list of the State Department of Archaeology as shown in Table 13.3 and Map 13.1.
Table 13.3Heritage structures in LPA
Sl. No.
Administration/Organization
Nos.
Protection Status
Protected
1.
Centrally protected site by Archaeological Survey of India (ASI)
01
Mandapakkadu (structure with mound), Chettipalayam
2.
TN Hindu Religious and Charitable Endowments (HR&CE) listed heritage temples (100 plus years old)
35
Under HRCE's jurisdiction; 4 temples listed in ancient temples category
Unprotected
4
TN State Department of Archaeology (TNSDA)
01
In scheduled list rock painting, Kumittipathy
5
Coimbatore City Municipal Corporation
12
significant landmarks
Map 13.2: Protected Heritage structures under LPA
In addition to above, there are various efforts undertaken by various organisations which requires special attention . These are:
T.N.A.U. Agricultural College & Research Institute
St. Mark’s Church
GASS Forest Museum
Government Training School
Family Court
District Sessions Court
Coimbatore (English) Club
Victoria Town Hall
Athar Jamath Masjid
Forest College
Head Quarters Hospital
Table 13.4Religious Festivals with Community Spatial Involvement in LPA
Festival
Location / Temple
Month / Season
Key Spatial Involvement
Sri Koniamman Ther Thiruvizha
Sri Koniamman Temple, Town Hall
March (Panguni)
Chariot procession through central city streets; public participation from various neighborhoods
Panguni Uthiram Ther Thiruvizha
Perur Pateeswarar Temple
March-April (Panguni)
Chariot pulled along temple streets; community mandapams, roadside offerings, and traditional performances
Masaniamman Gundam Festival
Masaniamman Temple, Anaimalai
Thai / Panguni (varies)
Fire-walking ritual in temple complex; processions and community setup in surrounding areas
Vinayaka Chaturthi (Ganesh Visarjan)
Across Coimbatore; immersion at lakes
Aug-Sept
Installation of Ganesha idols in local pandals; large public processions and immersion at lakefronts
St. Michael's Cathedral and CSI Christ Church
Streets across the churches
Between March 20 and April 23
Good Friday 'Way of the Cross' procession.
Ramzan
Kottaimedu, Eshwaran Kovil Street
Eshwaran Kovil Street is central for the Muslim community; main mosque and many food stalls situated here.
Guru Nanak Jayanti (Guru Nanak Prakash Utsav)
RS Puram, Langarkana Road
On Kartik Purnima, October or November.
procession moving through major nearby streets in RS Puram and Sukrawar Pettai
13.3.3.2 Crafts and traditional practices
Significant intangible cultural heritage in and around the Coimbatore Planning Area are detailed below.
a) Sculpturing on Granite stone
This hereditary art, primarily centered in Thirumurugan Poondi near Tirupur—located on the Avinashi-Tirupur Road, approximately 45 km from Coimbatore and 5 km before Tirupur town—involves crafting sculptures for temples and for export. While recent specific data is limited, the continuity of this craft likely depends on demand from religious institutions and the export market.
b) Weavers of cotton sarees
Handloom weaving in Negamam and the surrounding villages has a rich history. Weavers are primarily concentrated in Negamam, located on the Pollachi–Palladam Road, approximately 45 km from Coimbatore and 10 km from Pollachi, on the southeastern side of the district. Negamam cotton sarees have received a Geographical Indication (GI) tag, highlighting their cultural significance. However, the number of active weavers has declined due to economic challenges, competition from power looms, and younger generations pursuing alternative employment opportunities.
c) Bamboo basket and screen making
Traditionally practiced at the intersection of Thadagam Road and near Gandhi Park, on the western side of the city,. Urbanization and reduced demand may have contributed to its decline in prevalence.
d) Terracotta pottery
Villages along Perur Road in the Alanthurai region, on the western side of the city, have historically engaged in terracotta pottery. Coir rope-making
Coir rope-making is practiced by a small group of families residing in Tamaraikulam, located on the Coimbatore–Pollachi Road, approximately 25 km south of the city. This area lies within a predominantly coconutgrowing belt. Ropes are traditionally made using handwheels. Although the current status of this craft is not clearly documented, the coir industry in India has generally faced growing competition from synthetic alternatives.
e) Hand-made gold jewellery
Handmade gold jewellery, crafted in traditional designs, is produced by skilled goldsmiths hailing from Kerala, Tamil Nadu, Karnataka, and Andhra Pradesh. These artisans have inherited and refined their jewellery-making techniques over generations. They are primarily based in the historic core of the city, particularly around Raja Street and Big Bazaar Street. Despite growing competition from machine-made jewellery and fluctuations in gold prices, there remains a consistent demand for handcrafted pieces— especially for custom orders and traditional designs.
13.3.3.3 Community celebrations and events
Table 13.5Community events in and around LPA
Community Expressions
Organiser
Events
Annual festival
Coimbatore Vizha (annual)
200+ events and 1,00,000+ attendees; Heritage Walks, Street Performances, Vizha Parade Food & Craft Exhibitions Open House at Institutions School and College Events Green Coimbatore Events Tech & Innovation Showcases Photo & Art Exhibitions Community Celebrations
Ukkadam Art District
Ukkadam
One of the three St+art art districts in Tamil Nadu and among seven across India, this initiative aims to make art accessible to all, especially those unlikely to visit museums or galleries. The goal is to transform public spaces into open-air galleries that are inclusive and engaging for all community members, including residents of government housing colonies and socio-economically challenged areas.
Figure: 13.7: Ukkadam Art District making art accessible to everyone and engaging community
13.4 Inferences
Cultural
11
Karamadai Ranganathar Temple
Religious
12
Koniaaman Temple
Religious
13
Kottai Mosque
Religious
14
Oxyzone Adventure Park
Recreation
15
Government Archaeological Museum
Cultural
16
Police Museum
Cultural
17
Masaniamman Temple
Religious
18
Puliakulam Vinayagar Temple
Religious
19
Thandu Marriaman Temple
Religious
20
Gandhi Park
Recreation
21
Baharathi Park
Recreation
22
Maharaja Theme Park
Recreation
23
Krishnampathy Lake
Recreation
24
Kumarasamy Lake
Recreation
25
Kurichi Lake
Recreation
26
Ukkadam Periyakulam Lake
Recreation
27
Valankulam Lake
Recreation
28
Selvachinthamani Lake
Recreation
29
Selvampathy Lake
Recreation
30
Singanallur Lake
Recreation
31
Narasampathy Lake
Recreation
32
Codissa Trade Fair Complex
MICE
33
Kasthuri Sreenivasan Culture Centre
MICE
34
KG Hospital
Medical
35
PSG Hospital
Medical
36
Sri Ramakrishna Hospital
Medical
37
GKNM Hospital
Medical
38
KMCH
Medical
39
Ganga Hospital
Medical
40
Government Medical College hospital
Medical
41
Experimenta Science Museum
Recreation
42
Regional Science Center and Museum
Recreation
43
PSG GRD Museum
Recreation
44
Butterfly Park
Eco-Tourism
45
Government Museum
Recreation
There is a diverse range of destinations within the Coimbatore Local Planning Area (LPA). A significant portion of the locations caters to recreation, with numerous lakes like Ukkadam, Singanallur, Valankulam, and six more identified. There is also a notable presence of religious sites, including Maruthamalai Murugan Temple (which falls just outside the west LPA), Perur Pateeswarar Temple, Eachanari Vinayagar Temple, and a mosque, Kottai Mosque. Additionally, the LPA offers cultural attractions such as the GD Naidu Museum, the Government Archaeological Museum, and the Police Museum. Along with eco-tourism options like the GASS forest museum, the Insect Museum, and botanical gardens were also explored. Finally, the table includes several medical facilities and a trade fair complex, indicating the area also serves as a hub for medical tourism and business events. Tourism in Coimbatore LPA is observed throughout the year.
Map 14.1: Tourist spots - Corporation
Tourist Spots - Corporation
Map 14.2: Tourist Spots Other Than Corporation
Most of the destinations are concentrated in the city center due to the presence of the old city and numerous lakes that were developed under the Smart City Mission as recreational spaces. A cluster of Lakes and recreational activities is observed. A cluster near the Tamil Nadu Agriculture University is observed with Museum facilities. Cultural tourism with Victoria Town Hall and Police Museum is observed in the CBD area. A cluster is also observed on the northern side with a concentration of hospitals apt for medical tourism facilities. MICE tourism potential is on the northeast side with cultural spaces and fair complexes. Maruthamalai Murugan temple falls just outside the boundary on the western side.
14.1 Introduction
Tamil Nadu, India’s second-largest economy and most urbanized state boasts a rich tapestry of natural and cultural attractions, including UNESCO World Heritage sites, grand Dravidian temples, and the biodiverse Nilgiris. As a crucial service sector, a well-planned tourism strategy is vital for fuelling Tamil Nadu’s continued economic progression by capitalizing on its unique geographical, cultural, and environmental strengths.
Coimbatore, embraced by the wildlife-rich and lush Western Ghats, is a UNESCO-recognized biodiversity hotspot. It is also notable for its magnificent temples, living testaments to a profound ancient heritage. The tourism sector in Coimbatore, embedded within the historically significant Kongu region, holds substantial potential to stimulate various allied economic industries such as hospitality, aviation, railways, banking, manufacturing, health, and education, particularly by leveraging its archaeological significance and historical temples.
Coimbatore’s identity is deeply intertwined with its ancient religious sites, such as the Perur Patteeswarar Temple, Maruthamalai Sri Subrahmanya Swamy Temple, and Koniamman Temple, which are believed to be the origin of the city’s name. Coimbatore consists of several museums, including the G.D. Naidu Industrial Exhibition, Gass Forest Museum, and Kasthuri Sreenivasan Art Gallery and Textile Museum.
Coimbatore also stands as a significant hub for medical tourism, consistently attracting individuals seeking healthcare from adjacent districts and the neighboring state of Kerala. Its hospitals are equipped with comprehensive multi and super-specialty facilities, offering treatment options for a wide range of medical conditions that adhere to international standards. Detailed information on various tourism types in the region is studied as follows.
14.2 Analysis
close collaboration between government and private hospitals, facilitated by intermediaries or facilitators who can bridge communication and logistical gaps. This collaborative approach can lead to standardized quality protocols, transparent pricing mechanisms, and streamlined processes that ultimately benefit both international patients and the local healthcare system, ensuring that the focus on medical tourism does not compromise the accessibility and affordability of healthcare for the domestic population.
Medical tourism famous hospitals give treatments like cardiology, orthopedics, ophthalmology, and cosmetic surgery in hospitals concentrated in the corporation. This is due to the medical facilities and equipment needed and the accessibility to the urban population. Wellness centers are both inside the corporation and also scattered in locations away from the urban locations for favorable conditions.
The Wellness Tourism Service Providers including Wellness Centres, SPAs and Wellness Tourism Facilitators (WTFs) i.e., Travel Agents and Tour Operators engaged in Wellness Tourism and Medical Tourism Service Providers (including Hospital and Medical Tourism Facilitators (MTFs) i.e., Travel Agents and Tour Operators engaged in Medical Tourism will be provided financial assistance as per the provisions of the Marketing Development Assistance (MDA) scheme administered by the Ministry of Tourism, Government of India for the Fairs/ Events/ Road Shows approved by the Ministry of Tourism, Niche Tourism Division.
All the sites have good connectivity from the city through various highways. A cultural tour of the city is within the corporate limits. Religious tourism requires travel from the Sri Perur Pateeswarar Temple in the city to Marudhamalai Murugan Temple on the west, to Karamadai Ranganathar Temple on the north, to Arulmigu Avinashi Lingeswarar Temple in the east in Tiruppur. Coimbatore acts as a transit point for treks and tours to the Vellingiri and Valparai hills.
2022
2023
2024
Domestic
48,25,700
76,92,131
77,64,324
Foreign
805
980
1,222
Grand Total
4826505
7693111
7765546
Figure 14.3: Tourist Footfalls in LPA
In 2022, destinations in LPA received approximately 4.8 lakhs of domestic footfalls and 805 foreign tourist footfalls. By 2023, there was a significant increase in both categories, with domestic numbers rising to around 76 lakhs and foreign numbers increasing to 980. This upward trend continued into 2024, where domestic tourist footfalls reached approximately 77 lakhs and foreign tourist footfalls peaked at 1222, indicating a consistent growth in tourism in LPA over the observed period.
Table 14.4Number Of Tourist Arrivals In The Coimbatore District In 2021
Name
Domestic
Foreign
Total
Coimbatore
49,04,167
1,172
49,05,339
Tamil Nadu
11,53,36,719
57,622
11,53,94,341
India
67,73,00,000
15,20,000
67,88,50,000
Source: Statistical Handbook of Tamil Nadu - 2021-22
Based on the provided data for the year 2021, Coimbatore district recorded a total of 49,05,339 tourist arrivals, with the vast majority being domestic tourists (49,04,167) and a relatively small number of foreign tourists (1,172). The total number of tourists in Coimbatore constituted a minor 0.72% of the total tourist arrivals in Tamil Nadu, which stood at 115.39 million. Furthermore, Coimbatore’s tourist arrivals represented an even smaller fraction of the total tourist arrivals in India, which reached 678.85 million.
DIRECTORATE OF TOWN & COUNTRY PLANNING - TAMIL NADU
DATA SOURCECoimbatore City Municipal Corporation Tamil Nadu Tourism Department
Table 14.6Number of Rooms required in the Coimbatore district in 2021
Domestic
Foreign
Total
2021 population
49,04,167
1,172
49,05,339
Overnight Stays (37%)
18,14,542
1,172
18,15,714
Avg no. of tourists in a room
2.5
1
-
No. of rooms per year
7,25,817
1,172
7,26,989
Avg duration of stay
1.14
2.14
-
No. of room days per year
8,27,431
2,508
8,29,939
Domestic
Foreign
Total
No. of rooms per day
2,267
7
2,274
Existing no. of rooms
3185
Surplus no. of rooms
911
Based on the analysis, there is a surplus of 911 rooms in the Coimbatore district. Considering an average of 24.08 rooms in a hotel according to the Tourism Survey report, there is a surplus of 38 hotels in Coimbatore. There is a large number of hotels concentrated in the corporation. This caters to the sudden inflow of tourists for festivals and those who consider Coimbatore a connecting city.
3
Gandhi Park
3
15
Gandhi Park
3
Kumarasamy Lake
3
16
Kumarasamy Lake
3
Puliakulam Vinayagar Temple
3
17
GASS Forest Museum
3
GKNM Hospital
3
18
Baharathi Park
3
KMCH
3
19
Ganga Hospital
3
Kurichi Lake
4
20
Ukkadam Periyakulam Lake
4
Selvampathy Lake
4
21
Selvachinthamani Lake
4
GASS Forest Museum
4
22
Selvampathy Lake
4
Baharathi Park
4
23
Puliakulam Vinayagar Tem-ple
4
Sri Ramakrishna Hospital
4
Gandhipuram Bus Stand
Gandhipuram Bus Stand
CBE Railway Station
CBE Railway Station
S. No
Name
Distance in km
Name
Distance in km
24
Insect Museum, TNAU
4
Ganga Hospital
4
25
TNAU Botanical Garden
4
Krishnampathy Lake
5
26
Krishnampathy Lake
5
Insect Museum, TNAU
5
27
Oxyzone Adventure Park
5
TNAU Botanical Garden
5
28
PSG Hospital
5
Oxyzone Adventure Park
5
29
PSG Hospital
5
Table 14.8Destinations covered by Airport and Singanallur Bus Stand
Airport
Singanallur Bus Stand
S. No
Name
Distance in km
Name
Distance in km
1
Kasthuri Sreenivasan Cul-ture Centre
1
Masaniamman Temple
1
2
Codissa Trade Fair Com-plex
2
Singanallur Lake
2
3
Masaniamman Temple
4
Oxyzone Adventure Park
4
4
Oxyzone Adventure Park
4
PSG Hospital
4
5
PSG Hospital
4
Kasthuri Sreenivasan Cul-ture Centre
4
5
World Centre for Tamil Culture
4
Puliakulam Vinayagar Temple
5
6
Singanallur Lake
5
Codissa Trade Fair Com-plex
5
Most of the prominent tourist spots can be covered from the Railway station and Central bus stand. Airport and Singanallur, which fall a little away from the city center cover fewer spots than that of ones at the city center.
Singanallur bus stand caters to the inflow of Madurai, Tiruchirapalli, Thanjavur, and Kumbakonam. People at Singanallur have to travel to the city center to access the major tourist spots. MICE tourism is prominent near the airport where only airport nodes cater to.
Map 14.5: Micro Tourism Coverage
Meso Tourism
Given that LPA’s major tourist attractions are situated 20 to 30 km from the city center, a 30 km trip from the center will likely only cover these specific destinations and possibly others along the way.
Table 14.9Tourist destinations along the axes
Maruthamalai Axis
Karamadai Ranganathar Axis
Avinashi Axis
Perur Pateeswarar Axis
Kumittipathy Axis
Gandhi Park
GASS Forest Museum
Thandu Mariaman Temple
Police Museum
Police Museum
Kumarasamy Lake
Baharathi Park
Government Archaeological Museum
Koniaman Temple
Koniaman Temple
Selvampathy Lake
Karamadai Ranganathar Temple
VOC Park
Victoria Town Hall
Victoria Town Hall
Insect Museum
GD Naidu Museum
Selvachinthamani Lake
Kottai Mosque
TNAU Botanical Garden
Oxyzone Adventure Park
Sri Perur Pateeswarar Temple
Ukkadam Periyakulam Lake
Vanabathrakaliamman Temple
Regional Science Center and Science Museum
Kovai Kondatam
Kurichi Lake
Maruthamalai Murugan Tem-ple
Kasthuri Sreenivasan Culture Centre
Isha Yoga
Eachanari Vina-yagar Temple
Codissa Trade Fair Complex
Kumittipathy Cave Art Paint-ings
PSG GRD Museum of Science and Technology
Maharaja Theme Park
Map 14.6: Meso Tourism Coverage
For convenient day trips, this analysis identifies tourist spots located along a single route. The main attractions on these axes are situated within 15 km of the city center. In total, five major axes extend from the city, each catering to different preferences for a day’s exploration.
Macro Tourism
The tourists reaching Coimbatore also plan for a day or a weekend trip to a farther destination such as Ooty or Valparai. The regional tourist spots are identified and marked in the map below. These points require further travel and longer stay than the previously analysed spots making these spots as macro tourism spots.
Table 14.10Tourist destinations in the clusters
Ooty
Vellingiri
Valparai
Tiruppur
Ooty
Vellingiri
Valparai
Arulmigu Avinashi Lingeswarar Temple
Coonoor
Malampuzha
Topslip
Thirumuganathaswamy Kovil Poondi
Kotagiri
Siruvani
Aliyar Dam
Andipalayam Lake
Burliyar
Adhi Yogi Statue
Sholayar
Khadarpet
Black Thunder
Vaidehi Falls
Aanamalai Tiger Reserve
Perumal Temple
Baralikkadau Eco Tourism
Netaji Apparel Park
Ooty is above Mettupalayam, in the north of Coimbatore LPA; Vellingiri is on the west; Valparai is in the south and Tiruppur is in the east. Coimbatore is surrounded by tourist destinations, most of which are hill stations and ecological tourism. These four hotspots contain several destinations making it apt for a day or weekend trip from Coimbatore.
Tourism Footfall: Being a major temple in the heart of Coimbatore, the Car Festival attracts a large gathering of locals and devotees. It can also draw some tourists interested in experiencing the local culture and religious fervor. Expect significant crowds within the city on these following days.
Aranganathar Temple Festival - Karamadai (March)
The Car Festival (Rath Yatra) at the Aranganathar Temple in Karamadai is a significant event for the local community. Lord Aranganathar is taken out in a grand procession on a decorated chariot.
Tourism Footfall: This festival primarily attracts devotees from Karamadai and nearby areas. While it might not draw a huge influx of tourists from far away, it will see a substantial increase in visitors to Karamadai during the festival.
Anthoniar Church Festival - Puliyakulam (May/June)
This is the annual festival of St. Anthony’s Church in Puliyakulam. It’s a significant event for the Christian community in the area, marked by special prayers, processions, and gatherings.
Tourism Footfall: The festival primarily attracts Christian devotees from the region. While it’s a significant religious event for the community, the tourism footfall is likely to be concentrated within the local Christian population and may not significantly impact general tourism numbers.
Lord Jagannath Festival - Organised by ISKCON (January)
This is the annual Rath Yatra (chariot festival) of Lord Jagannath organized by the International Society for Krishna Consciousness (ISKCON). It involves a procession of chariots carrying the deities of Lord Jagannath, Balabhadra, and Subhadra.
Tourism Footfall: ISKCON events often attract a diverse crowd of devotees, followers, and those interested in Indian culture and spirituality. This festival is likely to draw devotees from within Coimbatore and potentially other parts of Tamil Nadu and beyond, leading to a noticeable increase in visitors during the event.
Isha Yoga
February (three-day event)- Mahashivratri: It’s a nightlong festival that attracts several lakhs (hundreds of thousands) of people annually. In 2020, the seating area accommodated over a lakh people. The sheer scale of this event puts pressure on accommodation infrastructure in Coimbatore. Mahashivratri in 2025 was on February 26th.
September 3rd - Sadhguru Birthday: Devotees and followers often visit the Isha Yoga Center on auspicious occasions and days related to Sadhguru. His birthday would naturally attract a larger number of people wanting to be at the center on this special day.
Guru Purnima (June or July): This is a day dedicated to honoring the gurus and the tradition of spiritual guidance. Isha Yoga Center observes this day with special events and the presence of Sadhguru attracting a large number of devotees.
Table 14.11Annual Footfall
Year
2019
2020
2021
Footfall
22,97,781
6,49,869
3,48,832
Source: Tamil Nadu Tourism Department
Broaden MDA Eligibility: Consider extending the Market Development Assistance (MDA) scheme to a wider range of wellness tourism service providers, potentially streamlining the eligibility criteria based on recognized accreditation standards like those of NABH.
Foster Collaboration: Continue to actively engage with AYUSH, NABH, Wellness Tourism Service Providers, State Governments, and other relevant stakeholders to ensure a collaborative and holistic approach to developing the wellness tourism sector.
14.3 Tourism Projections
Prioritize NABH Alignment: Encourage all wellness centers seeking MDA to align their practices as closely as possible with the accreditation guidelines established by NABH to drive quality improvements within the industry.
Leverage Ancient Wisdom: Continue to emphasize and integrate India’s centuries-old wisdom and spiritual philosophy as integral components of the wellness tourism experience.
The masterplan development interventions are done for the projected 2041 population. In the case of tourism, the number of tourists visiting Coimbatore in 2041 is to be calculated, and services are provided. The tourism projections for 2041 are given below.
Table 14.12Tourist arrival projection for Coimbatore District
Year
2021
2031
2041
Domestic
49,04,167
1,27,20,146
3,29,92,783
Year
2021
2031
2041
Foreign
1,172
3,040
7,885
Total
49,05,339
1,27,23,186
3,30,00,668
To understand the future impact of tourism on Coimbatore LPA and to guide the development of effective proposals and strategies, it is essential to project tourist footfall to 2041, using the current 2024 footfall as a basis. The average growth rate considered was 10% for domestic and 10% for foreign, coinciding with the values indicated in the Tourism Policy note of 2022 - 2023. Similarly, Tourist inflow per year was projected using the previous years and also considering the state average for more accurate results. Number of hotels required for the year 2041 is calculated below.
Table 14.13Number of rooms in Coimbatore District for 2041
Domestic
Foreign
Total
Projected population 2041
3,29,92,783
7,885
3,30,00,668
Overnight Stays (37%)
1,22,07,330
7,885
1,22,15,214
Avg no. of tourists in a room
2.5
1
-
No. of rooms per year
48,82,932
7,885
48,90,817
Avg duration of stay
1.14
2.14
-
No. of room days per year
55,66,542
16,873
55,83,415
No. of rooms per day
15,251
46
15,297
Based on the projected tourist inflow, the number of rooms required in 2041 is 12,112. That would require an estimated 503 hotels. Based on the requirements and market forces, more hotels should be provided at the corporation and along the axis roads. This would ensure connectivity to the tourist sites and facilities.
Table 14.14Tourist footfalls at destinations projection
Year
2022
2023
2024
Projected footfall
2031
2041
Domestic
48,25,700
76,92,131
77,64,324
1,51,30,471
3,92,44,545
Foreign
805
980
1,222
2,381
6,177
Total
48,26,505
76,93,111
77,65,546
1,51,32,852
3,92,50,722
The annual tourist footfall in 2041 is projected to be around 4 Crore, 6 times that of 2024. The average per day tourist inflow in 2024 is 25,963 which has increased to 57,290 tourists. The projected increase in tourist inflow will require enhanced infrastructure, including improved connectivity and expanded facilities at tourist destinations.
Figure 14.4: Example of a bird watching podium and information board
Recommendations for the Coimbatore lake ecotourism trail are divided into infrastructure and strategy. They are:
Infrastructure:
Dedicated NMT Tracks: Separate, well-maintained cycling/walking paths with shade, rest stops, lighting, and signage.
• Bird Watching Hides: Strategically placed, camouflaged hides with basic amenities and informative signage at key points.
Eco-friendly Lakefront Access: Designated areas for low-impact activities like kayaking, non-motorized boating, and nature trails using natural materials.
• Essential Support: Eco-restrooms, drinking water stations, waste management, first-aid, and information centers.
Connectivity: Links to public transport, bike rentals, and designated parking
Strategies:
Sustainable Practices: Limit visitor numbers, promote low-impact activities, integrate environmental education, involve local communities, and share revenue for conservation.
Bird Watching Focus: Encourage citizen science, offer guided tours, conduct workshops, partner with ornithological groups, and provide seasonal birding information.
• Leisure Management: Zone activities, regulate permits (e.g., for boating/fishing), promote ecofriendly equipment, enforce waste reduction, and ensure safety.
Effective Promotion: Highlight unique aspects (ecotourism, birding), build a digital presence, partner with tourism agencies, aim for eco-certifications, and raise awareness about responsible tourism.
Essentially, build eco-friendly infrastructure that minimizes impact, prioritize bird watching and low-impact leisure, engage the community, and promote responsible tourism to protect the lakes and their biodiversity.
Enhance Learning Opportunities: Provide in-depth information through digital signage, audio guides, mobile apps, and interactive quizzes. Encourage storytelling to connect visitors emotionally with the exhibits.
Streamline Visits with Technology: Implement virtual queueing systems to reduce wait times, smart ticketing and self-service kiosks for efficient entry, and QR codes for easy access to information.
Gather and Act on Visitor Feedback: Use feedback kiosks or interactive screens to collect real-time insights and understand visitor preferences for continuous improvement.
Improving Accessibility and Inclusion:
• Prioritize Universal Design: Ensure physical accessibility with ramps, elevators, wheelchair rentals, and accessible restrooms.
Address Sensory Needs: Offer sensory-friendly areas, quiet zones, noise-canceling headphones, and control over lighting and sound in exhibits.
Provide Multi-Format Information: Offer materials in braille, large print, easy-to-read formats, and multiple languages. Utilize audio descriptions, captioning, and sign language interpretation.
Strategic Marketing and Promotion:
Leverage social media: Encourage visitors to share their experiences, create interactive content, and use relevant hashtags to increase visibility.
• Utilize Geofencing Marketing: Create virtual boundaries around your museum and nearby attractions to target potential visitors with ads and notifications.
Engage with Local Influencers and Publishers: Partner with local bloggers, websites, and media outlets to promote your museum.
Host Immersive Events: Organize special exhibitions, workshops, and events to attract new audiences and generate buzz.
• Develop a Strong Brand Voice: Communicate your museum’s unique story and values consistently across all platforms.
14.5 Strategies
Recommending an “Integrated approach for destination development” ensures the provision of core tourism products alongside essential ancillary requirements like connectivity, performing arts infrastructure, public health, hygiene, and safety in conjunction with the master plan.
Provide training and capacity building for local facilitators to enhance their professionalism and knowledge of Coimbatore’s medical offerings.
4. Enhance Awareness and Promotion of Coimbatore’s Medical Strengths:
Develop targeted marketing campaigns that highlight Coimbatore’s unique advantages in medical tourism, such as:
• Centers of Excellence: Showcase hospitals with specialized expertise (e.g., cardiology, orthopaedics,, oncology) and their internationally trained doctors.
Integrated Wellness Offerings: Promote the availability of Ayurveda, Yoga, and Naturopathy centers alongside modern medical facilities, leveraging Coimbatore’s spiritual and wellness heritage.
Cost-Effectiveness and Quality: Emphasize the affordability of high-quality medical care and accommodation options in Coimbatore.
• Connectivity and Accessibility: Highlight Coimbatore’s airport and transportation infrastructure.
Cultural and Leisure Attractions: Promote Coimbatore’s tourist spots (e.g., Siruvani Falls, temples, Anamalai Tiger Reserve) to encourage medical tourists and their companions to extend their stay.
Create multilingual promotional materials (brochures, website content, videos) specifically for international medical tourists.
Participate in national and international medical tourism exhibitions and conferences, representing Coimbatore as a distinct destination.
5. Strengthen Collaboration with Local Tourism and Hospitality Sectors:
Work closely with Coimbatore’s hotels and guesthouses to develop packages and services tailored to the needs of medical tourists and their families (e.g., airport transfers, special dietary options, extended stay discounts).
• Provide training to hotel staff on cultural sensitivity and the specific requirements of international medical travelers.
Promote collaborations between hospitals and local tour operators to offer curated wellness and tourism experiences for recovering patients and their companions.
6. Leverage Digital Platforms and Technology:
Develop a dedicated section on the official Coimbatore Tourism website for medical tourism, providing comprehensive information on hospitals, treatments, wellness centers, accommodation, and facilitators.
Create a user-friendly online portal for international patients to inquire about treatments, get cost estimates, and connect with healthcare providers and facilitators in Coimbatore.
Explore the use of telemedicine for pre- and post-treatment consultations to enhance patient convenience and follow-up care.
Support from Market Development Assistance (MDA) of the Ministry of Tourism can be used to strengthen the Medical and Wellness tourism facility in Coimbatore. By implementing these recommendations, the region can establish a more organized, data-driven, and effectively promoted medical tourism sector, benefiting healthcare providers, the local economy, and patients seeking quality and affordable care.
ECOLOGY & ENVIRONMENT
15.1 Introduction
The ecological and environmental profile of the Coimbatore Local Planning Area (LPA) is fundamental to its sustainable urban planning framework. This profile encompasses a diverse array of natural features, including topography, vegetation, water bodies, and ecologically sensitive zones. These elements collectively underpin ecological stability, support biodiversity, enable groundwater recharge, regulate microclimates, and enhance urban liveability. Coimbatore’s strategic location near the Western Ghats—a UNESCO World Heritage site renowned for its exceptional biodiversity—further enriches its ecological context, with scenic landscapes, waterfalls, lakes, hills, and wildlife sanctuaries contributing to the region’s environmental quality.
However, rapid urbanization, industrial expansion, and escalating resource consumption pose significant challenges to the region’s natural environment. These challenges include habitat degradation, water pollution, waste accumulation, air pollution, and increased climaterelated vulnerabilities. To address these pressures, this chapter presents integrated strategies aimed at preserving ecological assets and fostering sustainable development. These strategies encompass lake restoration, urban forestry expansion, hill area conservation, promotion of eco-tourism, sustainable agriculture practices, and resilient green infrastructure development. Aligned with national and state environmental policies, these measures seek to strengthen environmental governance, enhance climate resilience, and ensure the long-term ecological integrity and quality of life within the Coimbatore LPA.
Table 15.1Elemental Uniqueness of Coimbatore LPA
Element
Expression in Coimbatore LPA
Earth
Diverse geology: Archean gneissic-charnockite complex, bajadas and pediment plains; fertile red, black and alluvial soils underpin agriculture and construction.
Water
Noyyal River basin with a cascade of 29 traditional tanks and 24 major lakes (total capacity 473 M.cft); vital for irrigation, groundwater recharge and flood moderation.
Wind
Cool monsoon breezes via the 25 km-wide Palakkad Gap mitigate UHI; and it supports natural ventilation corridors in urban design.
Energy
High solar insolation (6 kWh/m²/day) is ideal for rooftop PV; abundant biomass and potential for small-scale hydro at reservoir outflows.
Space
Ecological corridors linking Western Ghats foothills to urban green spaces; uninterrupted forest-to-field transitions and reserved-forest.
Forest and Reserved Forests: Significant green tracts such as Thadagam, Anaikatti, and Boluvampatti Reserved Forests are visible, anchoring biodiversity and providing vital ecological services.
Fault Zones: A clearly marked Neo-Tectonic Fault zone signifies the region’s seismic sensitivity, underlining the importance of geo-sensitive zoning.
Hydrological Network: The Noyyal River and associated reservoirs, tanks, and lakes are shown, supporting urban water security and ecological conservative zones.
Land Use Typologies: Agricultural zones, green cover patches, dump yards, and quarries are differentiated to assist in land use planning and pollution control.
HACA Villages: Designated villages under the Hill Area Conservation Authority (HACA) are also mapped, indicating zones where development needs to adhere to stricter environmental guidelines.
Map 15.1: Environment Layout Map
15.2 Ecology
The ecology of the Coimbatore region, including the Coimbatore LPA, possesses unique ecological value due to its proximity to the Western Ghats. The Western Ghats mountain range is globally recognized for its biodiversity richness. This recognition is underscored by the UNESCO World Heritage listing, which acknowledges its immense importance in conserving the region’s unique biological heritage.
Coimbatore LPA is surrounded by the reserved forests that contributes to the ecological balance of the region. A variety of Flora and Fauna can be witnessed in the LPA region as a part of the transition zone in the Western Ghats. The LPA region is one of the important transition zone and its ecology is crucial for maintaining the balance of the climate.
The Ecology section is not a backdrop—it is the foundation of Coimbatore’s sustainable future. By embedding ecological intelligence into zoning, mobility, infrastructure, and housing policies, the Coimbatore Master Plan can ensure a city that thrives with nature, not despite of it.
The region’s ecological profile is shaped by:
Forest reserves in the west (e.g., Anaikatti, Booluvampatti)
• River systems and traditional tanks
• Hill slopes, riparian corridors, and urban green spaces
Wetlands, which act as ecological conservative zones.
These natural features are central to urban resilience, biodiversity, and climate adaptation, and form the backbone of sustainable development in the Master Plan.
Table 15.2Major Geomorphological Units within Coimbatore LPA
Ecological Function
Impact on Liveability
Air purification & climate regulation
Reduces heat stress and pollution-related diseases
Water security
Maintains aquifers, prevents water scarcity
Flood control
Wetlands and river act as absorb storm surges
Biodiversity
Supports pollination, pest control, and food systems systems
Green aesthetics & well-being
Enhances quality of life, promotes eco-tourism
According to a forest department study funded by the State Development Policy Council (SDPC), Coimbatore has 17.5% tree cover, which is spread over 4,514 hectares within the municipal corporation limits. Coimbatore’s tree cover spans approximately 55.7 Sq. km, accounting for 22.6% of the city’s total area. and food systems by the Confederation of Indian Industry’s Indian Green Building Council, states that Coimbatore has the highest per capita green space among six Tamil Nadu cities, at 46.6 sqm per person. The Coimbatore City Municipal Corporation (CCMC) is invested in expanding urban greenery, managing 412 parks, with 376 being prioritized for rejuvenation in 2025. Furthermore, prominent institutions such as Tamil Nadu Agricultural University (TNAU), Forest College Campus, Bharathiar University, and Gass Forest Museum allocate 10% of their total area to green cover, reinforcing ecological sustainability.
Green Cover Maps for 2017 and 2024 depict the spatial distribution of green spaces within the Coimbatore LPA in 2017 and 2024, highlighting the changes in green cover between these years. The maps show areas of increased green cover (afforestation, new parks), decreased green cover (urban development, deforestation), and stable green cover, based on a comparative analysis of satellite imagery derived from USGS SRTM data.
Table 15.4Analysis of Green Cover Changes (2017-2024):
Category
Description
Key Observations
Implications
Increased Green Cover
Areas where green cover has increased between 2017 and 2024 due to afforestation, park development, and urban forestry programs.
Afforestation in peri-urban areas, greening of newly developed residential areas, expansion of existing parks and gardens, and greening along major transportation corridors.
Positive impact on air quality, climate regulation, biodiversity, and recreational opportunities; contributes to UHI mitigation and enhanced urban resilience. Supports the city's commitment to surpassing WHO benchmarks for per capita green cover.
Decreased Green Cover
Areas where green cover has decreased between 2017 and 2024 due to urban development, agricultural land conversion, and deforestation.
Construction of new buildings and roads, conversion of agricultural land, illegal logging, and encroachment on forest land.
Negative impact on air quality, climate regulation, biodiversity, and water resources; contributes to UHI intensification and increased environmental degradation; requires urgent mitigation measures and stricter enforcement of environmental regulations.
Stable/Unchanged Green Cover
Areas where green cover has remained relatively stable between 2017 and2024.
Existing parks, reserved forests, and agricultural areas with minimal land use changes.
Indicates the effectiveness of conservation efforts and sustainable land management practices in these areas; requires continued monitoring and protection to prevent future degradation.
Table 15.5Comparative analysis of Green Cover in Coimbatore (2017-2024)
Category
2017 Area (sq km)
2024 Area (sq km)
Change in Coverage(%)
Hillock Area
5.0
4.5
-10.0% (Decrease)
Agriculture (Dry)
30.0
32.0
+6.7% (Increase)
Agriculture (Wet)
10.0
9.0
-10.0% (Decrease)
Vegetation Cover
15.0
14.0
-6.7% (Decrease)
Map 15.2: Green cover map for 2017
Map 15.3: Green cover map for 2024
15.2.1.2 Reserved Forests
The Coimbatore Local Planning Area (LPA) encompasses 3.29 sq. km of forest land within its jurisdiction. Additionally, it shares boundaries with several reserved forests and protected areas. These adjacent forested regions serve as crucial habitats for wildlife, aid in climate regulation, and support carbon sequestration efforts. The Reserved Forests (RF) around the Coimbatore LPA region are mainly Thadagam, Anaikatti and Booluvampatti.
Table 15.6Reserved Forests Adjacent to Coimbatore LPA.
S. No.
Name of Reserved Forest
Area (Hectares)
Key Environmental Roles
1
Bolampatty Block I
5,663
Biodiversity hotspot; watershed protection; habitat for endemic species
2
Bolampatty Block II
10,651.22
Large contiguous forest area supporting wildlife corridors; carbon sequestration
3
Bolampatty Block III
3,202.83
Adjacent urban areas; erosion control
4
Thadagam Addi Reserved Forest
4,878.2
Critical for groundwater recharge; supports diverse flora and fauna
5
Anaikatti South
1,822.63
Ecological corridor linking Western Ghats forests; supports elephant movement corridors
6
Anaikatti South Extension
469.45
Extension of core forest area; aids in habitat connectivity
7
Thadagam Block IV
7,057
Important for soil conservation; supports local climate regulation and biodiversity conservation
Source: Forest Department, Government of Tamil Nadu
Adapted to lower rainfall; important for preventing desertification and supporting drought-tolerant species.
Eastern parts of the LPA with lower rainfall regimes.
Supports aquatic biodiversity; crucial for water purification, flood mitigation, and habitat provision.
Along the Noyyal River banks and around tanks such as Perur, Ukkadam, and Singanallur within the LPA.
Source: Forest Department, Government of Tamil Nadu
The Western Ghats foothills adjoining Coimbatore LPA harbour tropical evergreen forests rich in endemic and rare species, forming vital ecological corridors and carbon sinks.
The mid-elevation zones predominantly support dry and moist deciduous forests, which contribute to biodiversity conservation and ecosystem stability.
The eastern dry zones feature scrub and thorn forests adapted to arid conditions, playing a role in land degradation control.
Riparian and wetland vegetation along water bodies enhances aquatic biodiversity and ecosystem services such as water purification and flood regulation.
Table 15.8Wild Plant Species of Coimbatore District
S. No.
Botanical Name
Family Name
Common Name
1
Abutilon hirtum
Malvaceae
Indian mallow
2
Abutilon indicum
Malvaceae
Monkey Bush
3
Alangium salviifolium
Comaceae
Hill sack tree
4
Albizia julibrissin
Fabaceae
Silk tree
5
Barleria cristata
Acanthaceae
Philippine violet
6
Blumea lacera
Asteraceae
Lettuce-Leaf Blumea
7
Calotropis gigantea
Apocynaceae
Crown flower
8
Calotropis procera
Apocynaceae
Giant milkweed
9
Catharanthus roseus
Apocynaceae
Cape periwinkle
10
Cleome gynandra
Cleomaceae
Spider Flower
11
Cleome rutidosperma
Cleomaceae
Fringed spider flower
12
Cleome viscosa
Cleomaceae
Asian Spider Flower
13
Coccinia grandis
Cucurbitaceae
Ivy gourd
14
Commelina benghalensis
Commelinaceae
Benghal dayflower
15
Cynodon dactylon
Poaceae
Bermuda grass
16
Delonix regia
Fabaceae
Royal Poinciana
17
Duranta erecta
Verbenaceae
Golden dewdrop
18
Evolvulus alsinoides
Convolvulaceae
Dwarf morning-glory
19
Ficus benghalensis
Moraceae
Banyan
20
Ficus religiosa
Moraceae
Arasamaram
21
Ipomoea obscura
Convolvulaceae
Obscure morning glory
22
Lantana camara
Verbenaceae
Lantana
23
Leucas aspera
Laminaceae
Tamba
24
Mesosphaerum suaveolens
Lamiaceae
Mint weed
25
Millettia pinnata
Fabaceae
Indian beech
26
Millingtonia hortensis
Bignoniaceae
Indian cork tree
27
Muntingia calabura
Muntingiaceae
Jamaica tree
28
Oldenlandia corymbosa
Rubiaceae
Old World Diamond-Flower
29
Peltophorum pterocarpum
Fabaceae
Copper pod
30
Perityle emoryi
Asteraceae
Emorya rocks rockdaisy
31
Phyllanthus amarus
Phyllanthaceae
Child Pick-A-Back
32
Pinus densiflora
Pinaceae
Japanese red pine
33
Prosopis juliflora
Fabaceae
Mesquite
34
Ruellia tuberosa
Acanthaceae
Cracker plant
35
Solanum surattense
Solanaceae
Wild Eggplant
36
Thunbergia erecta
Acanthaceae
Bush Clock Vine
37
Tridax procumbens
Asteraceae
Coat buttons
38
Datura metal
Solanaceae
Angel's trumpet
39
Euphorbia hirta
Euphorbiaceae
Asthma plant
40
Centella asiatica
Apiaceae
Pennywort
41
Jatropha gossypiifolia
Euphorbiaceae
Bellyache bush
42
Aira caryophylla
Poaceae
Silver hairgrass
43
Cyanodon dactylon
Poaceae
Bermuda grass
44
Amaranthus viridis
Amaranthaceae
Slender amaranth
45
Digera muricata
Amaranthaceae
False amaranth
46
Ceiba pentandra
Malvaceae
Cotton tree
47
Chloris barbata
Poaceae
Swollen finger grass
48
Tridax brocumbens
Asteraceae
Coat buttons
49
Opuntia ficus-indica
Cactaceae
Prickly pear
50
Aerva lanata
Amaranthaceae
Mountain knotgrass
51
Malpighia emarginata
Malpighiaceae
Barbados cherry
Source: Department of Botany, Kongunadu Arts and Science College, Coimbatore, Tamil Nadu
15.2.2.2 Fauna
The fauna of the Coimbatore Local Planning Area (LPA) is diverse, owing to its proximity to the Western Ghats, a global biodiversity hotspot, and the presence of multiple ecosystems including forested hills, wetlands, scrublands, and agricultural landscapes. The western fringes of the LPA, particularly the Boluvampatti, Velliangiri, and Marudamalai hills, form part of critical wildlife corridors that connect the Nilgiri Biosphere Reserve with other forest ranges in Tamil Nadu and Kerala.
Habitat loss, pollution, disturbance of nesting sites
Birds
Painted Stork
Mycteria leucocephala
Wetlands, lakes, rivers
Near Threatened
Habitat loss, pollution, disturbance of nesting sites
Birds
Grey Heron
Ardea cinerea
Wetlands, lakes, rivers, coastal areas
Least Concern
Habitat loss, pollution
Birds
Little Egret
Egretta garzetta
Wetlands, lakes, rivers, paddy fields
Least Concern
Habitat loss, pollution
Birds
Indian Roller
Coracias benghalensis
Agricultural lands, open woodlands, scrublands
Least Concern
Habitat loss, pesticide use
Category
Common Name
Scientific Name
Habitat Type(s)
Conser-vation Status (IUCN)
Key Threats/ Notes
Reptiles
Indian Rock Python
Python molurus
Forests, grasslands, scrublands, wetlands, rocky areas, near water sources
Near Threatened
Habitat loss, hunting for skin and traditional medicine, road mortality
Reptiles
Common Cobra
Naja naja
Varied habitats: forests, grasslands, agricultural areas, urban areas
Least Concern
Habitat loss, persecution, road mortality
Reptiles
Monitor Lizard
Varanus bengalensis
Forests, grasslands, scrublands, agricultural areas, near water sources
Least Concern
Habitat loss, hunting for meat and skin, traditional medicine
Amphibians
Malabar Gliding Frog
Rhacophorus malabaricus
Evergreen forests, riparian habitats, tree canopies
Least Concern
Habitat loss, deforestation
Amphibians
Indian Bullfrog
Hoplob-atrachus tigerinus
Wetlands, ponds, agricultural fields
Least Concern
Habitat loss, pollution, over-exploitation for food
Fish
Nilgiri Mystus
Mystus vittatus
Fast-flowing streams and rivers of the Western Ghats
Data Deficient
Habitat degradation, pollution, invasive species
Source: International Union for Conservation of Nature (IUCN)
Note: Conservation Status based on IUCN Red List of Threatened Species
The absence of Tigers (Panthera tigris tigris) in the fauna list does not indicate their absence in the region but rather reflects their current population distribution, conservation status, and the planning scope of the Coimbatore Master Plan. As per the conservator of forests, Coimbatore forest circle, Boluampatty, Karamadai, Madukkarai and Pillayar Valley are some of the forest ranges where big cats were sighted. Ongoing monitoring and conservation efforts are recognizing the increasing presence of Tigers in the broader Coimbatore forest landscape, with potential future implications for land use and biodiversity planning.
15.2.2.3 Ecological Hotspots
The Coimbatore LPA area boasts ecological activity which can be designated as hotspots due to their frequent recurrence. Ecological hotspots within the Coimbatore LPA are areas of significant biodiversity value, critical habitat, or unique ecological importance. These zones require focused conservation and management efforts to maintain their ecological integrity and the ecosystem services they provide.
The hotspots have been marked considering records of visible bird and animal species that have confirmed passage in the designated regions. The city’s outskirts serve as vital corridors for elephant movement between habitats. The Western Ghats in Coimbatore support both rich biodiversity and a dense human population, emphasizing the need for biodiversity conservation alongside sustainable and inclusive development.
The Map 15.4 identifies and delineates key ecological hotspots within the Coimbatore LPA, including the Boluvampatti, Velliangiri, and Marudamalai hills, the Noyyal River basin, Singanallur Lake, and other significant wetlands. Overlays include biodiversity data, habitat types, and conservation priorities.
Table 15.10Key Ecological Hotspots within the Coimbatore LPA
Hotspot Name
Description
Key Flora & Fauna
Threats
Conservation Priorities
Boluvam-patti, Velliangiri, and Maruda-malai Hills
Hill ranges forming the western and north-western fringes of the LPA; part of the Western Ghats foothills.
Strengthen protection measures; promote sustainable forestry; mitigate human-wildlife conflict; establish ecological corridors; involve local communities in conservation.
Noyyal River Basin
The river and its associated riparian ecosystems.
Diverse aquatic and terrestrial species; riparian vegetation; wetland birds; fish.
Pollution (industrial and agricultural runoff), encroachment, water extraction, habitat degradation.
Implement strict pollution control measures; restore riparian vegetation; promote sustainable agriculture practices; enhance water management; protect riverbanks from encroachment.
Singanallur Lake
One of the largest urban wetlands in Coimbatore.
Migratory and resident birds; wetland vegetation; fish; invertebrates.
Pollution (sewage and industrial discharge), siltation, encroachment, disturbance of bird habitats.
Implement lake restoration and management plan; control pollution; remove encroachments; create conservative zones; promote bird watching and eco-tourism; ensure community participation.
Source: Forest Department, Government of Tamil Nadu
ECOLOGICAL HOTSPOTS
Map 15.4: Ecological Hotspots map
15.3 Environment
The Coimbatore Local Planning Area (LPA), covering an expanse of 1,531 square kilometres, is characterized by its diverse environmental and urban features. Nestled within the Western Ghats, a globally recognized biodiversity hotspot, the region benefits from its proximity to the Nilgiri Biosphere Reserve and the Anaimalai and Munnar mountain ranges, which contribute to its ecological richness. The area experiences an average annual rainfall of 940 mm, primarily during the southwest and northeast monsoons, supporting its water resources such as the Noyyal River and interconnected lakes. However, urban expansion has led to challenges including groundwater depletion, encroachment on natural drainage channels, and the creation of urban heat islands. Key environmental initiatives under the Master Plan and Smart City proposals include the eco-restoration of lakes, improved drainage systems, and sustainable urban mobility solutions. These efforts aim to balance rapid urbanization with ecological preservation, ensuring resource sustainability and improved quality of life for its growing population.
7.
Kumaraswamy Lake
Kumarapalayam
11.95
19.89
190.00
8.
Selva Chinthamani Lake
Kumarapalayam
1.69
3.02
72.00
9.
Sottaiyandi Kuttai Lake
Perur
1.69
2.83
53.00
10.
Ganganarayansa-mudharam Lake
Perur
0.50
2.89
342.00
11.
Puttuvikki Lake (Perur Lake)
Perur
5.77
51.94
866.00
12.
Senkulam Lake (kuniyamuthur Lake)
Kuniyamuthur
5.78
30.51
486.00
13.
Kuniyamuthur Small Tank
Kuniyamuthur
14.59
0.09
486.00
14.
Periyakulam (Ukkadam Big Tank)
Coimbatore
27.85
69.95
1425.00
15.
Valankulam Lake
Ramanathapuram
21.22
27.88
870.00
16.
Kurichi Lake
Kurichi
16.24
60.00
452.00
17.
Vellalore Lake
Vellalore
11.60
15.00
327.00
18.
Singanallur Lake
Singanallur
30.50
52.27
845.00
19.
Odderpalayam Lake
Pallapalayam
92.83
10.77
117.00
20.
Kannampalayam Lake
Kannampalayam
1.60
2.40
58.00
21.
Irugur Lake
Irugur
13.26
7.98
69.00
22.
Neelambur Lake
Neelambur
195
24.76
334.00
23.
Sulur Big Lake
Sulur
22.54
17.94
522.00
24.
Sulur Small Lake
Sulur
65.68
14.54
522.00
Total
631.6
473.02
9821
Source: Noyyal River Basin (Source. WRO, PWD, Coimbatore)
The Coimbatore Local Planning Area (LPA) encompasses 24 major lakes with a total
catchment area of 631.6 sq. km and a combined storage capacity of 473.02 million cubic feet (M.cft). These lakes also support 9821 acres of ayacut (irrigated land), playing a key role in agriculture. Among them, Periyakulam (Ukkadam Big Tank), Singanallur Lake, Kurichi Lake, and Valankulam Lake stand out for their extensive water-holding capacities and significant irrigation benefits.
The major lakes in the Coimbatore LPA, along with their key characteristics, challenges, and management aspects, are detailed below:
Table 15.12Prominent Lakes within Coimbatore LPA
Lake Name
Area (Hectares)
Catchment Area Characteristics
Key Flora & Fauna
Challenges
Management/Restoration Initiatives
Singanallur Lake
~120
Primarily urban
Migratory birds, resident water birds, fish, and aquatic vegetation.
Pollution from sewage and industrial discharge, siltation, encroachment, habitat degradation, invasive species.
Desilting, sewage treatment plant installation, bund strengthening, habitat restoration, community participation in conservation efforts.
Ukkadam Lake
~60
Mixed (urban and agricultural)
Fish, aquatic birds, native vegetation.
Pollution from sewage, siltation, encroachment, loss of water holding capacity, eutrophication.
Desilting, bioremediation, constructed wetlands for sewage treatment, public awareness programs.
Perur Lake
~40
Primarily agricultural
Aquatic plants, fish, local bird species.
Encroachment, siltation, pollution from agricultural runoff, loss of traditional water management practices, weed infestation.
Restoration of feeder channels, desilting, promoting organic farming in the catchment area, community-based water management.
Valankulam
~30
Primarily urban
Aquatic birds, fish, urban-adapted vegetation.
Pollution from sewage, siltation, encroachment, reduced water flow, illegal construction in the catchment area.
Removal of encroachments, desilting, construction of a sewage treatment plant, beautification of the lakefront, public awareness campaigns.
Current Status
Heavily polluted, encroached, but critical for recharge and urban water flow
Tributaries
Kousika River, Perur stream, Sanganur Pallam, and several minor hill-fed pallams
Table 15.14Prominent Rivers with their Features and Significance
River / Stream
Origin & Course
Key Features
Ecological & Socio-Economic Signifi- cance
Urban Planning Highlights
Noyyal River
Originates from Vellingiri Hills (Western Ghats), flows eastward through Coimbatore city into Tamil Nadu plains
- Seasonal river - Heavily canalized and encroached in urban core - Inter-connected with 29 traditional tanks - Approximate length within the LPA region is 55km
- Main river draining Coimbatore - Historically part of Noyyal Basin tank system (Sangam era) - Recharges groundwater, supports irrigation
- Desilt and rejuvenate 9 major tanks (Periyakulam, Ukkadam, Valankulam) - - Reclaim encroached floodplains
Kousika River
Originates from Kurudi Hills (Western Ghats), joins Noyyal near Irugur
- Non-perennial stream - Flows through Kurichi and Sundakka-muthur - Approxi-mate length within the LPA region is 34km
- Acts as a recharge channel-Supports peri-urban agriculture
- Demarcate as conservation corridor - Introduce bio-swales in new layouts - Reconnect with lake systems (Kurichi, Kuniyamuthur tanks)
Sanganur Pallam
Urban stream flowing from Thudiyalur through central Coimbatore into Valankulam
- Heavily polluted - Often considered a drain today - Encroached along many sections - Approximate length within the LPA region is 23km
- Drains a dense urban watershed - Carries both storm water and sewage
- Restore as an urban waterway - Integrate into storm water management network- Set up decentralized STPs along its course
Sirimugai River
Tributary of Bhavani River, flows through rural northern LPA fringe
- Natural seasonal river - Less disturbed compared to others - Approximate length within the LPA region is 15km
- Supports traditional agriculture and biodiversity
- Preserve riparian vegetation - No-permit zone along critical stretches
Periya Pallam & Other Minor Streams
Series of feeder streams from foothills of Western Ghats (Anaikatti, Marudhamalai region)
- Seasonal stream - Forms headwaters of tanks and rivers like Noyyal - Approximate length within the LPA region is 12km
- Recharge aquifers - Prevent erosion on hill slopes
- Preserve as natural blue-green infrastructure - Ban culverting or channelizing in new developments
Table 15.15Planning Considerations for River Systems
Action Area
Recommendations
Hydrology Restoration
- De-channelize concrete sections - Promote infiltration zones using pervious paving and bio swales
Flood Risk Mitigation
- Create urban flood maps using historical discharge records - Build retention ponds in low-lying zones
Urban Green Linkages
- Align urban parks and greenways along riverbanks - Promote ecological corridors between tanks and rivers
Cultural and Heritage Revival
- Integrate historical tank and riverfronts (e.g., Perur Temple, Ukkadam lakefront) into urban design plans
Urban afforestation, decentralized recharge pits
Industrial Belt (Peelamedu, Kalapatti, SIDCO)
Shallow (<15 m) but highly exploited
Deep (>60 m) indicates aquifer depletion
Salinity risk, declining yields
Groundwater exhaustion risk
Strict bore well monitoring, promote closed-loop water systems
Source: Tamil Nadu Wetland Mission, Water Resources Department
Map 15.8: Aquifer Thickness (in Meters) map
Map 15.9: Aquifer Depth (in Meters) map
Planning & Conservation Highlights
Singanallur Lake
Eastern Coimbatore (urban fringe)
- One of the largest urban lakes-Receives urban runoff- Bird habitat
- Declared Bird Sanctuary-Supports 100+ bird species-Recharge zone
- Create eco-tourism zones- De-silt and prevent sewage inflow
Kurichi Lake
South-west Coimbatore, near Kuniyamuthur
- Fed by catchment runoff- Degraded due to encroachments and waste
- Seasonal irrigation source-Potential for groundwater recharge
- Restore wetland boundary- Integrate into storm water master plan- Promote reed-bed systems
Ukkadam Periyakulam
Central Coimbatore (near CBD)
- Historically part of Noyyal tank chain-Receives Sanganur Pallam flows
- Flood prone-Habitat for waterfowl and amphibians
- Lakefront development with nature trails- Urban wetland park model-Decentralized STP proposed
Valankulam Lake
Between Railway Junction and Sungam
- Narrow linear lake- High pollution - Adjacent to rail and road lines
- Urban lung space- Aquatic life presence despite degradation
- Interceptor drains to divert sewage-Revive walkway with ecological fencing
Perur Lake (Perur Kulam)
West Coimbatore near Perur temple
- Traditional irrigation tank-Receives catchment runoff from foothills
- Cultural-religious significance-Key to aquifer recharge downstream
- Protect from real estate encroachments-Promote temple tank linkage restoration
Sulur Lake
East Coimbatore near Sulur aerodrome
- One of the oldest lakes- Receives inflow from Noyyal tributaries
- Agriculture and fisheries support-Migratory birds (Painted Stork, Pelican)
- Ban solid waste dumping- Create wetland conservative zone under TN Wetland Mission
Kovaipudur Lake
West Coimbatore in Kovaipudur valley
- Seasonal hill-fed lake - Near forest edge and ecologically sensitive zone
- Local biodiversity hotspot - Natural recharge zone for Kovaipudur aquifers
- No new development within 100m-Integrated into eco-sensitive zoning of Master Plan
Source: Tamil Nadu Wetland Mission, Water Resources Department
Table 15.17Wetland Ecology
Name Wetland
Plants (Invasive)
Arthro-poda
Odo-nata
Lepido-ptera
Arach-nida
Fishes & Crusta-cean
Amphi-bians
Reptiles
Birds
Mam-mals
Kovai-pudur Lake
54(11)
4
5
9
2
12
2
2
41
5
Sulur Lake
77(14)
5
12
4
3
16
2
2
42
5
Singa-nallur Lake
45(11)
10
7
8
1
20
2
2
38
5
Perur Kulam
52(10)
5
9
6
2
14
1
2
40
4
Kurichi Lake
46(9)
4
8
7
0
13
2
2
39
4
Ukka-dam Lake
69(12)
9
8
15
0
12
2
2
38
4
Source: Tamil Nadu Wetland Mission
Table 15.18Planning for Wetlands
Theme
Planning Integration
Urban Water Security
- Integrate lakes into urban storm water networks - Use as recharge and flood moderation infrastructure
Biodiversity Corridors
- Connect wetlands via green-blue corridors for birds, butterflies, amphibians
Pollution Mitigation
- Decentralized sewage treatment units near inflow points - Eco-engineering (reed beds, phytoremediation)
Community Involvement
- Engage RWAs and schools in lake adoption programs - Encourage public reporting of violations
Aquifers under stress, deep groundwater extraction, risk of salinization and aquifer collapse
Immediate regulatory intervention needed; high potential for reuse systems
- Enforce mandatory RWH and treated wastewater reuse - Create zoning overlays restricting water-intensive development - Promote STP-fed urban parks
Lake margins (Singanallur, Kurichi), peri-urban wards with tanks
Seasonal recharge, but poor retention due to encroachments and pollution
Nature-based solutions (NbS) to be prioritized for restoring hydrological function
- Restore wetland and lakes - Introduce constructed wetlands for urban storm water - Develop community recharge parks
Source: Central Ground Water Board
- Use for water budgeting in development control - Introduce storm water master planning ward-wise
Wetlands and Marshes
Selvachin-tamani, Narasam-pathi, Krishnam-pathy
- Seasonally waterlogged depressions - Rich in aquatic biodiversity
- Provide natural filtration - Temporary flood sinks
- Restore hydrological connectivity to rivers and tanks - Monitor biodiversity under Tamil Nadu Wetland Mission
Source: Central Ground Water Board, TN WRD
Table 15.24Strategic Observations for Hydrology
Observation
Planning Implication
Water bodies are highly fragmented and some streams have lost connectivity
- Implement "reconnection" strategies with upstream-downstream tank revival
Natural slope favours drainage from west to east, but urban sprawl disrupts flow
- Introduce zoning overlays based on natural drainage - Build rain gardens and check dams along blocked routes
Encroachments and dumping throttle key pallams
- Enforce TN Building Rules.
Table 15.25Hydrology Map Interpretation
Water Flow Direction
Existing Water Basins
1 - Indus
A - Vaigai river catchment
2 - Ganges
B - Kaveri river catchment
3 - Brahmaputra
C - Pennar river catchment
4 - East flowing rivers towards Bay of Bengal
5 - West flowing rivers towards Arabian Sea
Majority of the rivers are east flowing and the rest are west flowing in Coimbatore LPA.
Map 15.10: Hydrology map
BASIN
CATCHMENT
WATERSHED
SUB-WATERSHED
HYDROLOGY
Tanks-Linked Valley Watersheds (Kurichi, Valankulam, Perur)
Inter-connected tank chains across southern and western flanks
Lake catchments with tank cascade heritage
Flood control, urban biodiversity support
Restore hydrological linkages in Master Plan zoning; integrate as nature-based sponge systems
Source: Central Ground Water Board, TN WRD
Table 15.27Insights from the Micro-Watershed Map
Insight
Implication for Planning
Watershed boundaries often transcend ward or village boundaries
Planning must consider hydrological, not administrative units for drainage and recharge interventions
Many watersheds are artificially disconnected due to encroachments or culverts
Storm water and lake rejuvenation must include catchment reconnection strategies
Hill-origin watersheds have cascading ecological and hydrological influence
Zoning in upper catchments impacts downstream lakes, aquifers, and flood plains
S. No
Year
Average LST (in degree Celsius)
1
1995
27.0
2
2000
28.5
3
2005
29.8
4
2010
30.2
5
2015
30.8
6
2020
32.25
7
2023
36.48
Source: Estimation of land surface temperature for Coimbatore District and Mitigation Strategies for Tamil Nadu, State Planning Commission, GoTN.
The Table 15.33 indicates a consistent rise in the average Land Surface Temperature (LST) in Coimbatore over the past three decades.
The average Land Surface Temperature (LST) in Coimbatore increased from 2 7 . 0 ° C in 1995 to 3 6 . 4 8 ° C in 2023, indicating a sharp 9 . 4 8 ° C rise.
• 88.68% of Coimbatore’s area is classified as heat hotspots ( L S T ≥ 3 2 ° C ) , affecting over 74% of the population.
Night-time LST analysis reveals that central and southern zones retain heat longer, exacerbating health risks and cooling demand.
Table 15.28Urban Forestry Initiatives
Component
Details
Planning and Ecological Significance
Key Actions & Highlights
Objective
Enhance urban green cover and biodiversity using native species
- Reduces Urban Heat Island Effect (UHIE) - Improves air quality and water infiltration
- Adopted under Smart City Framework (SCAF) - Integrated with TN Urban Greening Policy
Methodology
Miyawaki Forestry Dense, native forests grown with 2.5-3 ft spacing
- Preferred for parks, OSR lands, schools, and reclaimed dump yards
Key Implementing Partners
KKPA (Kovai Kulangal Padhukappu Amaippu), DHI Green Foundation, EFI (Environmental Foundation of India)
- Ensures community engagement - Reduces maintenance costs over time
- 83 projects across city zones - Over 19.8 lakh sq. ft. area planted
Notable Sites
- Vellalore Dumpyard (2.275 ha) - Jothi Nagar OSR (0.45 acre) - Anna University Campus
- Converted degraded land to dense canopies - Created biodiversity patches and cool zones
- Over 5,000 trees in Vellalore using native species - Improved soil retention and habitat regeneration
Quantitative Impact
- 15,005 trees - 18.43 hectares across 83 parks
- Exceeds WHO benchmark of 9 sq.m per capita green cover (Coimbatore: 24.4 sq.m)
- Supports climate resilience indicators for Smart City rankings
Urban forestry projects are carried out in the sites of the Anna University Campus (Coimbatore), Vellalore Dumpyard, and Jothi Nagar OSR reinforce Coimbatore’s commitment to ecological restoration and sustainable urban development.
An urban forest spanning 2.275 hectares is being developed in Vellalur Village (Survey No. 501/2A & 2B), with 5,000 saplings planted using the Miyawaki technique. This
method, which spaces trees 2.5 to 3 feet apart, promotes mutual growth and rapid afforestation, establishing a self-sustaining forest within a decade.
Figure 15.1: Growth of Urban Forestry in Vellalore Dumpyard
In Jothi Nagar, a 0.45-acre site was restored from waste land, where 1,590 indigenous saplings were planted. Over two years, the site transformed into a lush green canopy, enhancing biodiversity, urban cooling, and soil stabilization. The dense tree cover also aids in mitigating the urban heat island effect.
Figure 15.2: Growth of urban forestry in Jothi Nagar OSR
15.3.2.2 Hill Area Conservation Authority (HACA)
Villages situated along the western boundary of the Coimbatore Local Planning Area (LPA) have been designated under the Hill Area Conservation Authority (HACA) to preserve the ecologically sensitive Western Ghats. This designation aims to prevent environmental degradation, regulate landuse patterns, and protect the region’s biodiversity. Any form of development activity within these villages requires prior official approval, and unauthorized construction is strictly prohibited to maintain the ecological integrity of the area.
The conservation of these HACA-designated villages, as depicted in Map 15.12, plays a pivotal role in expanding green spaces, mitigating climate change impacts, preserving
native flora and fauna, and ensuring the long-term ecological sustainability of
Western part of Coimbatore LPA. These protected villages serve as buffer zones, reducing the pressure of urban expansion on the Western Ghats and enhancing the region’s climate resilience and water retention capacity.
Table 15.29HACA Villages in Coimbatore LPA
S. No.
HACA Village
Location
Details
Planning and Ecological Significance
1
Sundakka-muthur
Southwest Coimbatore
Situated near foothills and streams
Important for slope stability and forest connectivity
2
Gudalur
Southwest, near Perur
Adjacent to reserved forest buffer
Acts as buffer to wildlife habitats and recharge zones
3
Kalikkanayakkan-palayam
West Coimbatore
Transition zone between city and forests
Limits urban encroachment into hilly tracts
4
Ettimadai
Southwestern boundary
Close to Kerala border and Western Ghats
Critical for biodiversity corridor and aquifer recharge
5
Puluvapatti
West of city
Hill-edge village with agricultural base
Protects watershed feeding Kurichi tank
6
Thondamuthur
Western Coimbatore
Gateway to Western Ghats and trekking trails
Essential for hill conservation and tourism regulation
7
Narasimanaya-kkanpalayam
West-central Coimbatore
Undulating terrain and seasonal streams
Preserves headwaters for urban drainage
8
Veerapandi (Part)
Northwest fringe
Low hills and forest margins
Prevents quarrying and encroachment near forest lands
9
Madhampatti
Western corridor
Hill-fed runoff and farmlands
Critical recharge zone and scenic buffer
10
Nayakkan-palayam
Western outskirts
Proximity to stream-fed gullies
Supports riparian buffers and forest edge integrity
11
Theethipalayam
Southwest edge
Gentle slopes with peri-urban growth
Requires slope protection and afforestation
12
Somayam-palayam
West-central Coimbatore
Connected to forest-fed canals
Urban-rural fringe needing growth control
13
Nanjunda-puram
South-central zone
Mixed-use with nearby tanks
Supports lower wetland drainage from hills
14
Perur Chettipalayam
West-central
Culturally significant near Perur temple
Preserves temple tanks and groundwater fed by hills
15
Chinnathadagam
Western buffer zone
Large-scale farmlands near forest margins
Key to preventing landscape fragmentation
16
Devarayapuram
Hill slope near Madukkarai
Steep terrain, forest edge
Vulnerable to erosion; restrict urban sprawl
17
Ikkarai Boluvampatti
Near Anaikatti
Low-density, forest-interfacing zone
Part of elephant corridor and biosphere transition
Source: Directorate of Town and Country Planning
REVENUE VILLAGES UNDER HILL AREA CONSERVATION AUTHORITY
Map 15.12: Revenue Villages under HACA map
Directorate of Town & Country Planning - Tamil Nadu
15.3.2.3 Lake Restoration Development (Smart City Mission)
Coimbatore’s urban and peri-urban landscape is historically structured around an extensive system of interconnected lakes and tanks, many of which are remnants of the ancient Noyyal River Basin hydrology. These water bodies once supported irrigation, domestic use, aquifer recharge, and biodiversity. Rapid urbanization, however, has led to encroachments, pollution, and hydrological disconnection. The Coimbatore Master Plan 2041 envisions the comprehensive restoration of lakes as multifunctional ecological assets under a blue-green infrastructure framework.
Coimbatore’s Smart City Mission successfully revitalized its “eight-lakenetwork” through the Eco-Restoration Development Plan. This project restored and connected eight key lakes are Narasampathy, Krishnampathi, Selvampathy, Kumarasamy, Selvachintamani, Periyakulam (Ukkadam Big Tank), Valankulam, and Kurichi Kulam—by creating greenways and enhancing the surrounding areas. It also acknowledged the connection between these lakes and the Noyyal River, implementing a comprehensive approach to managing water resources and improving environmental sustainability.
Periyakulam Lake (Ukkadam Lake)
Krishnampathy lake
282
Narasampathy Lake
Source: Coimbatore Smart City Limited
Figure 15.3: Restoration of Lakes in Coimbatore City
Restoring lakes is not a landscape beautification exercise but a resilience-building investment. Revived urban lakes offer climate adaptation, recharge security, ecological balance, and community identity. The Coimbatore Master Plan prioritizes these assets as functional hydrological systems, embedded in a nature-based development paradigm.
Set up decentralized STPs, divert greywater, introduce reed-bed filtration
Encroachment Removal
Demarcate lake boundaries using GIS & revenue maps; enforce buffer regulations
Ecological Restoration
Introduce native aquatic vegetation; create island habitats for birds and fish
Community Interface
Establish greenways, walking paths, biodiversity parks, and public art zones
Climate Resilience
Use lakes for rainwater detention, recharge wells, and microclimate cooling
Table 15.31Benefits of Lake Restoration
Benefit Area
Specific Outcomes
Water Security
- Enhances groundwater recharge - Improves storage and seasonal availability
Flood Mitigation
- Regulates storm water flow - Acts as natural detention basins
Biodiversity
- Supports native flora and fauna - Provides habitat for migratory and resident birds
Climate Regulation
- Reduces Urban Heat Island effect - Improves local microclimate
Pollution Control
- Filters runoff and sewage naturally - Reduces nutrient and toxin loads
Recreation & Culture
- Enables green public spaces and nature trails - Revives cultural-lakefront traditions
Livelihood Support
- Promotes sustainable fishing and eco-tourism - Enhances value of surrounding land
Community Engagement
- Encourages stewardship and education - Fosters sense of shared ecological identity
15.4 Climate Change
This section outlines the impacts of climate change on the Coimbatore Local Planning Area (LPA) and proposes strategies to enhance the city’s resilience and mitigate greenhouse gas (GHG) emissions. It draws upon the Coimbatore Climate Resilient City Action Plan (CRCAP) and other relevant studies to provide a comprehensive understanding of the challenges and the path towards a sustainable future.
Table 15.32Climate Risks, Trends, and Strategic Responses
Climate Issue
Trends & Impacts
Priority Areas
Proposed Interventions
Temperature Rise & UHI
Avg. Land Surface Temp rose from 27°C (1995) to 36.48°C (2023). Thermal discomfort days to rise to 150 by 2050.
Wards 3-12, 19-28 (LST ≥ 36.1°C)
Urban forests, green roofs, cool roofing, and LST-FLT zoning-based mitigation
Urban Flooding
31 identified flood points; 2.29% population and 6.14% slum population vulnerable
Electric buses, public bike-sharing, EV incentives
20,800
Source: Coimbatore Climate Responsive City Action Plan (CRCAP)
15.4.3.1 Business as Usual Emission Projections
The estimation of future projected emissions for Coimbatore was conducted using a baseline GHG inventory, along with population and economic growth statistics and sector-specific trends. The methodology for forecasting Business-As-Usual (BAU) emissions is outlined as follows:
Sectoral Growth Rates: The growth rates for the residential, commercial, industrial, and transport sectors were determined by incorporating population and economic forecasts, applying a weighted average composite methodology to ensure a balanced projection.
Industrial Sector Trends: Future emissions in the industrial sector were estimated based on historical energy consumption trends (2017-18 to 2021-22). The methodology aligns with city priorities and planned
Agriculture, forestry and fishing activities City Total
industrial relocations outside municipal boundaries, contributing to improved air quality and sustainable urban planning.
Urban Service Demand: Future projections for essential services such as water supply, solid waste management, and residential wastewater were based on an urban service demand strategy, which assumes that population growth will be the primary driver of increasing municipal service needs.
This structured approach ensures that Coimbatore’s emission projections reflect realistic urban development trends, aiding in the formulation of targeted climate action policies.
Scope 1: Direct emissions from stationary energy use and in-boundary transport.
Scope 2: Indirect emissions from grid-supplied electricity.
Scope 3: Emissions from waste generation (domestic solid waste and wastewater).
The greenhouse gases analysed include C O 2 , C H 4 , and N 2 O , converted to C O 2 1 equivalent ( C O 2 e ) using IPCC’s Fourth Assessment Report Global Warming Potential (GWP) factors.
The Figure illustrates the Estimated GHG Emissions in the BAU Scenario of Coimbatore City, the industrial and construction sectors will be the primary drivers of GHG emissions, highlighting the need for energy efficiency measures, cleaner energy sources, and sustainable urban planning to mitigate climate impact.
Figure 15.5: Estimated GHG Emissions in the BAU Scenario Source: Coimbatore Climate Resilient City Action Plan – Coimbatore towards a Net - Zero Future
The figure above illustrates the estimated GHG emissions in the business as usual (BAU) Scenario of Coimbatore City, the industrial and construction sectors will be the primary drivers of GHG emissions, highlighting the need for energy efficiency measures, cleaner energy sources, and sustainable urban planning to mitigate climate impact.
Table 15.37Sector-wise Estimated GHG Emissions in BAU
Sector
GHG Emissions in Million Tons CO2
Baseline 2021 – 22
Estimated 2030
Estimated 2050
Estimated 2070
% Share of total in 2070
Stationary Energy
3.25
5.63
9.45
13.82
86.37%
Residential Buildings
1.06
1.57
2.23
2.96
18.50%
Commercial and Institutional Buildings
0.42
0.78
1.39
2.09
13.06 %
Manufacturing Industry and Construction
1.77
3.28
5.83
8.77
54.81 %
Transportation
0.56
0.84
1.21
1.62
10.13 %
Waste
0.18
0.25
0.38
0.56
3.5 %
Total
3.99
6.72
11.04
16.00
100.00
Source: Coimbatore Climate Responsive City Action Plan (CRCAP)
Coimbatore, as one of India’s fastest-growing cities and a key hub for textiles, industries, commerce, education, IT, healthcare, and manufacturing, is projected to experience a significant rise in greenhouse gas (GHG) emissions across all sectors under the Business-As-Usual (BAU) scenario.
• Total Emissions Growth: City-wide emissions are expected to quadruple from 3.99 million tonnes (2021) to 16.00 million tonnes (2070).
Stationary Energy: The largest contributor, projected to account for 86% of total emissions by 2070.
Residential Buildings: Emissions expected to nearly triple, increasing from 1.06 million tonnes (2021) to 2.96 million tonnes (2070).
Commercial & Institutional Buildings: Emissions projected to increase fivefold, from 0.42 million tonnes (2021) to 2.09 million tonnes (2070).
Manufacturing Industry & Construction: The most significant contributor to stationary energy emissions, increasing from 1.77 million tonnes (2021) to 8.77 million tonnes (2070).
Transport: Emissions expected to rise steadily, from 0.56 million tonnes (2021) to 1.62 million tonnes (2070).
Waste: While the smallest contributor, emissions from waste management are projected to triple, increasing from 0.18 million tonnes (2021) to 0.56 million tonnes (2070).
Table 15.38Emissions Reduction in Net-Zero Pathway
Sector
2030(MtCO₂e)
2050(MtCO₂e)
2070(MtCO₂e)
%Reduction vs BAU(2070)
Residential Buildings
0.61
1.35
2.51
85%
Commercial/Institutional Buildings
0.38
0.96
1.98
95%
Manufacturing & Construction
1.43
3.46
7.28
83%
Transport
0.46
0.75
1.61
99%
Waste
0.17
0.34
0.60
107%
Total Emissions Reduction
3.06
6.86
13.98
87.8%
Source: Coimbatore Climate Responsive City Action Plan (CRCAP) report
Table 15.39GHG Mitigation Planning
Element
Description
Inventory Tool
ICLEI's HEAT+ software for city-level emission analysis using IPCC 2006 methodology
Composite model factoring population growth, energy demand, economic trends, and relocation plans
Emission Calculation Methods
Fuel sales (transport), First Order Decay (waste), activity-emission factor multiplication
Source: Coimbatore Climate Responsive City Action Plan (CRCAP)
Source: :Nighttime Land surface temperature is based on MODIS Terra Land Surface Temperature and Emissivity Daily Global 1 km.
Figure 15.4: Night-time Land Surface Temperature pattern of Coimbatore Corporation
288
For instance, a study using LandSat8 and MODIS data for March 2021 informed the LST trend assessment for Coimbatore. Understanding the night-time mean LST helps in identifying the most vulnerable areas and tailoring mitigation measures effectively.
Night-time Land Surface Temperature pattern observed in the Coimbatore Corporation. The figure above illustrate the night-time Land Surface Temperature (LST) variations in Coimbatore over two distinct periods: 2001–2005 and 2019–2023. The analysis reveals a significant increase in night-time temperatures, particularly in the central and south zones of the Coimbatore Corporation, indicating a more pronounced Urban Heat Island (UHI) effect.
The LST (Map 15.13) provides critical spatial insights into temperature distribution across Coimbatore’s urban and semi-urban regions. It highlights a consistent rise in surface heat due to urbanization, loss of green cover, and the expansion of built-up areas. These trends intensify the Urban Heat Island Effect (UHIE), particularly in central and southern zones of the Coimbatore City Municipal Corporation (CCMC).
Map 15.13: Land Surface Temperature (LST) map
LAND SURFACE TEMPERATURE-2024
Table 15.34Coimbatore LST Trends and Vulnerability Analysis
Aspect
Insight / Observation
Average LST Rise
Increased from 27.0°C to 36.48°C
(1995-2023)
(9.48°C rise) over three decades
LST Hotspots
LST ≥ 36.1°C in Wards 3-12, 19-22,
(2023)
24, 26, 28 (Extremely Vulnerable)
Extremely high LST
Gandhipuram, RS Puram, Saibaba
zones
Colony, Peelamedu, Town Hall
Emerging Heat
Sulur, Kuniyamuthur, Selvapuram,
Zones
North Coimbatore
Night-time LST
Central & South Coimbatore retain
Impact
heat longer, increasing night-time health stress
Cooler Pockets
Foothill zones (Thadagam, Anaikatti), lake-buffered areas (Sulur, Perur)
Affected Population
58.88% of city population (13.4 lakh) in vulnerable LST zones; 3.2% in extreme zones
Heatwave Risk
Rise in "thermal discomfort" days projected to reach 150+ days/year by 2050
Contributing
High built-up density, asphalt
Factors
surfaces, low canopy cover, vehicular emissions
Source: Tamil Nadu Disaster Risk Reduction Agency (TNDRRA)
LST mapping is a crucial climate resilience planning tool for the Coimbatore LPA. It offers spatial precision in identifying climate-vulnerable populations, planning zones for UHIE mitigation, and informs the city’s Net-Zero transition strategy by 2070. Its integration with Feel-Like Temperature (FLT) and socio-economic vulnerability layers enables datadriven, equitable climate adaptation.
Table 15.35Integrated UHIE Mitigation Strategies
Mitigation Strategy
LST-Based Application
Description / Intervention
Implementation Focus Areas
Urban Greening & Miyawaki Forests
Target LST ≥ 34°C zones in inner city wards, major roads, and medians
Create dense native green pockets in heat hotspots to reduce surface temperature
Peelamedu, RS Puram, Town Hall, road medians, OSRs
Cool Roofs & Pervious Pavements
Mandate in Transit Oriented Development (TOD) corridors and industrial zones
Reflective roofing and open-grid pavements reduce heat absorption and enhance drainage
Gandhipuram-Ukkadam TOD, SIDCO Industrial Estate
Rooftop Gardens & OSR Foresting
Deploy on commercial/ institutional buildings in Saibaba Colony, Peelamedu
Convert rooftops to functional green spaces and forested OSR plots
Educational campuses, public buildings, OSR lands
Lake and Blue Infrastructure
Prioritize sponge park development near water bodies in LST-impacted zones
Enhance cooling effect of water bodies via restoration, aquatic buffers, and landscape design
Kurichi, Valankulam, Singanallur lakes
Green Buffers
Buffer heat-prone urban infrastructure (e.g., crematoriums, substations, transport depots)
Plant-based shielding against UHIE with native shade species
South Coimbatore zones, public utility compounds
Climate-Responsive Zoning
Use LST thresholds in Development Control Regulations (DCRs)
Restrict or condition development in extreme heat zones; mandate UHI mitigation in building norms
Urban core and emerging peri-urban areas under densification
Monitoring & Mapping
Real-time tracking via sensor based heat mapping
Deploy 50 sensors to monitor surface and ambient temperature trends for heat mitigation
Wards 3-12, 19-28, 89-90; link with CRCAP dashboard
Source: Coimbatore Climate Responsive City Action Plan (CRCAP)
Enhanced with terrain-specific microclimate mapping accounting for elevation changes across LPA zones (380m-500m ASL)
Spatial Resolution
Ward-level vulnerability mapping
Extended to include village-level analysis for rural LPA components and industrial cluster-specific assessments
Source: 'Net Zero Climate Resilient CITIES’, IPCC Climate Risk Framework
Intensifying UHI effect
Further intensification with expansion of built-up area
Critical UHI corridor forming along Avinashi Road-Airport axis with projected 5.2°C temperature differential
Source: Coimbatore Climate Responsive City Action Plan (CRCAP)
Source: Coimbatore Climate Responsive City Action Plan (CRCAP)
Table 15.44Population Vulnerability to Urban Heat
Heat Vulnerability Category
Area Affected (sq.km)
Population Affected
Population Percentage
Enhanced Vulnerability Context
Vulnerable
133.31
1,342,399
58.88%
Predominantly middle-income residential zones with limited green cover (less than 8% per ward)
Highly Vulnerable
62.5
428,580
18.8%
Industrial-residential interface zones with daytime temperature peaks 3.2°C above LPA average
Extremely Vulnerable
8.48
73,075
3.2%
Critical hotspots with combined factors of high density, low income, limited infrastructure access, and intensive urban heat
Source: Coimbatore Climate Responsive City Action Plan (CRCAP)
Table 15.45Spatial Distribution of Vulnerable Population Groups
Urban Heat Vulnerability
Actual Area Affected by Urban Heat (sq. km)
Actual Population Affected by Urban Heat
% of population Vulnerable to Extreme Heat
Vulnerable
133.31
13,42,399
58.88
Highly Vulnerable
62.5
4,28,580
18.8
Extremely Vulnerable
8.48
73,075
3.20
Source: Coimbatore Climate Resilient City Action Plan (CRCAP)
The above data reveals a significant portion of Coimbatore’s population is exposed to extreme heat conditions. Vulnerable areas constitute the largest share, covering 133.31 sq. km and affecting 58.88% (1,342,399 people) of the city’s population. Highly vulnerable areas impact 18.8% (428,580 people) across 62.5 sq. km, while extremely vulnerable zones, though smaller at 8.48 sq. km, still expose 3.2% (73,075 people) to severe heat stress.
Note: WS - Water Supply; WQ - Water Quality; WW - Wastewater; SWM - Solid Waste Management; T - Transpor
Note: WS - Water Supply; WQ - Water Quality; WW - Wastewater; SWM - Solid Waste Management; T - Transpor
Source: Coimbatore Climate Resilient City Action Plan (CRCAP) report
The assessment of urban fragility in Coimbatore highlights the varying degrees of vulnerability across different wards, primarily due to disruptions in essential urban systems. The findings categorize the city’s wards based on the severity of these disruptions and their impact on the population.
Extreme Vulnerability (Critical Wards): Wards 28 and 87 are identified as the most severely impacted, exhibiting fragility in four or more key urban systems. These disruptions affect 71,896 people, accounting for 3.14% of the total population. Issues in these wards include unreliable water supply, inadequate drainage, transportation bottlenecks, and challenges in accessing healthcare facilities.
High Vulnerability: Nine wards, including Wards 4, 6, 7, 10, 19, 23, 24, 82, and 83, experience disruptions in three key urban systems, affecting 2,31,130 residents (10.10% of the total population). These areas face challenges such as poor storm water drainage, waste management inefficiencies, and mobility constraints, which significantly impact residents’ daily lives and economic activities.
Moderate Vulnerability: 22 wards show fragility in up to two urban systems, affecting 4,72,599 residents (20.65% of the total population). These areas face periodic disruptions in essential services like water supply, drainage, and transport, posing a moderate risk to the urban population and requiring targeted interventions for improved resilience.
Low Vulnerability: 24 wards experience fragility in one urban system, with 3,32,652 people (16.26%) impacted. While these areas are relatively less affected, they still require attention to prevent further deterioration of urban services.
Leading the Transition to Net Zero
- Net-Zero CRCAP Pathway targeting 87.8% emission reduction by 2070 - Sectoral emission reduction targets (Buildings: 40%, Transport: 25%, Industry: 22%) - 100% green building compliance in new developments by 2035 - Expansion of solar rooftop coverage from 125 MW (2023) to 1 GW (2041) - Zero-carbon industrial clusters around Sulur and Madukkarai
- Emissions expected to fall by 14.05 million tonnes CO2e by 2070 - Mandating energy audits for all commercial buildings >5,000 m² from 2026 - Solar parks to supply 30% of LPA's electricity demand by 2041
Notes:
Integrated state policy references include the Tamil Nadu State Action Plan on Climate Change (TNSAPCC), Smart Cities Mission, and AMRUT 2.0.
The Climate Action framework is designed considering the unique LPA terrain (Western Ghats foothills to eastern plains), groundwater dependencies, and industrial profiles.
Table 15.50: Institutional Framework for Climate
Governance
Agency / Scheme
Role in Climate Resilience
Tamil Nadu State Climate Change Mission (TNSCCM)
Coordinates funding, policy direction and integrates SAPCC priorities from state level.
Climate Resilient City Action Plan (CRCAP)
Localized vulnerability mapping, Net Zero pathway planning.
MoEFCC / SAPCC
Provides national alignment with SDGs and India’s NDCs
Smart Cities Mission, AMRUT
Supports climate-resilient urban infrastructure, green buildings, EV, and SWM innovations
BISAG, ICCC
Data analytics and IoT integration for monitoring emissions and climate parameters
Civil Society and Academia (e.g., SACON, PSG, CIT)
Technical support for risk assessments and citizen education
The Net-Zero Climate-Resilient City Action Plan (CRCAP) outlines 12 strategies across six key sectors to achieve Coimbatore’s net-zero emissions target by 2070 and enhance resilience against climate hazards. Key interventions include promoting energy-efficient buildings, increasing the share of renewable energy, adopting sustainable waste management practices, and advocating for low-carbon transportation. The Net Zero Pathway is projected to reduce Coimbatore’s GHG emissions by 87.80% in 2070 compared to the BAU scenario, resulting in a reduction of 14.05 million tonnes of CO2e by 2070. Sector-wise emission reductions are also targeted, with significant contributions expected from the built environment, transport, and industry. These ambitious efforts will contribute to a more climate-resilient and sustainable future for Coimbatore LPA, aligning with state and national climate goals.
Coimbatore’s Climate Resilient City Action Plan (CRCAP) outlines sector-specific interventions to reduce GHG emissions and enhance climate resilience.
Table 15.51Resilience Interventions in Sector wise
Sector
Resilience Interventions
Total Mitigation Potential(tCO2e)
Overall Resilience Impact
Buildings
Solar PV systems Energy Efficient (EE) fixtures (LED lamps, EE fans etc., power factor correction and others) Declare and maintain reserved sites as Urban Green Spaces. Have proper policy to lay the utilities on the road sides on one side so that the other side could be used for tree planting
512800
Reduction of GHG emissions and impacts on urban heat islands, health, increase in carbon sinks, improvement of air quality and the micro-climate through better urban planning
Municipal Buildings
Solar PV systems Energy Efficient fixtures (LED lamps, EE fans etc., power factor correction and others)
9900
Reduction of GHG emission footprint and increase in social adaptive capacity through promotion of climate actions
Industry
Energy Efficient pumps Energy efficient industrial motors
575960
Reduction of GHG emission footprint of industries
Solid Waste
4 Bio Methanation plants of total 200 TPD Waste incineration facility of 215 TPD Establish zone wise collection and processing centers Encourage community driven private startups to manage solid waste in the city Develop and implement user charges
233600
Reduction of GHG emissions and socio-economic co-benefits through improved health and livelihood of vulnerable sections, the bio methanation plants and waste incineration facility will benefit more than 40 percent of the population of the city
Transport
Deployment of electric buses Public bike-share system
20800
Water
Reduction in Non-Revenue Water (NRW) Analysis of available water sources so as to plan, e.g. Aquifer maps Waste water treatment plant connections and network for dual supply Separate uses of water with IUWM principles
5000
Improved water resource management, better health and lower GHG emission, reduction in NRW has a conservation potential 92 MLD and will benefit more than 60 percent of population of the city
Street Lighting
Energy Efficient Street Lighting (21000 street lights)
11000
Reduced GHG emissions, coupled with improved safety in the city
*tCO2e = Total CO2 equivalent
Overall Benefits of these Interventions:
Reduction in GHG emissions across all sectors.
Better public health and air quality through urban greening and cleaner energy.
Enhanced resilience to climate change via sustainable urban planning.
Economic & social co-benefits, including job creation and improved urban services.
These actions align with Coimbatore’s Net Zero goal by 2070 and contribute to a more sustainable and resilient city.
The Water (Prevention and Control of Pollution) Act
1974
Prevention and control of water pollution
The Air (Prevention and Control of Pollution) Act
1981
Prevention and control of air pollution
The Environment (Protection) Act
1986
Comprehensive umbrella act for environmental protection, including pollution control
The Hazardous Waste (Management and Handling) Rules
1989
Management and handling of hazardous wastes
The National Green Tribunal Act
2010
Establishment of a tribunal for effective and expeditious disposal of cases relating to environmental protection and pollution control
The E-Waste (Management) Rules
2016
Management of electronic waste
The Bio-Medical Waste Management Rules
2016
Management of biomedical waste
The Plastic Waste Management Rules
2016
Management of plastic waste
The Solid Waste Management Rules
2016
Management of solid waste
The Construction and Demolition Waste Management Rules
2016
Management of construction and demolition waste
The Hazardous and Other Wastes (Management and Transboundary Movement) Rules
2016
Management and regulation of hazardous and other wastes including transboundary movement
The Batteries (Management and Handling) Rules
2001
Management of batteries and battery waste
The Environment Impact Assessment (EIA) Notification
2006
Environmental impact assessment for development projects
These acts and rules collectively form the backbone of India’s legal and regulatory framework for the prevention, control, and abatement of environmental pollution in all its forms which will have to be referred to conformity in accordance with the developmental requirements and implementation as per their relevance.
Source: AQI.in
Figure 15.7:-Carbon Monoxide (CO) emissions in Coimbatore (2020 - 2025)
Respiratory irritation, increased susceptibility to infections, exacerbation of asthma, formation of ground-level ozone, reduced lung function
Smog formation, acid rain, eutrophi-cation of water bodies, damage to vegetation
High levels near arterial roads (Avinashi Road, Mettupalayam Road), contribution from agricultural activities
SO2
Industrial emissions (textile dyeing units, fertilizer plants), power plants
Respira-tory problems, aggra-vation of asthma, eye irritation, increased susceptibility to respiratory infections
Acid rain, damage to ecosystems, corrosion of materials
Significant emissions from textile processing industries; assessment of impacts on nearby agricultural lands and water bodies is necessary
15.5.1.1 Air Quality Management
Coimbatore’s Air Quality Management (AQM) strategies must be tailored to address the specific pollution sources and challenges within the LPA:
Source Control: Enforcing stringent emission standards for industries, particularly textile mills and foundries. Promoting the use of cleaner fuels (CNG, electric vehicles),
incentivizing the adoption of cleaner technologies, and implementing vehicle scrappage policies. Regulating construction activities to minimize dust emissions.
Monitoring: Expanding and upgrading the network of Continuous Ambient Air Quality Monitoring Stations (CAAQMS) across the LPA, prioritizing industrial zones and densely populated areas. Integrating real-time data with GIS platforms for spatial analysis and targeted interventions.
Green Infrastructure: Expanding the urban green cover through afforestation, parks, green belts, and urban forests, which focusing on native species known for their air purification capabilities. Implementing green roofs and vertical gardens on buildings to reduce urban heat island effect and improve air quality. Specific zones where it should be implemented; especially near the water bodies in the central region and near the industrial sectors in the western regions
Public Awareness: Conducting targeted public awareness campaigns on air pollution sources, health impacts, and mitigation measures. Promoting behavioural changes such as using public transport, carpooling, and adopting eco-friendly practices.
Policy and Enforcement: Strengthening regulatory frameworks and enforcement mechanisms to ensure compliance with environmental standards. Implementing stricter penalties for violations and promoting environmental audits for industries.
The plan could benefit from explicitly outlining strategies based on National Ambient Air Quality Standards (NAAQS) and incorporating measures for source control from industries and vehicles. The Coimbatore Smart City Mission installed 15 IoT-enabled CAAQMS stations (CPCB-approved), which covering 80% of urban zones. AQI trends (2021–2023) show 23% “Poor” days (AQI 201–300) during winter inversion episodes. The NCAP Action Plan targets 30% PM reduction by 2026 through green buffer zones and Bharat Stage VI fuel adoption.
Mandatory online emission monitoring for industries; enhanced PUC checks for vehicles.
Urban Greening
Expansion of 500 ha urban forestry to trap dust and sequester carbon.
Public Participation
Citizen AQI dashboards and grievance redressal apps.
Policy Integration
Link AQI status to transport, land use, and health advisories.
Source: AQI.in
Figure 15.11: AQI trends in Coimbatore (2020 - 2025)
Table 15.57AQI Trends in Coimbatore
Year
Average AQI
% Change (YoY)
Trend
2020
75
-
Baseline
2021
85
+13%
Rise
2022
80
-6%
Fall
2023
67
-16%
Fall
2024
75
+12%
Rise
2025
108
+44%
Rise
Source: Air Quality Index of India
Table 15.58Location wise AQI in Coimbatore
Location
Status
AQI
PM2.5 (µg/ m³)
PM10 (µg/ m³)
Tempe-rature (°C)
Humi-dity(%)
Kovai-pudur
Moderate
73
21
43
28
73
Kurichi
Moderate
72
20
52
28
71
PSG College of Arts and Science
Moderate
69
19
48
28
75
Sabari Nagar
Moderate
69
19
50
28
74
SIDCO Kurichi
Moderate
72
20
52
28
74
Tatabad
Moderate
70
19
37
28
72
Source: Air Quality Index of India (AQI.in)
Noyyal River
BOD, COD, Ammonia
3.2× permissible
Dyeing units, sewage
Ukkadam Lake
Faecal coliform, Nitrates
1,800 MPN/100ml (4× limit)
Urban runoff
Peelamedu Groundwater
TDS, Chlorides
2.4× IS 10500 standards
Industrial leachate
Source: CPCB, TNPCB
This pollution poses severe public health risks, with contaminated water causing diseases like cholera and typhoid, as seen in the Noyyal River’s high E. coli levels. It also disrupts aquatic ecosystems, leading to fish mortality due to oxygen depletion, as observed in Singanallur Lake. Groundwater contamination in areas like Ganapathy and Peelamedu has made borewell water unfit for consumption, while polluted irrigation water has reduced agricultural productivity in the Noyyal River basin, affecting farmers. Monitoring by the Tamil Nadu Pollution Control Board (TNPCB) under the MINARS Programme has confirmed severe pollution in major water bodies.
Table 15.60Water Pollutants and their Impacts.
Pollutant
Source
Environmental Impacts
Relevant Coimbatore Context
Industrial Effluent
Textile industries (dyeing and bleaching), tanneries, engineering units
Heavy metal contamination (chromium, lead, cadmium), alteration of pH, elevated levels of chemical oxygen demand (COD) and biochemical oxygen demand (BOD), reduced dissolved oxygen (DO), toxicity to aquatic life, bioaccumulation of pollutants in the food chain
High levels of pollution in the Noyyal River due to untreated or partially treated industrial discharge; impacts on downstream water users (agriculture, domestic water supply); need for comprehensive effluent treatment and monitoring
Untreated/ Poorly treated Sewage
Residential and commercial areas, inadequate or malfunctioning sewage treatment plants (STPs)
Pathogen contamination (E. coli, faecal coliforms), nutrient enrichment (eutrophication leading to algal blooms), oxygen depletion (harmful to aquatic life), health risks (waterborne diseases), aesthetic degradation of water bodies
Significant sewage discharge into the Noyyal River and other water bodies; need for upgrading and expanding STP capacity; promotion of decentralized wastewater treatment systems (DEWATS)
Agricultural Runoff
Fertilizers (nitrogen and phosphorus), pesticides
Eutrophication of water bodies (leading to algal blooms and oxygen depletion), toxicity to aquatic organisms, contamination of drinking water sources, bioaccumulation of pesticides in the food chain, disruption of aquatic ecosystems
Intensive agricultural practices in the Coimbatore LPA contribute to nutrient and pesticide runoff; need for promoting sustainable agricultural practices (organic farming, integrated pest management)
RS Puram
Heat stress
Vertical greening, reflective pavements
Green OSRs, shaded pedestrian routes
High-density commercial district with significant daytime floating population requiring tactical cooling interventions
Gandhi-puram
UHIE, Flash flooding
Storm water retrofitting, tree-lined boulevards
Smart roof code, bio swale drains
Central business district with 85% impervious surfaces requiring integrated blue-green infrastructure
Ukkadam
Flooding, Waste-related methane
Drainage elevation, bio-methanation plant
Blue-green flood proofing grid
Critical flood-prone zone requiring lake-linked storm water management
Kalapatti
Ground water stress
Check dams, aquifer recharge wells
Zone-specific RWH rules
Airport-adjacent growth zone with declining water table (2.1m/year) requiring groundwater restoration
Kurichi
Flooding, UHIE
Lake buffer greening, solar pump retrofits
Kurichi Lakefront eco-park
Industrial-residential transition zone requiring thermal regulation through blue infrastructure
Saibaba Colony
Heat stress
Rooftop gardens, school eco-forests
Thermal mapping dashboard
High-density residential area with aging building stock requiring retrofit cooling solutions
Thonda-muthur
Drought, slope erosion
Contour bunding, agroforestry belts
Watershed ZLD regime
Western Ghats foothill zone requiring slope stabilization and watershed protection
Proposed Coimbatore Metropolitan Climate Council integrating all LPA administrative units
Financial Mechanism
Project-based funding
Dedicated climate resilience fund with 5% allocation from development charges across LPA jurisdictions
Monitoring Framework
Basic climate indicators
Advanced IoT-enabled climate monitoring network with 36 nodes across LPA micro-climate zones
Capacity Building
Limited technical training
Comprehensive capacity building program for planning officials across all LPA administrative units
Public Engagement
Awareness campaigns
Participatory climate resilience planning through ward committees and village sabhas
Industrial Partnership
Limited engagement
Textile-Tech-Tourism (3T) climate partnership leveraging major economic sectors for adaptation financing
Source: Coimbatore Climate Responsive City Action Plan (CRCAP)
Health Effects: Prolonged exposure to high noise levels, especially in urban and industrial zones, leads to health issues such as hearing loss, hypertension, stress, and sleep disturbances. Sensitive groups like children and the elderly are particularly vulnerable to noise-induced health problems.
Quality of Life: Noise pollution disrupts daily activities, including communication and concentration, reducing the overall quality of life for residents in affected areas.
Wildlife Disturbance: Noise pollution near wetlands and forested areas impacts local fauna by interfering with their communication and breeding patterns, potentially leading to biodiversity loss.
Economic Costs: Noise-related stress can reduce productivity in workplaces. Additionally, noise mitigation measures require significant investment.
Sources Of Noise Pollution
Vehicular Traffic: High traffic density in urban areas contributes significantly to noise levels, particularly during peak hours. Major intersections and highways within the Coimbatore LPA are hotspots for vehicular noise pollution.
Industrial Activities: Foundries and textile mills emits continuous noise from machinery operations, affecting nearby residential areas.
• Construction Activities: Urban expansion projects generate temporary but intense noise pollution due to heavy machinery usage.
Public Spaces: Crowded commercial zones and public events amplify noise levels beyond permissible limits.
High traffic volume on arterial roads (Avinashi Road, Mettupalayam Road); need for noise barriers, traffic management measures, and promotion of public transportation
Industrial Operations
Hearing loss among workers, disturbance to nearby residential areas, sleep disruption, reduced quality of life
Noise from textile mills, foundries, and engineering units; need for noise control measures, buffer zones, and relocation of noise-generating industries away from residential areas
Construction
Temporary but significant noise disturbance, stress for nearby residents, sleep disruption, reduced productivity
Construction activities related to infrastructure projects and real estate developments; need for noise mitigation measures during construction, restricted hours of operation
Pb: 145 mg/kg
Salinization
Groundwater over-extraction
Sulur, Irugur
EC: 4.1 dS/m
Organic carbon loss
Urban sprawl
Perur, Kalapatti
SOC: 0.32% (vs 0.8% ideal)
Source: TNPCB
15.5.6.3 Air Pollution
Vehicular Emissions Control: Promote the use of public transportation, cycling, and walking to reduce vehicular traffic and emissions. Incentivize the adoption of electric vehicles (EVs) through subsidies, charging infrastructure, and awareness campaigns, aligning with the National Electric Mobility Mission Plan. Implement stricter emission standards for vehicles and conduct regular vehicle emission checks to ensure compliance.
Industrial Emission Control: Enforce stringent emission standards for industries and regularly monitor air quality to ensure compliance with TNPCB norms. Encourage industries to adopt cleaner production technologies and energy-efficient processes to reduce air emissions.
Urban Forestry: Develop green buffer zones around STPs, landfills, and crematoriums using native trees to absorb pollutants and improve air quality, aligning with the National Afforestation Programme. Implement urban forestry initiatives to increase green cover in the city, planting native trees that enhance air quality and provide shade.
15.5.6.4 Land Pollution
Industrial Waste Management: Establish common effluent treatment plants (CETPs) for industrial clusters to ensure proper treatment of wastewater before discharge, as per TNPCB guidelines. Promote cleaner production technologies to minimize waste generation in industries, incentivized through TNPCB schemes.
Sustainable Agriculture: Encourage farmers to adopt organic farming practices and reduce the use of chemical fertilizers and pesticides, supported by the Department of Agriculture under schemes like the Paramparagat Krishi Vikas Yojana (PKVY). Provide subsidies and incentives for sustainable agriculture, including soil testing facilities managed by the Department of Agriculture to optimize fertilizer use and prevent soil degradation.
Soil Remediation: Develop and implement soil remediation plans for contaminated sites, using techniques such as bioremediation and phytoremediation, in coordination with environmental experts and following TNPCB guidelines.
15.5.6.5 Noise Pollution
Noise Mapping: Develop a GIS-based noise mapping system to identify high-risk zones within the LPA for targeted interventions.
Urban Design Solutions: Incorporate green buffers (tree plantations) around noisy areas such as highways and industrial zones to absorb sound waves effectively.
Strict Enforcement of Noise Limits: Strengthen enforcement of TNPCB’s prescribed decibel limits for various zones (residential, commercial, industrial, silence zones).
Promote Quieter Technologies: Encourage industries to adopt quieter machinery and promote electric vehicles to reduce traffic-related noise pollution.
Community Involvement: Engage local communities in monitoring noise levels through citizen science initiatives supported by TNPCB.
Table 15.65Mitigation Strategies & Outcomes
Measure
Implementation Zone
2023-2025 Impact
Vellalore landfill bio-mining
45-acre reclamation
72% leachate reduction
Electric vehicle corridors
Avinashi Road, Mettupalayam Road
11% NOx drop
Phytoremediation belts
Noyyal and other riverbanks
40% heavy metal uptake
Source: TNPCB
Soil Fertility
Healthy soils support agriculture in peri-urban areas
Projected 25% increase in eco-tourism revenue; Enhanced recreational access for 2.5M residents
Table 15.67Ecosystem Service Valuation
Service Type
Key Ecosystems
Economic Value (Rs./ha/yr)
Carbon sequestration
Anaikatti Reserved Forest
1,12,000
Water filtration
Singanallur Lake
68,000
Pollination support
Urban green spaces
29,000
Soil retention
Western Ghats foothills
1,05,000
15.6 Disaster Management
Coimbatore’s disaster management strategy must account for the city’s diverse geographical and infrastructural landscape, ensuring resilience against natural and humaninduced hazards. Given its location along a neotectonic fault line, running from Kadampadi in the southwest to Veerapandi (No. 24 part) in the west, the city is categorized under Seismic Zone III (Moderate Risk Zone), indicating a potential for minor tremors. This necessitates strict enforcement of seismic-resistant building codes and periodic geotechnical assessments in areas like Gandhipuram, RS Puram, and Peelamedu, which have a high concentration of commercial and residential structures.
4. Pollution
• Deploy decentralized STPs near major drains and lake inlets (e.g., Sanganur Pallam) with real-time effluent quality monitoring. • Enforce Air Quality Action Plans with transport emission control zones, industrial stack monitoring, and greening buffers. • Achieve 90% waste diversion from landfills through ward-level Material Recovery Facilities (MRFs) and policy incentives. • Introduce digital noise and AQI sensors in traffic corridors, industrial clusters, and school zones, linked to city dashboards. • Restrict hazardous materials and high-decibel activity in buffer areas near hospitals, schools, and conservation zones.
5.DisasterManagement Planning
• Prepare seismic (Zone III) and fault-line risk overlay maps and update building by-laws to incorporate zone-specific structural codes [IS 1893 (Part 1): 2016 Primary code for earthquake-resistant structural design; IS 4326: 1993 Guidelines for earthquake-resistant construction] The Ministry of Earth Sciences has selected Coimbatore for a seismic hazard assessment study. • Establish Micro Hazard Atlases for each zone, covering floods, landslides, heatwaves, and urban fire risks. • Retrofit critical infrastructure (hospitals, fire stations, schools) with seismic, flood, and fire resilience features. • Develop multi-use water retention parks and recharge wetlands in low-lying flood-prone areas of the LPA. • Operationalize an Integrated Emergency Response Command System with GIS dashboards, SOPs, and periodic mock drills.
15.8 SWOT Analysis
Table 15.69SWOT Analysis
Strengths
Biodiversity Hotspot - Direct foothill connection to Western Ghats reserves (Boluvampatti, Thadagam, Anaikatti) supports endemic flora & fauna.
Rich Hydrological Network - Noyyal River and 28 interconnected lakes/tanks buffer floods, recharge aquifers and sustain irrigation.
Extensive Green Cover - Over 22% city tree canopy (24 m²/ person), 1,466 parks, urban forestry under HACA.
Climate Resilience Framework - Established MRV cell, alignment with Net-Zero CRCAP, TN State Climate Change Mission.
Weaknesses
Land-use Pressure - Rapid urban expansion erodes agricultural lands, wetlands and green corridors.
Pollution Load - Sewage and industrial effluent contaminate lakes (e.g. Singanallur, Ukkadam) and Noyyal tributaries.
Weaknesses
Fragmented Habitats - Quarries, roads and encroachments disrupt wildlife corridors and increase human-animal conflict.
Groundwater Depletion - Extraction exceeds recharge in high-growth zones (Peelamedu, Coimbatore North).
Opportunities
Eco-restoration Programmes - 8 to 12 lakes under Smart City Mission for desilting, reed-beds & floating wetlands.
Nature-based Solutions - Blue-green-grey integrations for storm water, riparian buffers and permeable pavements.
Eco-tourism & Education - Leveraging temple-tank circuits, hill-trail networks and bird-sanctuary designations.
Circular Economy - Upgrading waste-to-energy, bio-methanation and composting to curb methane emissions.
Threats
Climate Extremes - Intensifying UHI, flash floods, and droughts threaten infrastructure and public health.
Invasive Species - Proliferation in wetlands and reserved forests undermines native biodiversity.
Seismic Vulnerability - Neo-tectonic fault zones (Zone III) demands stricter land-use controls and retrofit investments.
Policy Enforcement Gaps - Weak regulation of HACA zones, wetland buffers and pollution standards.
Below are detailed, research-backed proposals for Coimbatore’s ecological and environmental planning.
Table 15.70List of Proposals and Mitigation Measures
S. no.
Theme
Priority Areas / Assets
Strategies / Targets
1
Lake Rejuvenation & Lakefronts
20 lakes
Buffer zones, STPs, community stewardship, hydrological connectivity mapping
2
River Rejuvenation (Noyyal, etc.)
Noyyal, Kaushika Rivers, Sanganoor Stream
Riparian greenways, sediment traps, recharge zones on alluvial soil
80% segregation by 2027, 4 MRFs, Bio-CNG from wet market waste
9
Landfill / Quarry Reclamation
Sanganur landfill (25 acres), 3 Thadagam quarries
Solar park conversion, eco-park development using phytoremediation
Annual Lake Festival / Eco Fair: To raise awareness and celebrate local lake culture.
Citizen Science Initiatives: Monitoring of water quality and biodiversity with public involvement (QR code-based data submission portals).
River Rejuvenation and Development
(Noyyal & Kaushika Rivers, Sanganoor Stream)
The transformation of riverbanks into vibrant, accessible, and ecologically sensitive riverfronts is central to the rejuvenation strategy. The goal is to reimagine these degraded water edges not only as natural assets but also as civic spaces that support public life, recreation, and ecological awareness. These riverfronts will act as green spines that thread through the urban fabric of Coimbatore LPA, linking neighbourhoods, historic sites, and open spaces.
As part of an integrated approach to sustainable urban development, a comprehensive green infrastructure initiative has been launched to rehabilitate ecologically degraded urban lands and strengthen the city’s natural resilience. The initiative focuses on creating dense, native green pockets using the Miyawaki afforestation method across parks, dump yards, crematorium buffer zones, and designated Open Space Reservation (OSR) sites.
This method involves high-density planting of three to four native species per square meter, enabling the rapid development of self-sustaining mini-forests within a span of three to five years. Guided by expert recommendations from Tamil Nadu Agricultural University (TNAU), the selected native tree species include Azadirachta indica (Neem), Albizia lebbeck (Siris), Ailanthus excelsa (Tree of Heaven), Millettia pinnata (Pongamia), Ficus religiosa (Peepal), Ficus benghalensis (Banyan), Syzygium cumini (Jamun), Terminalia arjuna (Maruthu), Cassia fistula (Golden Shower Tree), and Lagerstroemia speciosa (Kadamba). These species are known to deliver critical ecosystem services such as air purification, carbon sequestration, groundwater recharge, erosion control, and enhanced habitat diversity, thereby transforming neglected urban parcels into vibrant ecological assets.
Overall, the initiative is expected to add over one lakh native trees to Coimbatore LPA’s urban fabric, significantly enhancing the city’s green infrastructure. Within five years, it is projected to increase microhabitat zones by 20–30%, improve urban air quality, support pollinators, and birds, and sequester more than 1,000 tons of carbon annually—firmly aligning with the goals of sustainable urban development and ecological resilience
15.9.1.2 Mitigation measures for Ground Water Extraction
Groundwater over-extraction is a significant concern in Coimbatore Local Planning Area (LPA), exacerbated by various land use categories, including residential, commercial, institutional, industrial, and open spaces. Implementing targeted mitigation strategies in each of these categories can help preserve aquifer health, reduce dependency on groundwater, and promote sustainable water usage across the region. Below are the specific mitigation measures tailored to each land use type:
Residential Areas:
To reduce groundwater dependency, residential buildings over 100 sqm must implement rainwater harvesting (RWH) systems, including recharge pits. Additionally, waterefficient fixtures like low-flow faucets and dual-flush toilets should be incentivized, along with greywater recycling systems for non-potable uses. Voluntary water budgeting can further encourage community-driven conservation efforts.
Commercial Areas:
Commercial buildings must adopt dual plumbing systems to reuse treated wastewater for landscaping and cleaning. Water audits and recycling systems should be mandatory in large establishments to minimize reliance on groundwater. A local “Water-Efficient Building Certification” can reward those with sustainable water-saving strategies.
Institutional Areas:
Institutions like universities and hospitals should install the storm water harvesting systems to capture water for recharge or non-potable uses. On-site wastewater treatment systems can help reuse water for landscaping and cooling. Incorporating water conservation education into institutional curricula will foster sustainable practices among students and staff.
Industrial Areas:
Industries, particularly water-intensive ones, should implement Zero Liquid Discharge (ZLD) systems to treat and recycle wastewater. Water audits and conservation plans will help optimize water usage. Industries must also integrate rainwater harvesting systems to support non-potable needs, reducing groundwater extraction.
Open Spaces & Public Parks:
Public parks and open spaces should utilize efficient irrigation systems like drip or sprinkler methods. These areas can also serve as storm water management zones, where rainwater is captured and directed to recharge groundwater. Incorporating permeable pavements and green infrastructure will further enhance water retention and reduce runoff.
Agricultural Land Use:
Agricultural practices should shift towards waterefficient methods like drip irrigation. Promoting crop diversification, moving away from water-intensive crops like rice, towards drought-resistant crops, will help conserve groundwater. Integrated watershed management can also optimize water use and enhance groundwater recharge.
Mixed-Use & TOD Developments:
Mixed-use developments should implement integrated water management systems that combine rainwater harvesting, wastewater treatment, and storm water management. Green roofs and urban farming initiatives can help with water retention, while smart irrigation systems with moisture sensors will optimize water usage in landscaping.
Vacant & Undeveloped Land:
Vacant lands should be designated as natural recharge zones to enhance groundwater replenishment. Sustainable landscaping with native plants will reduce the need for irrigation and further support water conservation.
Modern Technologies for Groundwater Mitigation
Smart Water Meters & IoT Monitoring: Smart meters and IoT sensors offer real-time monitoring of groundwater usage, providing valuable data for effective water management and early detection of anomalies.
Managed Aquifer Recharge (MAR) with AI: AI models can optimize the design and placement of MAR systems, ensuring that rainwater is effectively channeled into aquifers, enhancing groundwater recharge.
Atmospheric Water Harvesting (AWH): Technologies such as Atmospheric Water Generators (AWGs) and fog nets capture moisture from the air, providing alternative water sources, especially in areas with high humidity.
Smart Irrigation Systems: Sensor-based irrigation systems can optimize watering schedules by adjusting for real-time soil moisture levels, significantly reducing water wastage in agricultural and landscaped areas.
GIS-Integrated Green Infrastructure: Geographic Information Systems (GIS) can map recharge zones and guide the implementation of green infrastructure like rain gardens and permeable pavements, improving groundwater recharge and stormwater management.
Blockchain for Water Rights: Blockchain technology can create a decentralized platform to manage and trade water rights, ensuring transparent and equitable groundwater usage across sectors.
Wastewater Recycling Technologies: Advanced systems like Membrane Bioreactors (MBR) and greywater treatment systems enable industries and households to recycle water for non-potable purposes, reducing the need for groundwater extraction.
Cloud-Based Water Management: Cloud platforms enable real-time water data collection and analysis, helping authorities optimize water distribution, predict demand, and make informed decisions to manage resources sustainably.
Remote Sensing & Hydrological Modeling: Remote sensing technologies such as satellites and drones track groundwater levels and changes, providing data for hydrological models to predict trends and guide water management decisions.
Smart Water Recycling Plants: Zero Liquid Discharge (ZLD) systems and advanced filtration technologies like reverse osmosis help industries recycle almost all wastewater and reducing their reliance on groundwater.
EXISTING LAND USE
16.1 Introduction
16.2 Existing Land Use 2024 – Coimbatore Corporation
The Coimbatore Local Planning Area (LPA) encompasses a total area of 1531.57 sq.km.
Perur Town Panchayat
Cultural-ecological zone near Perur temple
Urban runoff, tourism pressure
Sculpture trail, heritage corridor, temple-view plaza
Prayer pavilion, temple corridor walks, sacred grove
12
Semman-dampalayam Lake
CCMC
Foothill lake with wildlife and agri-drainage support
Siltation, erosion
Forest trail, bird photo point, canopy seating
Ecological & Environmental Significance
The lakes proposed for rejuvenation — including Kolarampathy, Sulur, Perur, Chinavedampatti, and others — are part of a historically interconnected tank system that served irrigation and ecosystem services for centuries. Due to urbanization, many have suffered from encroachments, solid waste dumping, sewage inflow, and loss of biodiversity.
Key Environmental Goals
Water Quality Improvement
Diversion of sewage inflow through underground drainage (UGD) systems.
Installation of decentralized wastewater treatment systems (DEWATS) or constructed wetlands for treating inflow.
Periodic water quality monitoring (BOD, COD, pH, DO) by TNPCB.
Aquatic and Riparian Biodiversity Enhancement
Restoration of littoral zones with native wetland plant species (e.g., Typha, Cyperus, Vetiver).
Creation of islands and nesting areas for migratory birds and local fauna.
Removal of invasive species like Prosopis juliflora and Eichhornia.
Groundwater Recharge & Hydrological Balance
Desilting and restoration of lakebeds to improve percolation.
Reconnection of historical supply channels (e.g., from Noyyal River or stormwater drains).
Climate Resilience & Urban Cooling
Establishment of green buffers, canopy cover, and peripheral tree plantations.
Integration into urban heat island (UHI) mitigation strategies.
Use of open green-water bodies for rainwater harvesting and flood control.
Public Toilets & Drinking Water Stations
Eco-sensitive, solar-powered amenities with rainwater harvesting systems and low-flow utilities at regular intervals.
Urban Furniture & Smart Lighting
Comfortable seating, shaded shelters, artistic bins, and smart lighting systems with motion sensors and Wi-Fi in high-use areas.
Riverbank Rehabilitation and Pollution Control Strategy
To ensure the long-term ecological integrity and flood resilience of the Noyyal and Kaushika Rivers, as well as the Sanganoor Stream, the proposal includes the following key interventions:
Riparian Buffer Zones: Rehabilitate riverbanks by establishing a minimum 50-meter riparian buffer along both banks, using native vegetation to prevent erosion, filter runoff, and support riverine biodiversity.
Wetland Restoration: Restore and expand existing wetland ecosystems adjacent to the rivers and streams to act as natural flood buffers and habitats for aquatic and terrestrial species.
CETP Expansion: Upgrade and expand Common Effluent Treatment Plants (CETPs) to ensure comprehensive treatment of industrial and commercial effluents before discharge into natural watercourses.
Regulatory Enforcement: Strictly enforce Tamil Nadu Pollution Control Board (TNPCB) norms related to industrial discharge, with regular monitoring, public reporting mechanisms, and penalties for non-compliance.
These interventions are intended to restore the rivers natural functions, reduce pollution loads, improve water quality, and create resilient ecological corridors that also serve public and educational purposes.
Figure 15.13: Visuals of proposed river front development
16.2.1.2 Continuous Building Area
The Continuous Building Area (CBA) refers to zones within the Corporation limits characterized by low-rise, high-density developments, typically representing the older, more compactly built portions of the settlement. The CBA was initially notified via G.O.(Ms) No. 126 of the Housing and Urban Development Department, dated 01.07.2024. Subsequently, additional areas were incorporated based on the recommendations from Coimbatore corporation council through a resolution No. 3912/2019/(M.H.5) M.H.2, dated 25.01.2025. The Continuous Building Area has been systematically mapped, and a corresponding schedule has been prepared. The detailed schedule of the Continuous Building Area is provided in Volume 4 under a separate section. Table 16.1 presents the details of the identified CBAs along with their corresponding ward locations.
The Continuous Building Area (CBA), situated in the core part of the city, is predominantly characterized by mixed land uses. Figure 16.1 depicts the Continuous Building Area along Edayar Street, where mixed residential use is observed — with commercial establishments on the ground floor and residential units on the first floor. Map 16.1 illustrates the location of the CBA within the municipal corporation limits.
Figure 16.1: Continuous Building Area in Edayar Street
Figure 16.2: LULU Mall, Coimbatore
Figure 16.3: IT office in CHIL SEZ IT Hub
EXISTING LAND USE 2024 - CORPORATION
16.3
Existing Land
Use 2024
– Municipality
The Four municipalities Madukkarai, karumathampatti, Gudalur, and Karamadai—are situated within the Coimbatore Local Planning Area (LPA). The land use details for these municipalities are discussed in a separate section, as they are recognized as emerging urban centers with substantial potential for future development. Strategically located in different directions across the LPA, these municipalities serve as key gateways for urban expansion and plays a crucial role in facilitating the overall growth of the Coimbatore LPA.
EXISTING LAND USE 2024 - MUNICIPALITY
16.4
Existing Land
Use 2024 –
Rest of LPA
The remaining portion of the Local Planning Area (LPA) encompasses 21 town panchayats, and 66 revenue villages, covering a total area of 1,175.82 square kilometers. Land use classification for this area has been carried out through ground truthing and field verification. Based on this process, an existing land use map has been prepared. The detailed land use classifications are as follows:
317.50
20.73%
Commercial
19.66
1.28%
Industrial
78.45
5.12%
Special and Hazardous Industries
21.60
1.41%
Institutional
57.11
3.73%
Open Spaces and Recreation
2.37
0.15%
Agriculture & Others
913.13
59.62%
Transportation
56.31
3.68%
Waterbody
65.44
4.27%
Total LPA
1531.57
100.00%
Map 16.4: Existing Land Use 2024 – Rest of LPA
EXISTING LAND USE 2024 - REST OF LPA
16.5 Building and Layout Trend Analysis Building Approvals
The Coimbatore Master Plan, approved and published in 2001, comprises seven chapters that address key aspects of urban planning and development. These include land use planning, infrastructure development, transportation, housing, industrial growth, and public amenities. The following is a summary of the key content from each chapter.
Introduction
The introductory chapter outlines the vision for the planned development of Coimbatore. It emphasizes systematic land use, efficient infrastructure, and sustainable urban growth. The chapter addresses challenges arising from rapid urbanization, resource constraints, and the need for a legal and institutional framework to guide balanced development. It sets the foundation for structured urban expansion and improved quality of life.
Study of Existing Conditions
This chapter examines Coimbatore’s geographical and environmental context, including its location, historical growth, geology, soil types, climate, and rainfall patterns. These factors are critical in shaping urban planning
strategies. The analysis aids in identifying suitable areas for development, managing natural resources, and formulating disaster resilience measures.
Demography
The demographic study focuses on population growth trends within the Local Planning Area (LPA). As per the 1971 Census, the population of Coimbatore Corporation stood at 10.12 lakh, with a decadal growth rate of 22.52%. The report also analyzes population data from 1901 to 1971, concluding that the sharp increase was largely due to the incorporation of additional areas into the municipality and its elevation to a municipal corporation in 1981.
Occupational Pattern
The occupational structure of the Coimbatore LPA reveals that 32.72% of the population (as per the 1981 Census) is engaged in economically productive activities. A significant majority, 91.26%, are employed in the tertiary sector, including trade, commerce, transport, and communication. The secondary sector, comprising manufacturing and industrial activities, accounts for 4.86%, underscoring Coimbatore’s role as an industrial hub. The primary sector, involving agriculture and allied activities, constitutes just 3.88%, reflecting a shift away from traditional occupations.
17.4 Land Use Breakdown
The existing land use survey undertaken for the Coimbatore Master Plan 2001 presents a detailed analysis of the spatial distribution and utilization of land within the planning area. This survey serves as a critical foundation for informed urban planning, enabling the identification of prevailing development patterns, infrastructure requirements, and potential areas for sustainable and balanced future growth. The existing and proposed land use of the Coimbatore master plan 2001 is shown in the Table 17.3.
Table 17.3Existing and Proposed Land Use of Coimbatore Master Plan 2001
Land Use
Existing Land Use 1993 (In Sq. Km)
Land Use Percentage
Proposed Land Use 2001 (In Sq.KM)
Land Use Percentage
Residential
107.81
8.38
380.43
29.59
Commercial
2.97
0.23
11.28
0.88
Industrial
17.96
1.40
91.82
7.14
Educational
15.85
1.23
25.23
1.96
Public and Semi Public
8.42
0.66
25.71
2.00
Agricultural
1133.46
88.10
752.00
58.43
Total
1286.47
100
1286.47
100
17.4.1 Residential Use
The existing land use analysis of the Local Planning Area (LPA) indicates that residential use accounts for 8.38% of the total area. Nearly 68.52% of the developed area of the comes under residential use. A clear distinction in development patterns is observed, with older parts of the town exhibiting high-density residential development, while newly planned residential areas are characterized by low-density layouts.
Table 17.4Existing and Proposed Land Use for Kurichi New Town Development Plan 2011
Land Use
Existing Land Use 1993 (In Sq. Km)
Percentage of Land Use
Proposed Land Use 2011 (In Sq. Km)
Percentage of Land Use
Residential
13.23
27.57
20.75
43.25
Commercial
0.47
1.00
1.83
3.81
Industrial
3.39
7.00
12.73
26.53
Public & Semi Public
2.02
4.22
1.03
2.15
Educational
0.58
1.23
2.78
5.80
Agricultural
28.28
58.98
2.88
6.00
Road & Railways
-
-
5.97
12.46
Total
47.97
100
47.97
100
Source: DTCP, Master Plan
17.8 Population Projection and Employment Projection
Institutional
In the Coimbatore LPA Master Plan of 2001, institutional land use—including educational institutions and public/semi-public facilities—was proposed over an area of 9.22 sq. km, accounting for 11.79% of the total planning area. A significant number of schools and colleges were already present within the municipal corporation limits at the time. As per the existing land use data of 2024, institutional land use has increased to 13.83 sq. km, constituting 13.10% of the total area. This growth reflects a notable expansion in institutional activities across the LPA.
Table 17.5Land Use Comparison for Corporation – Existing Land Use 2024 and Old Master Plan Proposed Land Use 2001
Existing Land Use 2024
Existing Land Use 2024
Existing Land Use 2024
Existing Land Use 2024
Existing Land Use 2024
Existing Land Use 2024
Land Use
Area (In Sq. Km)
Percentage of Land Use
Land Use
Area (In Sq. Km)
Percentage of Land Use
Residential
70.71
67.00%
Residential
40.28
38.17%
Commercial
4.05
3.84%
Commercial
6.86
6.50%
Industrial
5.84
5.53%
Industrial
7.19
6.81%
Special and Hazardous Industries
Special and Hazardous Industries
0.00063
0.0005%
Educational
6.60
6.25%
Institutional
13.83
13.10%
Existing Land Use 2024
Existing Land Use 2024
Existing Land Use 2024
Existing Land Use 2024
Existing Land Use 2024
Existing Land Use 2024
Land Use
Area (In Sq. Km)
Percentage of Land Use
Land Use
Area (In Sq. Km)
Percentage of Land Use
Public and Semi Public
2.62
2.48%
-
-
-
Recreation and Open Spaces
0.65
0.61%
Agricultural
15.71
14.89%
Agriculture
16.78
15.90%
-
-
-
Transportation
12.85
12.18%
-
-
-
Waterbody
7.09
6.72%
Total
105.53
100.00%
Total
105.53
100.00%
Source: DTCP, Master Plan
Figure 17.3: Proposed Land Use Map 2001 - Corporation
Map 17.3:Existing Land Use 2024 in 2001 LPA Boundary – Corporation
Existing Land Use 2024 in 2001 LPA Boundary - Corporation
Coimbatorelpa
Legend
DIRECTORATE OF TOWN & COUNTRY PLANNING - TAMIL NADU
DATA SOURCE DTCP, Coimbatore
SCALE 0 0.3250.65 1.3 1.95 2.6 Km PROJECTION : UTM ZONE 43N DATUM : WGS 1984
Land Use Comparison for Rest of LPA
Residential
In the Land Use Plan (LPA) for the year 2001, a total of 295.00 sq. km was designated for residential use, representing 26.43% of the total area. However, as per the existing land use data for the year 2024, the actual residential area amounts to 228.60 sq. km, which constitutes 20.48% of the total area. This reveals a shortfall of approximately 66.40 sq. km in achieving the proposed residential land use. While the intended residential development has largely been realized in most of the directions outlined in the 2001 Master Plan, there remains a noticeable gap in residential coverage between certain settlements, where the development has not fully materialized.
Commercial
The existing commercial land use in the planning area, as of 2024, is 10.76 sq. km, constituting approximately 0.96% of the total area. In comparison, the 2001 Master Plan had proposed 6.82 sq. km for commercial purposes, representing 0.61% of the total area. This reflects a notable increase in commercial activities over the two-decade period.
In the 2001 Master Plan, commercial land use was predominantly concentrated within the Central Business District (CBD). However, the current land use pattern indicates a shift, with commercial development now extending along major transportation corridors, particularly along national and state highways. This trend signifies the emergence of ribbon development, highlighting the spatial expansion and decentralization of commercial activities within the planning area.
Industrial
In the 2001 Master Plan, a total of 82.91 sq. km was allocated for industrial use, accounting for 7.43% of the total land area. The proposed industrial zones were primarily located in and around Veerapandi village, Bilichi village, along Annur Road, and Avinashi Road. In the southern region, industrial use was proposed in areas such as Appanayakanpatti, Kalapalayam, and Pachapalayam.
However, according to the existing land use data for 2024, the actual industrial land use amounts to only 57.00 sq. km, representing 5.11% of the total area. This indicates
that the proposed extent of industrial development has not been fully realized under current conditions.
Nevertheless, industrial growth has been observed along the directions identified in the Master Plan. The development, however, is characterized by a scattered pattern rather than a consolidated industrial zone, reflecting a less organized implementation of the proposed industrial land use strategy.
Institutional
Coimbatore has increasingly positioned itself as a major educational hub in Tamil Nadu, second only to Chennai. As per the existing land use data for 2024, institutional land use occupies 37.59 sq. km, accounting for 3.37% of the total land area. This closely aligns with the 2001 Master Plan, which had proposed 37.55 sq. km (3.36%) for institutional purposes. The marginal increase indicates that the projected land use has been effectively realized.
The steady growth in institutional land use can be attributed to several factors. These include the city’s strong industrial base, which has driven the demand for technical and vocational education, as well as the expansion of higher education institutions catering to both local and out-of-state students. Additionally, improvements in infrastructure, connectivity, and overall urban development have contributed to Coimbatore’s attractiveness as a center for educational investment and development.
Table 17.6Land Use Comparison for Rest of LPA – Existing Land Use 2024 and Old Master Plan Proposed Land Use 2001
Proposed Land Use 2001
Proposed Land Use 2001
Proposed Land Use 2001
Existing Land Use 2024
Existing Land Use 2024
Existing Land Use 2024
Land Use
Area (in sq.km) after removing 4 Villages
Percentage of Land Use
Land Use
Area (In Sq.Km)
Percentage of Land Use
Residential
295.00
26.43%
Residential
228.60
20.48%
Commercial
6.82
0.61%
Commercial
10.76
0.96%
Industrial
82.91
7.43%
Industrial
51.68
4.63%
Special and Hazardous Industries
5.32
0.48%
Proposed Land Use 2001
Proposed Land Use 2001
Proposed Land Use 2001
Existing Land Use 2024
Existing Land Use 2024
Existing Land Use 2024
Land Use
Area (in sq.km) after removing 4 Villages
Percentage of Land Use
Land Use
Area (In Sq.Km)
Percentage of Land Use
Educational
18.63
1.67%
Institutional
37.59
3.36%
Public and Semi Public
18.92
1.70%
Institutional
37.59
3.36%
-
-
-
Recreation and Open spaces
1.26
0.11%
-
-
-
Transportation
31.02
2.78%
Agricultural
693.69
62.16%
Agriculture & others
704.59
63.13%
-
-
-
Waterbody
45.16
4.05%
Total
1115.97
100.00%
Total
1115.97
100.00%
Forest
3.29
0.29%
-
-
-
Hillock
12.31
1.10%
-
-
-
Total
1115.97
100.00%
Total
1115.97
100.00%
Figure 17.4: Proposed Land Use 2001 – Rest of LPA
Map 17.4: Existing Land Use 2024 in 2001 LPA Boundary – Rest of LPA
EXISTING LAND USE 2024 IN 2001 LPA BOUNDARY - REST OF LPA
Summary of Land Use Comparison for Coimbatore LPA 2001
The comparison of land use between the 2001 Master Plan and the 2024 existing conditions reveals significant development across various sectors in Coimbatore LPA. Residential land use has achieved most of the projections, with a minor shortfall in the southern region. Commercial land use has expanded beyond the central business district, extending along major highways. Industrial land use, though growing, has not fully met the proposed targets, with development occurring in a scattered pattern. Institutional land use has seen a substantial increase, aligning closely with the 2001 projections, driven by the city’s rise as a key educational hub. Overall, while the development largely reflects the 2001 Master Plan, some areas have exceeded expectations, while others show gaps in achievement.
Institutional
In the 2011 Master Plan, the proposed institutional land use was 3.81 sq. km, accounting for 7.94% of the total area. As per the existing land use data from 2024, the institutional land use stands at 3.06 sq. km, representing 6.38% of the total area. This indicates that a significant portion of the proposed institutional land use has been realized within the Local Planning Area (LPA)
Table 17.7Land Use Comparison for Corporation – Existing Land Use 2024 and Kurichi Old Master Plan Proposed Land Use 2011
Proposed Land Use 2011
Existing Land Use 2024
Land Use
Area (In Sq. Km)
Percentage of Land Use
Land Use
Area (In Sq. Km)
Percentage of Land Use
Residential
20.75
43.26%
Residential
17.38
36.24%
Commercial
1.83
3.81%
Commercial
0.89
1.85%
Industrial
12.73
26.54%
Industrial
4.18
8.71%
Special and Hazardous Industries
1.80
3.74%
Educational
2.78
5.80%
Institutional
3.06
6.37%
Public and Semi Public
1.03
2.15%
-
-
-
Recreation and Open Spaces
0.42
0.88%
Road & Railways
5.97
12.45%
Transportation
2.04
4.26%
Agricultural
2.88
6.00%
Agriculture
15.33
31.95%
-
-
-
Waterbody
2.87
5.98%
-
-
-
-
-
-
Total
47.97
100.00%
Total
47.97
100.00%
Figure 17.5: Proposed Land Use Map for Kurichi NTDP 2011
Map 17.5: Existing Land Use 2024 in Old Kurichi NTDA
EXISTING LAND USE 2024 IN OLD KURICHI NTDA
DIRECTORATE OF TOWN & COUNTRY PLANNING - TAMIL NADU
DATA SOURCE DTCP, Coimbatore
SCALE 0 0.1750.35 0.7 1.05 1.4 Km PROJECTION : UTM ZONE 43N DATUM : WGS 1984
17.10 Development Gap for Coimbatore Local Planning Area and Kurichi New Town Development Plan
Summary of Land Use Comparison for Kurichi New Town Development Plan 2011
The Kurichi New Town Development Plan, initially designed to support small and medium-scale industries, reveals significant deviations between proposed and actual land use patterns by 2024. Residential land use fell short of projections, with 17.38 sq. km developed versus 20.75 sq. km planned, showing scattered development with vacant lands. Commercial land use is limited to 0.89 sq. km, far below the proposed 1.83 sq. km, with activity concentrated in the CBD. Industrial land use decreased substantially due to relocation to Avinashi Road and urban expansion pressures, shifting the town’s character from industrial to residential. Institutional land use shows better alignment, achieving 3.06 sq. km of the proposed 3.81 sq. km.
Within the Coimbatore Local Planning Area, two master plans are currently in effect. To facilitate a comprehensive assessment of development gaps, both master plans have been reviewed and analysed in an integrated manner. This combined approach allows for a more thorough evaluation of the discrepancies between planned proposals and their actual implementation on the ground.
The proposals from each master plan have been examined in relation to their current status of implementation. A detailed comparison and analysis are presented in Table 17.8, which highlights the progress made and identifies areas where the proposed developments have yet to be realized as intended in the respective plans.
Furthermore, the proposed land use plans for both the Coimbatore Local Planning Area and the Kurichi New Town Planning Development (NTPD) area have been consolidated. This integrated land use assessment enables the identification of development gaps specific to land use categories, as detailed in Table 17.9.
Table 17.8List of Proposals and their status of implementation
Sl. No
Proposals
Status
1.
Ring Road of 80 Feet connecting Mettupalyam Road, Avinashi Road, Trichy Road (A5 - Neelambur to Gudalur)
Not Implemented
2.
Inner Ring Road 150 Feet (A7 - Thudiyalur to Kuniyamuthur)
Not Implemented
3.
Inner Ring Road 80 Feet (A4 Vellkinaru to Neelambur)
Not Implemented
4.
Proposed Road 80 Feet (A6 - Gudalur to Chinnavedampatti)
Not Implemented
5.
Green Strip on the Service Road along Major Roads of Mettupalayam, Avinashi Road, Trichy Road and Pollachi Road
Not Implemented
6.
Fly over at the level crossing in cross cut road
Implemented
7.
Under pass near the Railway station at Big Bazaar Street
Implemented
8.
Under Pass near Kikani High School
Implemented
9.
Widening of Mettupalayam Road
Implemented
10.
Electrification of Jolarpet and Coimbatore Junction
Table 17.9Comparison Table of Existing Land Use 2024 with Proposed Land Use 2001
Proposed Land Use - Coimbatore LPA 2001 and Kurichi 2011 Combined
Proposed Land Use - Coimbatore LPA 2001 and Kurichi 2011 Combined
Proposed Land Use - Coimbatore LPA 2001 and Kurichi 2011 Combined
Existing Land Use 2024 - Coimbatore LPA and Kurichi Combined
Existing Land Use 2024 - Coimbatore LPA and Kurichi Combined
Existing Land Use 2024 - Coimbatore LPA and Kurichi Combined
Land Use
Area (In Sq. Km) after removing 4 Villages
Percentage of Area
Land Use
Area (In Sq. km)
Percentage of Area
Residential
386.46
30.44%
Residential
286.26
22.55%
Commercial
12.70
1.00%
Commercial
18.51
1.46%
Industrial
101.48
7.99%
Industrial
63.04
4.97%
Special and Hazardous Industries
7.11
0.56%
Educational
28.01
2.21%
Institutional
54.48
4.29%
Proposed Land Use - Coimbatore LPA 2001 and Kurichi 2011 Combined
Proposed Land Use - Coimbatore LPA 2001 and Kurichi 2011 Combined
Proposed Land Use - Coimbatore LPA 2001 and Kurichi 2011 Combined
Existing Land Use 2024 - Coimbatore LPA and Kurichi Combined
Existing Land Use 2024 - Coimbatore LPA and Kurichi Combined
Existing Land Use 2024 - Coimbatore LPA and Kurichi Combined
Land Use
Area (In Sq. Km) after removing 4 Villages
Percentage of Area
Land Use
Area (In Sq. km)
Percentage of Area
Public and Semi Public
28.54
2.25%
-
-
-
Recreation and Open spaces
2.33
0.18%
-
-
-
Transportation
45.92
3.62%
Agricultural
712.28
56.11%
Agriculture
736.71
58.03%
-
-
-
Waterbody
55.12
4.34%
Total
1269.47
100.00%
Total
Source: DTCP, Master Plan
The analysis of the existing land use pattern indicates that the residential land use targets have not been fully achieved. A primary reason for this shortfall is the inadequacy in land use zoning, which has led to fragmented and uncoordinated development. Instead of well-defined residential zones, several areas are observed as vacant land parcels, indicating a discontinuity in urban development. Additionally, a significant contributing factor is the non-implementation of critical infrastructure, particularly the road network proposed in the earlier master plans.
The Inner Ring Road and Outer Ring Road as shown in Map 17.6 which is envisaged in the 2001 Master Plan, remain unexecuted, severely affecting accessibility and connectivity. This lack of road infrastructure has not only hindered residential development but has also impacted the realization of proposed industrial zones. The industrial areas identified in the 2001 Master Plan have not materialized as intended, largely due to inadequate road connectivity, which is vital for industrial logistics and workforce mobility.
In contrast, the institutional land use has been nearly achieved as planned, reflecting the strong potential of the Coimbatore Local Planning Area (LPA) to attract and support institutional developments such as educational and healthcare facilities. This trend underscores the importance of aligning land use planning with infrastructure development to foster balanced urban growth.
These gaps in implementation have been duly considered in the revised land use allocation strategy, which aims to promote a coherent and sustainable growth trajectory for the Coimbatore LPA. The revised plan emphasizes strengthening road infrastructure, optimizing land zoning, and encouraging integrated development to meet future demands efficiently.
Map 17.6: Proposals of 2001 Coimbatore Master Plan
ADMINISTRATIVE & GOVERNANCE
18.1 Administrative Setup
Coimbatore LPA located entirely within the Coimbatore District. The district located in the western region of Tamil Nadu, is administratively structured into multiple revenue divisions to ensure effective governance. The district is divided into three revenue divisions Coimbatore South, Coimbatore North, Pollachi facilitating efficient revenue administration. It consists of eleven taluks viz., Coimbatore South, Perur, Madukkarai, Sulur, Coimbatore North, Annur, Mettupalayam, Pollachi, Kinathukadavu, Valparai, Anaimalai covering both urban and rural areas, including hilly terrains.
Table 18.1Revenue Administrative Setup of Coimbatore District
The rural local governance of the district comprises of 12 Panchayat Union, which include prominent rural regions like Annur, Pollachi North, Pollachi South, and Valparai. The urban local governance structure consists of one municipal corporation (Coimbatore City Municipal Corporation), seven municipalities (including Pollachi, Mettupalayam, and Valparai), and 37 town panchayats, reflecting a mix of urban and rural settlements.
Table 18.2Comparison of Administrative Setups Between Coimbatore LPA and District
Parameters
Coimbatore District
Coimbatore LPA
Revenue Administration
Revenue Divisions
3Coimbatore South, Coimbatore North, Pollachi)
3Coimbatore South, Coimbatore North, Pollachi)
Taluks
8(Same as LPA but includes Anaimalai and Valparai in the district)
The local bodies in the Local Planning Areas are 1 Corporation, 4 Municipalities, 21 Town Panchayats and 9 Panchayat Unions with 68 village panchayats (66 revenue villages).
18.2 Electoral Constituencies
Coimbatore District and the Coimbatore Local Planning Authority (LPA) share three revenue divisions— Coimbatore South, Coimbatore North, and Pollachi. Coimbatore District comprises eleven taluks, including Anaimalai and Valparai, whereas the LPA, with consists of six taluks. In terms of administrative blocks, the district has 12 panchayat unions, while the LPA has nine, prioritizing urban expansion and infrastructure planning.
The local governance structure Coimbatore District comprises seven municipalities, including Pollachi, Mettupalayam, and Valparai, compared to four municipalities under the LPA’s jurisdiction. Additionally, Coimbatore District includes 37 town panchayats, highlighting its extensive rural settlement pattern, whereas the LPA administers 21 town panchayats, reflecting a more concentrated urban framework compared to the overall District. Overall, Coimbatore District had a diverse development setting spanning across urban, rural, and hilly landscapes, while the Coimbatore LPA predominantly consist of structured urban areas, encompassed by the rural areas.
Coimbatore LPA’s diverse political representation, spanning urban, industrial, and rural regions, plays a vital role in governance, infrastructure planning, and policymaking in Tamil Nadu. It is represented by three Lok Sabha constituencies and includes 8 Tamil Nadu Assembly constituencies, as outlined in Table 18.3.
Table 18.3Electoral Constituencies of Coimbatore LPA
Parliamentary Constituency
Assembly Constituency
Nilgiris
Mettupalayam
Coimbatore
Sulur
Kavundenpalayam
Coimbatore North
Coimbatore South
Singanallur
Pollachi
Thondamuthur
Kinathukadavu
Source: Election Commission Department
18.3 Revenue and Local Body Administration Of LPA
The Coimbatore Parliamentary Constituency holds the highest political significance within the LPA, encompassing six Assembly segments. Mettupalayam, part of the Nilgiris Constituency, maintains a geographical and administrative connection to the Udhagamandalam District. The Pollachi Parliamentary Constituency, covering Thondamuthur and Kinathukadavu, represents a mix of rural and semi-urban areas, balancing agrarian and industrial interests.
Coimbatore Local Planning Area (LPA) comprises of 118 revenue villages out of 295 in Coimbatore District, forming a well-structured administrative framework. These 118 revenue villages form part of corporations, municipalities, town panchayats, peri-urban village panchayats, and village panchayats, as detailed in Table 18.4.
Table 18.4Revenue Villages of Coimbatore LPA
S. No
Taluk Name
Revenue Villages
Corporation
Corporation
Corporation
1
Coimbatore South
Coimbatore Rural
1
Coimbatore South
Ramanathapuram
1
Coimbatore South
Sowripalayam
1
Coimbatore South
Uppilipalayam
1
Coimbatore South
Singanallur
1
Coimbatore North
Anupparpalayam
1
Coimbatore North
Ganapathy
1
Coimbatore North
Krishnarayapuram
1
Coimbatore North
Kumarapalayam
1
Coimbatore North
Puliyakulam
1
Coimbatore North
Sanganoor
1
Coimbatore North
Telungupalayam
1
Coimbatore North
Vilankurichi (Part)
Corporation Villages
Corporation Villages
Corporation Villages
1
Perur
Thudiyalur
2
Coimbatore North
Kavundampalayam
3
Perur
Vadavalli
4
Coimbatore North
Veerakeralam
S. No
Taluk Name
Revenue Villages
5
Coimbatore North
Vellakinaru
6
Coimbatore North
Chinnavedampatti
7
Perur
Sundakamuthur (HACA)
8
Coimbatore North
Saravanampatti
9
Coimbatore North
Vilankuruchi (part)
10
Coimbatore North
Kalapatti
11
Coimbatore North
Kuniyamuthur
12
Coimbatore North
Kuruchi
Municipalities
Municipalities
Municipalities
1
Coimbatore North
Gudalur (HACA)
2
Madukkarai
Madukkarai
Source: Coimbatore City Municipal Corporation
The presence of HACA-regulated villages, periurban panchayats, and revenue villages reflects the region’s diverse geographical and economic landscape. This well-defined structure supports efficient governance, infrastructure development, and policy implementation across Coimbatore’s urban, industrial, and rural areas.
18.4E - Governance
The table 18.5 below presents the distribution of Common Service Centres (CSCs) across different taluks in Coimbatore Local Planning Area (LPA), categorized by their Service Centre Agency (SCA):
Table 18.5Summary of Community Service Centres in Coimbatore LPA
Taluks
PACC Centres
TACTV Centres
VPRC Centres
Total CSC
Annur
4
-
-
4
Coimbatore North
8
6
-
14
Coimbatore South
3
3
-
6
Kinathukadavu
2
-
-
2
Madukkarai
7
1
8
16
Perur
10
2
4
16
Sulur
14
1
-
15
Mettupalayam
2
-
-
2
Total
50
13
12
75
Source: E-Governance Department
18.5 Departments and Implementation Agencies
The Tamil Nadu e-Governance Agency (TNeGA) has established Online Community Service Centres (CSCs), also known as E-Sevai Kendras, across Coimbatore LPA. These centres provide digital access to government services, enabling citizens to avail themselves of essential services efficiently.
Through PACCS, TACTV, and VPRC Centres, TNeGA ensures that various services, such as revenue department applications, certificates, government scheme registrations, and utility bill payments, are accessible to the public.
The State Government’s line departments play a crucial role in basic service delivery within the Coimbatore Local Planning Area (LPA). The following are the key government bodies responsible for governance and administration:
1. Local Governance and urban facilities
i. Corporation
The Coimbatore City Municipal Corporation (CCMC) was established in 1866 and upgraded to a Municipal Corporation in 1981. It is headed by the Municipal Commissioner and functions under the Regional Director of Municipal Administration, Coimbatore. CCMC is responsible for public health, water supply, road maintenance, drainage, sewerage, and streetlights within the city limits.
ii. Municipalities, Town Panchayats, and Village Panchayats
Apart from CCMC, Coimbatore LPA includes municipalities such as Karamadai, Gudalur, Karumathampatti, and Madukkarai. Additionally, several town panchayats and village panchayats are responsible for the basic urban services and govern suburban and rural areas.
iii. Water Supply & Sewerage
The Tamil Nadu Water Supply and Drainage Board (TWAD) and the Coimbatore City Municipal Corporation manage water supply and sewerage services in the LPA. The Executive Engineer, TWAD, Coimbatore, coordinates with the Municipal Engineer for service delivery.
iv. Water Resources Department (WRD)
The Tamil Nadu Water Supply and Drainage Board (TWAD) and the Coimbatore City Municipal Corporation manage water supply and sewerage services in the LPA. The Executive Engineer, TWAD, Coimbatore, coordinates with the Municipal Engineer for service delivery.
v. Tamil Nadu Electricity Board
The Tamil Nadu Electricity Board (TNEB) oversees power distribution in Coimbatore LPA through TANGEDCO. The Executive Engineer, Coimbatore South/North Divisions, manages power supply infrastructure and streetlight maintenance.
vi. Revenue Department
The Revenue Department in Coimbatore district plays a key role in land administration, ensuring accurate land records and issuing titles like Patta and Chitta. It oversees the collection of property taxes, land revenue, and stamp duties, funding local services. The department also administers welfare schemes, providing compensation and aid to vulnerable groups. In disaster management, it coordinates relief efforts and ensures compensation for affected citizens. Additionally, it resolves land disputes and facilitates urban planning and development through legal and revenue frameworks.
vii. Housing and Slum Upgradation
The Tamil Nadu Housing Board (TNHB) and the Tamil Nadu Urban Habitat Development Board (TNUHDB) manage public housing and slum redevelopment projects in Coimbatore.
2. Economic & Employment Sector
i. Coimbatore - District Industries Centre (DIC)
DIC, under the Department of Industries and Commerce, promotes Micro, Small, and Medium Enterprises (MSMEs), cottage industries, and handicrafts. The industrial ecosystem in Coimbatore LPA includes over 50,000 MSMEs, employing lakhs of skilled and unskilled workers.
ii. SIPCOT Tamil Nadu Industrial Development Corporation (TIDCO)
TIDCO plays a key role in large-scale industrial development and infrastructure projects in Coimbatore, including industrial parks and Special Economic Zones (SEZs).
iii. TIDEL Park Coimbatore
TIDEL Park Coimbatore is a major IT hub, fostering the growth of the software and technology industries in the region.
iv. Small Industries Development Corporation (SIDCO)
SIDCO oversees multiple industrial estates, including SIDCO Industrial Estate in Kurichi and Malumichampatti. These estates house industries such as textile manufacturing, foundries, automotive components, and engineering units.
3. Agriculture and Horticulture
i. Department of Agriculture
The Agricultural Department in Coimbatore promotes sustainable farming practices, provides technical support and training to farmers, and ensures soil health through testing and management. It also facilitates irrigation and water resource management, encourages organic farming, and helps farmers access government schemes and subsidies. The department supports agricultural marketing and creates market linkages for fair pricing. Additionally, it fosters agricultural research and innovation to improve crop yields and sustainability.
ii. Market Committee
Coimbatore has a well-established marketing network for agricultural products. The Regulated Market Committee oversees the trading of agricultural produce through markets such as the Ukkadam and Mettupalayam Regulated Markets.
iii. Department of Horticulture
The Deputy Director, Department of Horticulture, Coimbatore, implements farmer-centric schemes and promotes high-value horticultural crops in suburban areas.
iv. Environment & Forest
The Coimbatore Forest Division, under the Conservator of Forests, manages reserved forests and the Coimbatore Forest Range. The district is home to protected areas such as the Nilgiri Biosphere Reserve and the Velliangiri Hills.
4. Transport
i. National and State Highways
National Highways: NH-544 (Salem–Cochin), NH-81 (Tiruchy Road), NH-181 (Mettupalayam Road), NH-948 (Sathyamangalam Road), and NH-83 (Pollachi Road) are managed by the National Highways Authority of India (NHAI).
State Highways: The Assistant Divisional Engineer (SH), Coimbatore, under the State Highways Department, oversees major roads like SH-162 and SH-167.
Urban Roads: Coimbatore Corporation and Panchayat Unions manage local roads.
ii. Public Transport and Roads
Tamil Nadu State Transport Corporation (TNSTC) regulate public transport services. The city has an extensive bus network and is set to introduce metro rail services.
iii. Regional Transport office
The Tamil Nadu State Regional Transport Office (RTO) in Coimbatore is responsible for vehicle registration, licensing, and ensuring road safety in the region. The RTO enforces traffic rules, collects road tax, and maintains records of registered vehicles. It also handles public grievances related to transportation and vehicle-related issues.
iv. Indian Railways - Salem Division (Southern Railway)
The Coimbatore Railway Junction operates under the Salem Division of Southern Railway. It is a crucial hub for passenger and freight transport, connecting Coimbatore with major Indian cities via broad-gauge railway lines.
v. Airport Authority of India
The Coimbatore International Airport is managed by the Airport Authority of India (AAI). It facilitates domestic and international air travel and is a key gateway for trade and tourism in the region.
5. Social Infrastructure and Amenities.
i. Education and Higher Education
The District Educational Officer, School Education Department, Coimbatore, oversees government and private schools. Coimbatore is home to premier educational institutions, including:
Government Schools: 200+ schools under the state board
Matriculation and CBSE Schools: 100+ private schools
Technical Education: Coimbatore houses leading polytechnic institutes and engineering colleges like PSG Tech and CIT.
Higher Education: The city is known for top universities and research institutions, including Bharathiar University and Avinashilingam University.
ii. Medical and Health services.
The Joint Director of Medical and Rural Health Services (Coimbatore) oversees public healthcare services, including Coimbatore Medical College Hospital and Primary Health Centers (PHCs) in rural areas. The city also has premier medical colleges providing advanced healthcare and medical education.
iii. Archaeological Survey of India (ASI) & Tamil Nadu State Department of Archaeology
The ASI, Coimbatore Circle, is responsible for the conservation and protection of monuments of historical importance within the LPA. The region includes heritage sites that are under ASI’s jurisdiction for archaeological research and preservation.
The Tamil Nadu State Archaeology Department is responsible for excavating, preserving, and conserving the state’s ancient monuments, artifacts, and sites. It conducts research on Tamil Nadu’s rich archaeological heritage and maintains detailed documentation of discoveries. It also educates the public through exhibitions and awareness programs. Additionally, it collaborates with national and international agencies for research and heritage protection initiatives.
iv. Hindu Religious & Charitable Endowments Department (HR&CE)
The Assistant Commissioner, HR&CE, Coimbatore, manages temples, including significant temples like Perur Pateeswarar Temple and Marudamalai Temple.
v. Tourism Department
The Tamil Nadu Tourism Department promotes tourism in Coimbatore by maintaining tourist attractions, developing infrastructure, and organizing cultural events. Key destinations include the Marudamalai Temple, Velliangiri Hills, Kovai Kutralam Falls, and the Perur Pateeswarar Temple. The department also facilitates eco-tourism initiatives and heritage site conservation.
vi. Police Department
The Commissioner of Police, Coimbatore City, and Superintendent of Police oversees law enforcement. The city has multiple police stations managing urban and rural law and order.
vii. Fire Safety Department
The District Fire Officer, Coimbatore, is responsible for fire and emergency services, with fire stations strategically located across the LPA.
viii. Pollution Control Board (TNPCB)
The TNPCB District Office, Coimbatore, monitors air and water pollution, grants environmental clearances, and inspects industrial compliance.
ZONING PROPOSALS AND STRATEGY
19.1 Need for Zoning Strategy
19.2 Zoning Framework in the 2001 Master Plan
The Coimbatore Local Planning Area (LPA) is projected to have a population of 58.24 lakhs by the horizon year 2041, representing a two-fold increase from the existing population. This significant growth necessitates substantial land allocation to accommodate the expanding population base. The additional population will be integrated into the urban fabric in accordance with the provisions of the Tamil Nadu Combined Development and Building Rules (TNCDBR), 2019. The corresponding increase in residential areas also demands comprehensive planning for physical infrastructure, social amenities, and essential urban services to ensure sustainable and livable communities. Furthermore, the Coimbatore LPA is characterized by ecologically and agriculturally sensitive areas, including fertile agricultural lands in the western region, reserve forests abutting the western boundary, and prominent water bodies such as the Noyyal River and Sanganur Pallam. These environmentally sensitive zones have been carefully identified, and an ideal zoning strategy has been formulated to ensure the balanced and optimal functional utilization of land resources while safeguarding ecological integrity.
The 2001 Master Plan for Coimbatore LPA (Covering 1,286.47 Sq. Km along with the 47.97 Sq. Km Kurichi New Town Development Plan) has a slightly different land use zones from that prescribed in TNCDBR 2019. These included Primary and Mixed Residential Zones, Commercial Zones, Various categories of Industrial and Institutional land uses.
These Zones were developed based on prevailing land use classification and planning norms of the time. The following are the land use categories in the master plan 2001.
Primary Residential
• Mixed Residential
Commercial
Controlled Industries
Education
Parks & Playground
Public Open Spaces
Agriculture (Dry)
19.3 Alignment with TNCDBR 2019
The previous Master Plan was formulated nearly 30 years ago, based on the development by-laws and planning regulations that were in effect at that time. In the current context, land use classifications have been revised and are now aligned with the provisions and categorization standards outlined in the Tamil Nadu Combined Development and Building Rules (TNCDBR), 2019.
Table 19.1Revised Land Use Classification as per TNCDBR, 2019
Sl. No
Use Classification in Master Plan
Use Classification in Development Rules
1
Primary Residential Use
Residential
2
Mixed Residential Use
Residential
3
Commercial Use
Commercial Use
4
Industrial Use or Light Industrial Use or Controlled Industries Use
Industrial Use
5
General Industrial
Industrial Use
6
Special and Hazardous Industrial Use
Special and Hazardous Industrial Use
7
Institutional or Educational Use or Public and Semi-public Use
Institutional
8
Open Space and Recreational Use
Open Space and Recreational
9
Non-Urban
Non-Urban (only in Chennai Metropolitan Area)
10
Agricultural Use
Agricultural Use
11
Urbanisable
Urbanisable Use (only in Chennai Metropolitan Area)
19.4 Residential Use Zone
The Noyyal River currently bisects the Local Planning Area (LPA), with agricultural lands acting as a natural buffer between residential settlements. Within the Corporation limits, residential development is predominantly characterized by low-rise, high-density patterns, with a noticeable concentration along major road corridors in the form of ribbon development. Notably, along Mettupalayam Road, residential growth is primarily observed on the western side. Additionally, Sulur Town Panchayat shows a significant residential concentration.
Along the foothills of the Western Ghats, particularly near the Kochi Highway, residential settlements are oriented towards retirement and gated communities. High-rise
residential developments are notably emerging along Sathy Road and Avinashi Road corridors.
The proposed residential zones are largely concentrated between Annur Road and Avinashi Road. This region has been prioritized for development due to the presence of IT industries and the proposed metro line, which is expected to act as a major catalyst for growth. Furthermore, areas such as Perur, Chettipalayam, and Theethipalayam are proposed for residential land use owing to the planned Western Bypass Road, which enhances regional connectivity.
Residential development is also proposed in Karumathampatti, Pappampatti, Kadampadi, and Kangeyamnallur to accommodate housing demand arising from nearby industrial growth. With the proposed Ring Road project, regions like Malumichampatti and Kurichi are also identified for residential development due to improved accessibility.
In the HACA (Hill Area Conservation Authority) designated regions, only a minimal amount of residential land use is proposed, ensuring that basic residential needs are met while maintaining ecological balance. Additionally, infill residential development is proposed in vacant areas between existing settlements to strengthen connectivity and capitalize on existing infrastructure.
Continuous Building Area
The Continuous Building Area (CBA) refers to zones within the Corporation limits characterized by low-rise, high-density developments, typically representing the older, more compactly built portions of the settlement. The CBA was initially notified via G.O.(Ms) No. 126 of the Housing and Urban Development Department, dated 01.07.2024. Subsequently, additional areas were incorporated based on the recommendations from Coimbatore corporation council through a resolution No. 3912/2019/(M.H.5) M.H.2, dated 25.01.2025. The Continuous Building Area has been systematically mapped, and a corresponding schedule has been prepared. The detailed schedule of the Continuous Building Area is provided in Volume 4 under a separate section. Table 19.3 presents the details of the identified CBAs along with their corresponding ward locations.
The Existing Land Use (ELU) map for the Coimbatore Local Planning Area (LPA), covering a total extent of 1,531.57 square kilometers, was prepared as a foundational step for comprehensive urban and regional planning. The Coimbatore LPA comprises one Municipal Corporation (Coimbatore Corporation), four Municipalities (Madukkarai, Karumathampatti, Gudalur, and Karamadai), 21 Town Panchayats, and 66 Revenue Villages.
The preparation of an existing land use map constitutes a fundamental component in the formulation of a master plan. It systematically documents the present utilization of land across categories such as residential, commercial, industrial, agricultural, and public and semi-public uses. This detailed assessment establishes a factual baseline that enables to identify deficiencies, the spatial conflicts, and areas requiring intervention. It provides essential insights for the rational allocation of resources, infrastructure development, and environmental management.
The Coimbatore City Municipal Corporation (CCMC) encompasses a total area of 257.81 square kilometers, comprising 44 revenue wards and 11 integrated village panchayats. To support effective urban management and future development initiatives, a land use survey has been conducted across the entire municipal jurisdiction. This detailed survey has enabled the identification of prevailing land use patterns and infrastructural needs, allowing for the systematic classification of individual land parcels. Land use classifications have been assigned based on a combination of factors, including geographic location, existing land characteristics, development potential, and broader planning objectives. This approach ensures that future growth remains structured, sustainable, and aligned with the city’s long-term vision.
1269.47
100.00%
Quarry
10.11
0.80%
-
-
-
Waterbody
55.12
4.34%
-
-
-
Total
1269.47
100.00%
Total
1269.47
100.00%
3
Sulur
Karumathampatti
4
Mettupalayam
Karamadai
Town Panchayats
Town Panchayats
Town Panchayats
1
Annur
Sarkar Samakulam
2
Annur
Idigarai
3
Annur
Narasimmanayakkanpalayam (HACA)
4
Coimbatore North
Periyanayakkanpalayam
5
Coimbatore North
Veerapandi No. 4
6
Perur
Vedapatti
7
Perur
Thondamuthur (HACA)
8
Perur
Pooluvampatti (HACA)
9
Perur
Thenkarai (HACA)
10
Perur
Perur
11
Perur
Ettimadai (HACA)
12
Perur
Thaliyur (HACA) a. East Chithirachavadi b. West Chithirachavadi c Kallikanayakkanpalayam