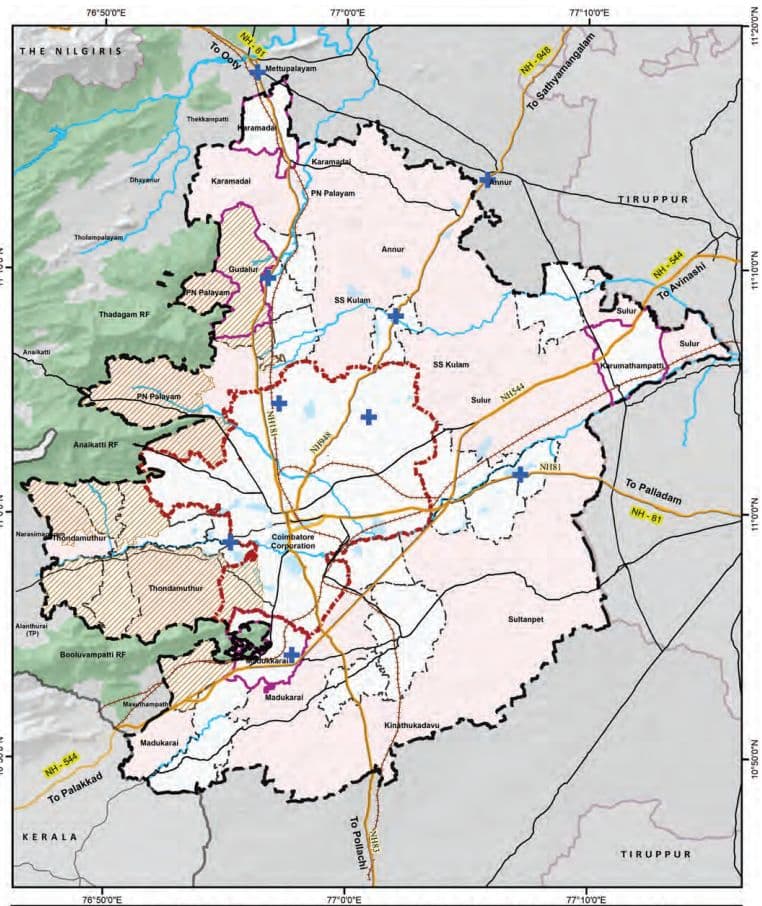
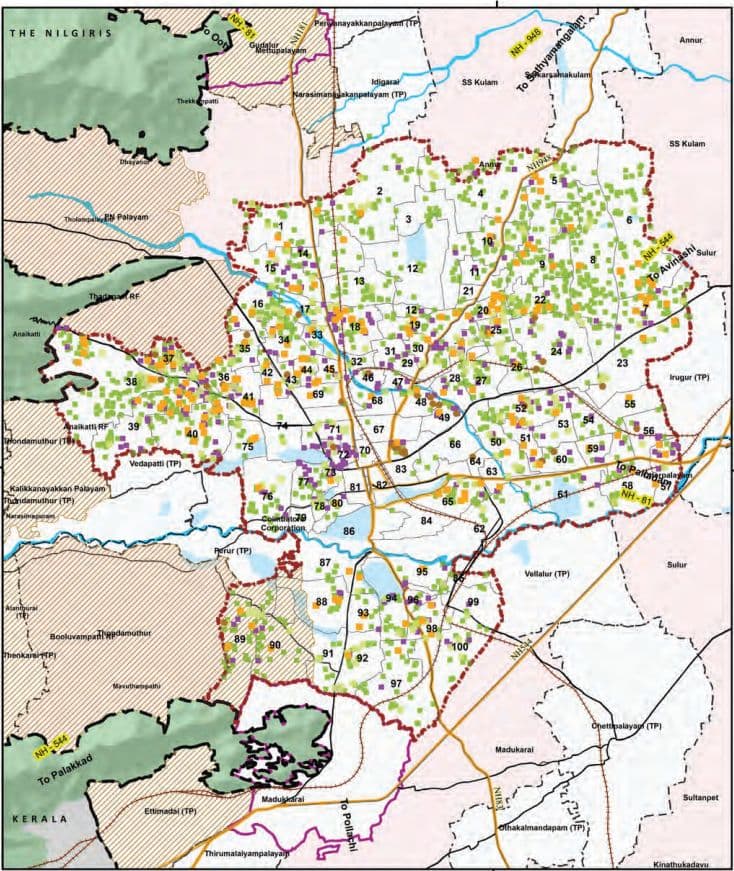
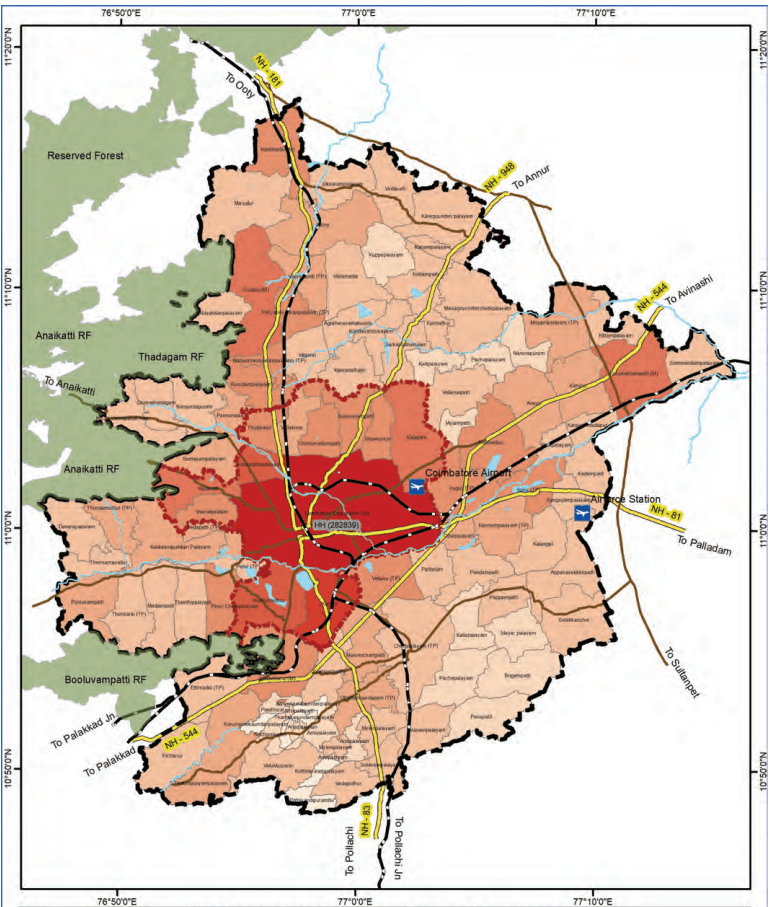
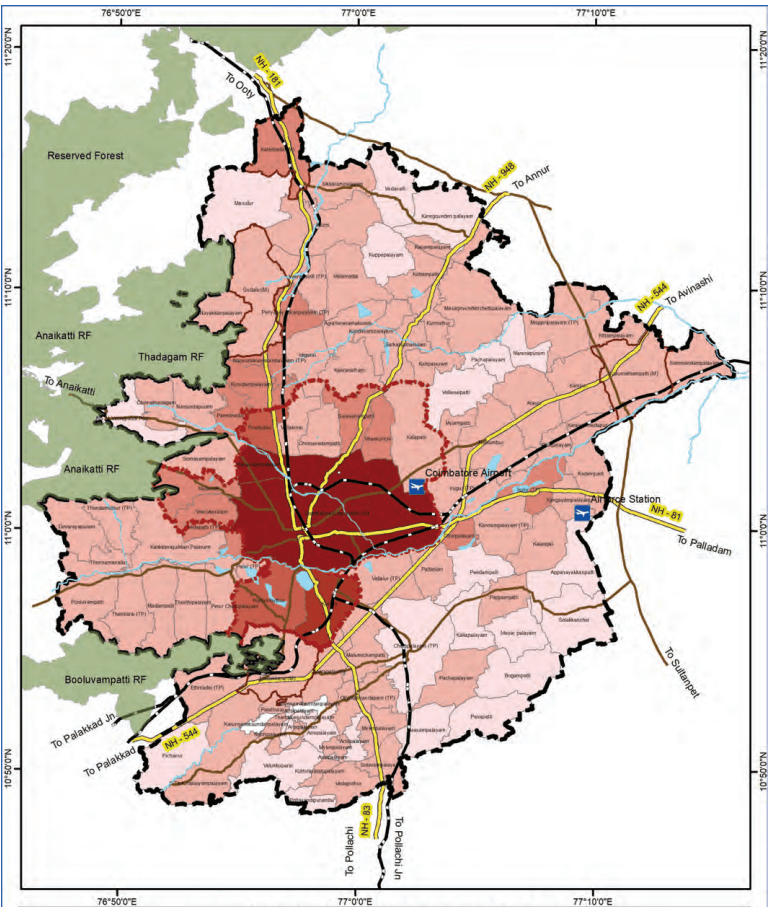
Population projection for Coimbatore LPA using various methods....496
Arithmetical increase method....496
Geometrical increase method....500
Housing - Annexures....504
Existing Population And Households 2011, 2024....504
Projected Population & Households 2031 And 2041....509
Condition Of Census Houses 2011....513
Tenure Of Census Houses 2011....517
Public Housing Provided By Tnuhdb....521
Public Housing Provided By Tnuhdb – Ongoing....523
Public Housing Provided By Tnhb....527
List Of Slums Evicted And Alloted Under Jnnurm & Ahp
In Coimbatore Division....527
Existing Stormwater Drain....530
Proposed Storm Water Drain....534
Existing Solid Waste Management....538
Proposed Solid Waste Generation....542
Annexure no: 10-1 shows the “Coimbatore LPA Present Power consumption and Service connection details – Substation wise”....546
Annexure no. 10-2 “Substation wise Energy Capacity and Gap....552
Energy Demand projection – Village wise....556
Coimbatore Master Plan - 2041....556
Proposed Substation Capacity - Short term and Long Term – Village level....563
MENT ORDERS
GOVERNMENT ORDERS....568
Government Orders
xiii
List of Abbreviations
AAI
Airport Authority of India
AC
Air Conditioned
AG
Aspirational Growth
AHP
Affordable Housing in Partnership
AID
Automatic Incident Detection
API
Application Programming Interface
ASI
Archaeological Survey of India
ATIS
Automatic terminal information service
ATMP
(Assembly, Testing, Marking & Packaging
ATMS
Advanced traffic management system
BAU
Business as Usual
BFSI
Banking, Financial Services, and Insurance
BIS
Bureau of Indian Standards
BOV
Battery Operated Vehicles
BPO
Business process outsourcing
BWSSB
Bangalore Water Supply and Sewerage Board
CAGR
Compounded Annual Growth Rate
CASC
Coimbatore Auto Sports Club (
CBD
Central Business District
CBIC
Chennai-Bengaluru Industrial Corridor
CBIC
Chennai-Bengaluru Industrial Corridor
CBMIC
Chennai Bengaluru-Mumbai Industrial Corridor
CBSE
Central Board of Secondary Education
CCMC
Coimbatore City Municipal Corporation
CCTV
Closed-circuit television
CETPs
Common effluent treatment plants
CHC
Community Health Center
CHIL SEZ
Coimbatore Hi-tech Infrastructure Private Limited Special Economic Zone
CIBI
Coimbatore Innovation and Business Incubator
CII
Confederation of Indian Industry
CIT
Coimbatore Institute of Technology
CKIC
Chennai - Kanniyakumari Industrial Corridor
CLPA
Composite Local Planning Area
CMP
Comprehensive Mobility Plan
xxviii
CNG Compressed Natural Gas CODISSIA Coimbatore District Small Industries Association CPCB Central Pollution Control Board CPHEEO Central Public Health and Environmental Engineering Organisation CPS Community Parks CSC Common Service Centers CUMTA Chennai Unified Metropolitan Transport Authority CWSN Children With Special Needs CWSS Combined Water Supply Schemes DAY-NULM Deen Dayal Antyodaya Yojana - National Urban Livelihoods Mission DDP Detailed Development Plan DEWATS Decentralised Wastewater Treatment System DGPS Differential Global Positioning System DHH District Headquarter Hospital DIC District Industries Center (DIC) DMA District Metering Areas DPSUs Defence Public Sector Undertakings DRDO Defence Research and Development Organisation DSDC District Skill Development Centre DTCP Directorate of Town & Country Planning ECBC Energy Conservation Building Code ELCOT Electronics Corporation of Tamil Nadu ESDM Electronics Hardware Manufacturing ESDM Electronics System Development and Maintenance ESI Employees State Insurance ESR Elevated Storage Reservoirs ESZ Eco-Sensitive Zones ETA Estimated Time of Arrival ETC Estimated Time of Completion ETP Effluent Treatment Plant EWS Economically Weaker Section FAR Floor Area Ratio FHTC Functional Household Tap Connections FMSCI Federation of Motor Sports Clubs of India FRL Full Reservoir Level FSI Floor Space Index FSTP Faecal Sludge Treatment Plant GCCs Global Capability Centres
xxix
GCP Ground control point GDDP Gross District Domestic Product GDP Gross Domestic Product GER Grass Enrollment Ratio GI Geographic Indication GIS Geographical Information System GoTN Government of Tamil Nadu GQ Golden Quadrilateral GSDP Gross State Domestic Product GSI Geological Survey of India GSR Ground Service Reservoirs GVA Gross Value Addition H&UD Housing & Urban Development HACA Hill Area Conservation Authority HDI Human Development Index HGT High Growth Trajectory HIG Higher Income Group HR&CE Hindu Religious & Charitable Endowments Departments HSC Health Sub-Center HVAC Heating, ventilation, and air conditioning ICCC Integrated Command and Control Centre ICD Inland container depots ICTT International Container Transshipment Terminal IIS Indian Institute of Science IISER Indian Institute of Science Education and Research IIT Indian Institute of Technology ILPs Integrated Logistics Parks IMD Indian Meteorological Department IPHS Indian Public Health Standards IPT Intermediate Public Transit IRC Indian Road Congress ISRO Indian Space Research Organization IT Information Technology ITeS Information Technology Enabled Services ITI Indian Training Institute ITS Intelligent Transport System JJM Jal Jeevan Mission JNNURM Jawaharlal Nehru National Urban Renewal Mission
xxx
KLD Kiloliters per Day KNTDA Kurichi New Town Development Authority L&T Larsen & Toubro Limited LIG Lower Income Group LPA Local Planning Area LPCD Liters per capita per day LPO Legal Process Outsourcing MBBR Moving Bed Biofilm Reactor MICE Meetings, Incentives, Conferences, and Exhibitions MIG Middle Income Group MLD Million Litres per Day MMDA Madras Metropolitan Development Authority MMLP Multimodal Logistics Park MPI Multidimensional Poverty Index MRTS Mass Rapid Transit System MSL Mean Sea Level MSME Micro, Small and Medium Enterprises MVA Megavolt-Amperes NBFCs Non-Banking Financial Companies NCT National Capital Teritory NDMA National Disaster Management Authority NDMC New Delhi Municipal Council NH National Highway NID National Institute of Design NIFT National Institute of Fashion Technology NIRF National Institutional Ranking Framework NMT Non- Motorized Transport NMV Non -Motorized Vehicles NPV Net Present Value NRSC National Remote Sensing Center NRW Non-Revenue Water NSSO National Sample Survey Office NULM National Urban Livelihood Mission OEMs Original Equiment Manufacturers OHT Over Head Tanks ORS Open Route Service OSM Open Street Map OSR Open Space Reservation
xxxi
PACS Primary Agricultural Credit Societies PDS Public distribution system PHC Primary Health Center PHPDT Peak Hour Peak Direction Traffic PMAY Pradhan Mantri Awas Yojana PPP Public-Private Partnership PSU Public Sector Unit PSU Public Sector Unit PwD Person with Disabilities R&D Research & Development RAY Rajiv Awas Yojana RFID Radio Frequency Identification RoB Rail over Bridge RoW Right of Way RRTS Regional Rapid Transit System RTO Regional Transport Office SaaS Software-as-a-Service SACON Sálim Ali Centre for Ornithology and Natural History SAFE Site Adjacent Factory Employee SBR Sequential Batch Reactor SCA Service Center Agency SCADA Supervisory control and data acquisition SDGs Sustainable Development Goals SEZ Special Economic Zone SH State Highway SHG Self-Help Groups SIDCO Small Industries Development Corporation SIPCOT State Industries Promotion Corporation of Tamil Nadu SME Small and Medium Enterprises SRTM Shuttle Radar Topography Mission STEM Science, Technology, Engineering, and Math STP Sewage Treatment Plant STPI Software Technology Park of India STR student-Teacher Ratio SUH Shelter for Urban Homeless T&CP Town & Country Planning TACTV Tamil Nadu Arasu Cable TV Corporation Limited TANGEDCO Tamil Nadu Generation and Distribution Corporation Limited
xxxii
TANTRANSCO Tamil Nadu Transmission Corporation Limited TDM Traffic Demand Management TIDCO Tamil Nadu Industrial Development Corporation TIDEL Tamil Nadu Industrial Development Corporation and Electronics Corporation of Tamil Nadu TIFR Tata Institute of Fundamental Research TMC Traffic Management Centers TNAU Tamil Nadu Agricultural University TNCDBR Tamil Nadu Combined Development Building Rules TNDIC Tamil Nadu Defence Industrial Corridor TNEB Tamil Nadu Electricity Board TNeGA Tamil Nadu e-Governance Agency TNGECL Tamil Nadu Green Energy Corporation Limited TNHB Tamil Nadu housing board TNPCB Tamil Nadu Pollution Control Board TNPDCL Tamil Nadu Power Distribution Corporation Limited TNPGCL Tamil Nadu Power Generation Corporation Limited TNSRLM Tamil Nadu State Rural Livelihood Mission TNSSGF Tamil Nadu Startup Seed Grant Fund TNSTC Tamil Nadu State Transport Corporation TNUHDB Tamil Nadu Urban Habitat Development Board TNULM Tamil Nadu Urban Livelihood Mission TOD Transit Oriented Development TP Town Panchayats TWAD Tamil Nadu Water Supply and Drainage Board UASB Upflow Anaerobic Sludge Blanket UDA Urban Development Authority UGPHC Up Graded Primary Health Centre UGSS Under Ground Sewerage Schemes ULB Urban Local Bodies UMTA Unified Metropolitan Transport Authority UNESCO United Nations Educational, Scientific and Cultural Organization UPHC Upper Primary Health Center URDPFI Urban and Regional Development Plans Formulation & Implementation URPs University Research Parks USGS United States Geological Survey VPRC Village Poverty Reduction Committee WTP Water Treatment Plant
SOCIAL INFRASTRUCTURE
Coimbatore District is on a progressive trajectory toward achieving social equity and sustainable human development. The district exemplifies a model of balanced urban growth, where economic development is complemented by strategic investments in human capital and social infrastructure.
To build upon this momentum in the LPA, future planning efforts must prioritise inclusive service delivery, equitable access, and the strengthening of last-mile linkages to ensure that the benefits of development reach all population segments.
In Urban Core Areas – The focus must evolve from mere access to a deliberate enhancement of quality in service delivery across sub-sectors of Social Infrastructure.
In Rural and Peri-Urban Areas – The focus must be placed on bridging infrastructure gaps, ensuring universal access, and last-mile delivery of social infrastructure.
These aims to guide Coimbatore LPA toward a socially inclusive future, where every citizen benefits from the city’s progress. It is aligned with Tamil Nadu’s vision of becoming a $1 trillion economy, wherein human capital is identified as growth driver for building a progressive society and access to essential goods and services is envisioned as a cornerstone for socially inclusive growth, particularly across the domains of healthcare, education, safety and security, as well as culture and sports infrastructure.
11.1Social Indicators
Coimbatore district reflects substantial progress in reducing multidimensional poverty and commitment to human development, highlighting the impact of sustained investments in social infrastructure.
11.1.1 Human Development Index (HDI), 2017
Coimbatore ranked 6th among all districts in Tamil Nadu with a Human Development Index (HDI) of 0.844 in 2017, placing it firmly in the ‘Very High Human Development’ category. The HDI is calculated as the average of three indices: the Life Expectancy Index, the Education Index, and the Gross National Income (GNI) Index. To put this into perspective, Coimbatore’s HDI is comparable to that of developed countries such as Kuwait (0.847) and even higher
than that of Oman (0.819), highlighting the district’s strong performance in health, education, and income dimensions..
11.1.2Multidimensional Poverty Index (MPI), 2019
The Multidimensional Poverty Index (MPI) derived from National Family Health Survey (NFHS) offers a more recent and granular assessment of deprivation across 10 indicators which are divided into three equally weighted dimensions: Education, Health and Standard of Living.
Notably, education and health, which fall under the domain of social infrastructure, together account for twothirds (2/3) of the MPI. This indicates the critical role that social infrastructure plays in improving human well-being. As per MPI data for the Coimbatore District:
The MPI value in the Coimbatore district has halved - from 0.009 in NFHS-4 (2015–16) to 0.004 in NFHS-5 (2019–21), indicating a significant overall reduction in deprivation.
The headcount ratio—which represents the percentage of people identified as multidimensionally poor—dropped from 2.29% to 0.96%.
This highlights that fewer people in Coimbatore are poor today, and those who are still poor face fewer and less severe hardships related to education, healthcare, and living conditions.
11.1.3Literacy Rate in Coimbatore LPA
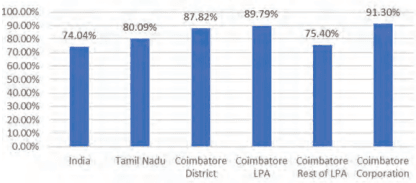
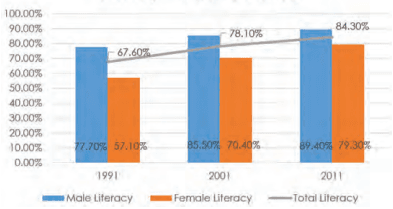
Coimbatore district demonstrates strong educational attainment, with a literacy rate of 87.82%, surpassing Tamil Nadu (80.09%) and India (74.04%). Coimbatore Corporation leads with 91.3%, while the Urban LPA stands at 84.3%, and Rural LPA lags at 75.4%, reflecting a significant urban-rural gap (~16%).
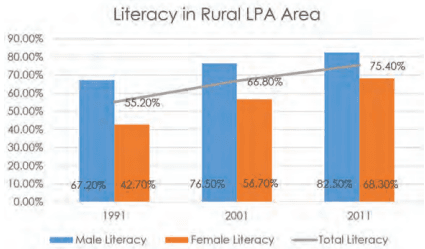
Between 2001 and 2011, literacy rate in Coimbatore LPA rose from 55.2% to 75.4%, driven by a notable increase in female literacy (42.7% to 68.3%). However, rural female literacy remains 14.2% below rural males and 21.2% below urban males, indicating persistent gender disparities.
Urban areas benefit from better infrastructure while rural zones face cultural and economic barriers.
Literacy Rate
Source: Census of India, 2011
Figure 11.1: Coimbatore LPA Literacy Rate Comparison with State and Country
Literacy in Urban LPA Area
Source: Census of India, 2011
Figure 11.2: Literacy Rate Trend in Urban Areas of Coimbatore LPA
Source: Census of India, 2011
Figure 11.3: Literacy Rate Trend in Rural Area of Coimbatore LPA
11.1.4Spatial Trends in Social Infrastructure Development
Further reinforcing this above trend in indices, a comparative analysis between the proposed land use (2001) and the existing land use (2021) in the Coimbatore Local Planning Area (LPA) reveals that institutional and commercial sectors have witnessed more pronounced growth than residential and industrial sectors. This clearly highlights that Coimbatore LPA has a strong foundation in institutional growth.
Coimbatore’s urban core areas have largely overcome access-based deprivations and now stand to benefit from improvements in service quality and efficiency. However, rural and peri-urban areas still show marginal deprivation. These areas require focused interventions to ensure lastmile delivery and equitable access to essential services.
11.2 School Education in Coimbatore LPA
11.2.1Distribution of Schools in Coimbatore LPA
11.2.1.1 Category wise Distribution of Schools in LPA
The available data on the distribution of schools across different categories, funding types, and management systems within the region reveals important patterns that highlight both the strengths and gaps in the existing educational infrastructure. A total of 1,172 schools have been identified, distributed across various administrative units such as Corporation, Municipalities, Town Panchayats, and Revenue Villages. These schools are categorized into five types: Pre-Primary, Primary, Middle, High, and Higher Secondary Schools.
School Category-wise Distribution in LPA
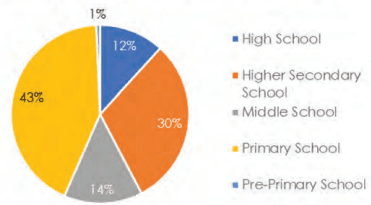
Figure 11.4: Category wise Distribution of Schools in Coimbatore LPA
A review of the distribution across school categories indicates that Primary Schools constitute the largest proportion (42.7%) of the total, followed by Higher Secondary Schools (30.5%) and Middle Schools (14.2%). High Schools and Pre-Primary Schools account for 11.8% and 0.7%, respectively. This distribution aligns with a typical educational pyramid structure, where the base level—Primary Education—has the widest presence, ensuring foundational education at the local level, while the number of institutions tapers off at higher education levels, reflecting increasing centralization and specialization.
Table 11.1Category wise Distribution of Schools in Coimbatore LPA
School Category
Corporation
Municipality
Town Panchayat
Revenue Villages
Grand Total
%
Higher Secondary School
215
22
55
66
358
31%
High School
72
7
21
38
138
12%
Middle School
63
18
25
61
167
14%
Primary School
215
23
86
177
501
43%
Pre-Primary School
7
0
0
1
8
0.7%
Grand Total
57249%
70<sub>6</sub>%
18716%
34329%
1172100%
100%
Spatially, Corporation areas exhibit the highest concentration of schools (49% of the total), followed by Revenue Villages (29.3%), Town Panchayats (15.9%), and Municipalities (6%). This pattern suggests a strong presence of educational infrastructure in urban areas, particularly within the core city limits. In contrast, Revenue Villages and Town Panchayats, despite serving a considerable population base, have relatively fewer schools, indicating potential access gaps in less urbanized areas.
11.2.1.2 Funding-wise Distribution of Schools in LPA
The funding structure of schools further reveals the role of both public and private sectors. Government schools account for 46% of the total institutions, making them the largest single contributor to the education system. Un-aided private schools, however, are nearly equal in number (44%), suggesting a significant presence of privately managed educational institutionsthroughout the LPA. Fully Aided and Partially Aided schools comprise 7% and 3%, respectively, while Central Government institutions constitute only a negligible share.
Table 11.2Funding wise Distribution of Schools in Coimbatore LPA
Funding Category
Corporation
Municipality
Town Panchayat
Revenue Villages
Grand Total
%
Central Govt
3
0
1
0
4
0%
Fully Aided
61
6
5
11
83
7%
Government
175
30
235
98
538
46%
Partially Aided
22
3
2
5
32
3%
Un-aided
311
31
100
73
515
44%
Grand Total
572
70
343
187
1172
100%
49%
6%
29%
16%
100%
11.2.1.3 Management wise Distribution of Schools in LPA
With regard to the management and curriculum of schools, the Samacheer Kalvi or State Board system overwhelmingly dominates the landscape, comprising 92.3% of all schools. Central Board of Secondary Education (CBSE) schools represent 6.9%, followed by International Board and ICSE schools with marginal shares. CBSE and International schools are predominantly concentrated in Corporation and Town Panchayat areas, while their presence in rural regions is almost negligible
Table 11.3Management wise Distribution of Schools in Coimbatore LPA
Management Category
Corporation
Municipality
Town Panchayat
Revenue Villages
Grand Total
%
CBSE
47
4
21
9
81
6.91
ICSE
2
1
0
1
4
0.34
International Board
2
0
2
1
5
0.43
Samacheer Kalvi / State Board
521
65
320
176
1082
92.32
Grand Total
572
70
343
187
1172
100
48.81%
5.97%
29.27%
15.96%
100%
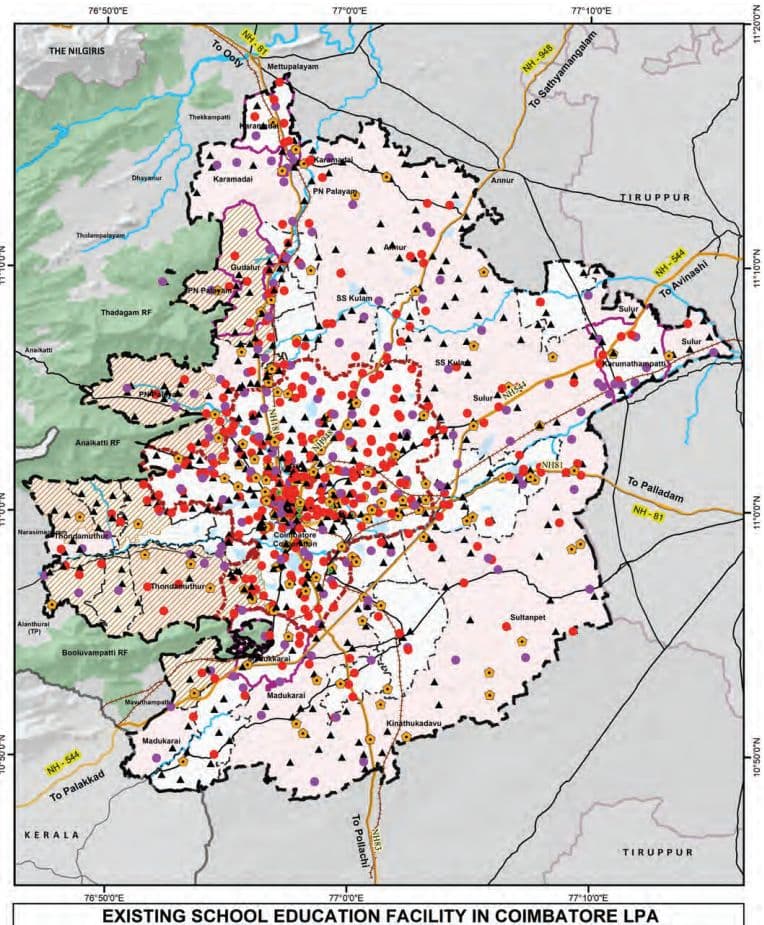
Map 11.1: Existing School Educations in Coimbatore LPA
11.2.2Students Enrolment in School Education
Table 11.4School Management wise Students Enrolment in Coimbatore LPA
Management
Total Number of Boys
Total Number of Girls
Total Number of Students
Central Govt
3567
3188
6755
Fully Aided
10339
10311
20650
Government
50806
53739
104545
Partially Aided
14184
16903
31087
Un-aided
165935
153495
319430
Grand Total
244831
237636
482467
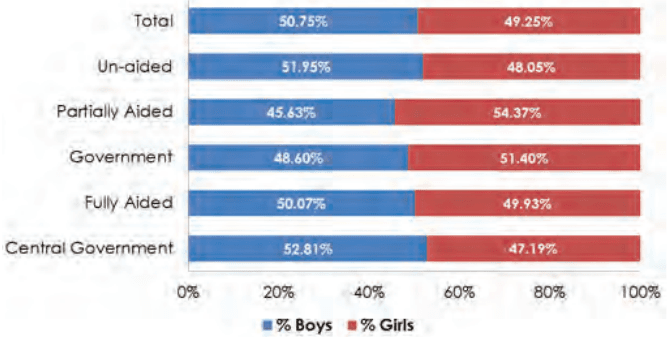
Figure 11.5: Management wise Boys and Girl Students Enrolment in Coimbatore LPA
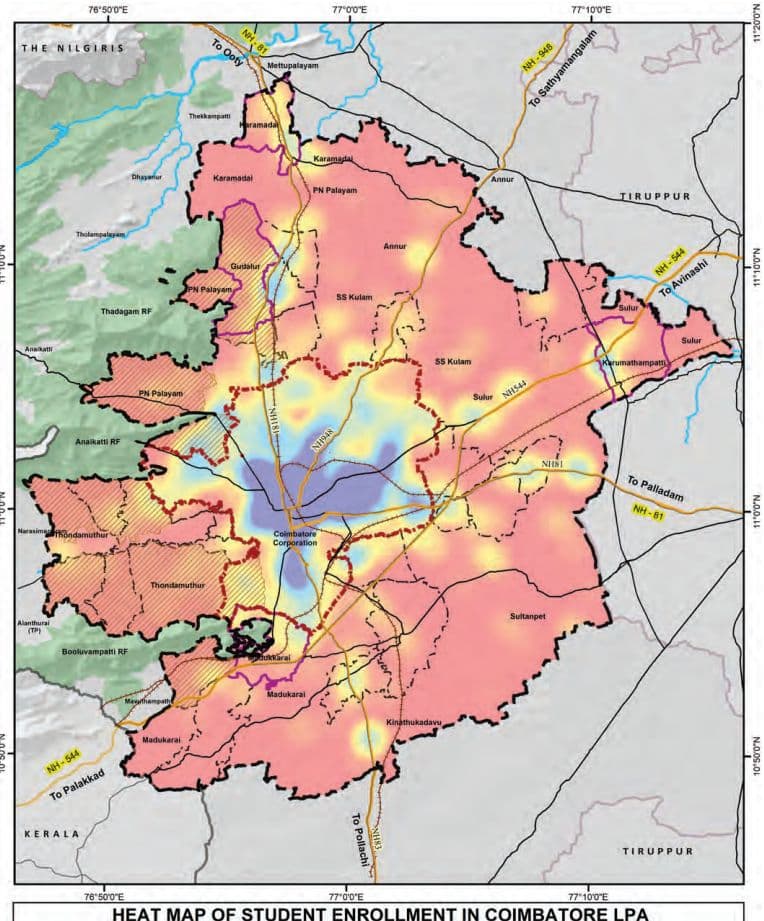
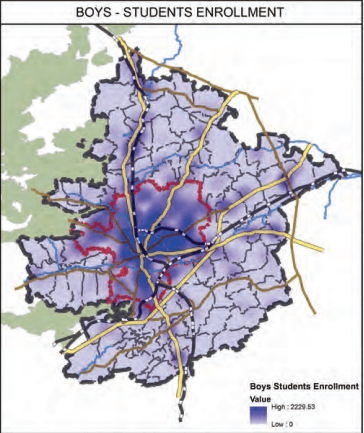
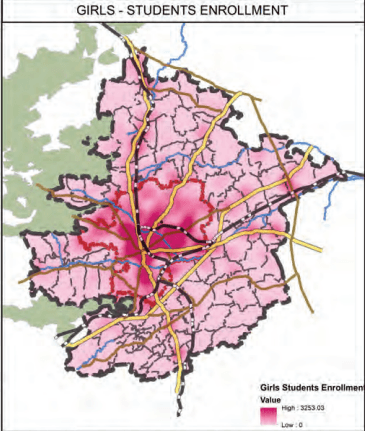
The Coimbatore LPA records a total student enrollment of 482,467, with a balanced gender ratio (50.7% boys, 49.3% girls), indicating steady progress toward gender parity in education. Un-aided schools account for 66.2% of enrollments, reflecting high demand. Over 156,000 students attend Government, Fully Aided, and Partially Aided schools.
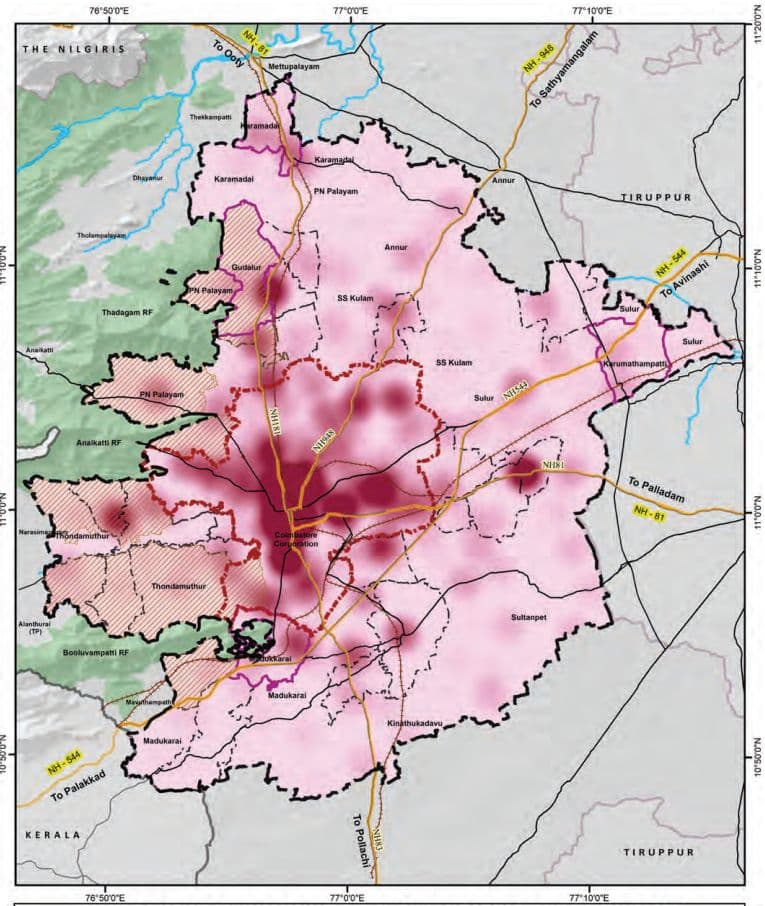
Map 11.2: Heatmap of Students Enrolment in Coimbatore LPA
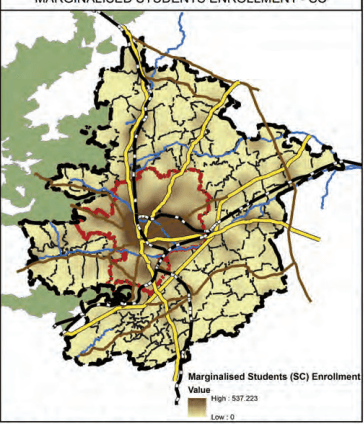
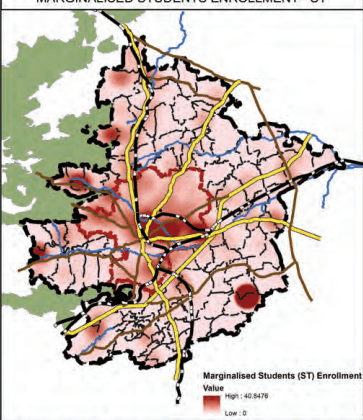
Map 11.3: Heatmaps of Students Enrolment - Boys, Girls, and Marginalised Students in LPA
Heat Map of Distribution of Students Enrollment in Coimbatore LPA
11.2.3Student-Teacher Ratio in Coimbatore LPA
The student-Teacher Ratio (STR) across all school categories within the Coimbatore Local Planning Area (LPA) remains well within the prescribed normative limits between 20 to 25, with no category exceeding the recommended benchmarks as shown in the Table 11.5. This reflects an adequate deployment of teaching personnel, thereby supporting the effective delivery of quality education at all levels.
Table 11.5Students - Teachers Ratio in Schools of Coimbatore LPA
School Category
Students Enrollment
Teaching Staffs
Student Teachers Ratio
As per Norms
High School
47898
2199
21.78
30:1(as per RMSA framework)35:1(as per RTE Act 2009)
Hr. Sec. School
344339
13607
25.30
Middle School
35799
1707
20.97
Primary School
53456
2362
22.63
30:1(as per RTE Act 2009)
Pre-Primary School
975
40
24.37
11.2.4Differently Abled Schools and CWSN Schools in Coimbatore LPA
Sustainable Development Goal (SDG) 4 emphasizes inclusive and equitable quality education for all, including children with disabilities.
The higher number of special schools for the differently abled/ Children With Special Needs (CWSN) within Coimbatore Corporation reflects the city’s commitment to this goal, highlighting its efforts toward fostering an inclusive and equitable urban environment.
There are 14 special schools for differently abled students, with the majority (11) located within Coimbatore Corporation, all managed by un-aided institutions. The remaining three schools are located in Gudalur Municipality, Perur Town Panchayat, and Narasimhanaickenpalayam Town Panchayat, with only the Perur school being government-run.
Table 11.6Special Schools for Differently Abled Students/Children With Special Needs (CWSN)
Administration Area
Number
Management
Coimbatore Corporation
11
Un-aided
Gudalur Municipality
1
Un-aided
Perur TP
1
Government
Narasimhanaickenpalayam TP
1
Un-aided
11.2.4.1 Comparison of CWSN/Differently Abled Students in Mainstream vs CWSN Schools in LPA
Out of 2,674 CWSN students in Coimbatore LPA, 83.7% are in mainstream schools, reflecting strong inclusion efforts, especially at the Higher Secondary (824) and Middle School (519) levels. Special schools primarily serve CWSN in Primary (61) and Middle (236) levels, indicating early identification and targeted support.
Table 11.7Comparison of CWSN/Differently Abled Students in Mainstream and Special Schools
Category
CWSN/Differently abled students in Mainstream Schools
CWSN/ Differently abled students in Special Schools
High Schools (I-X)
3
71
High Schools (VI-X)
391
0
Hr.Sec School (I-XII)
20
68
Hr.Sec School (VI-XII)
824
0
Middle School (I-VIII)
509
236
Middle School (VI-VIII)
10
0
Pre-Primary & Primary Only (I-V)
481
61
Grand Total
2238
436
Map 11.4: Heat Map of CWSN Students Enrolment in Coimbatore LPA
HEAT MAP OF CWSN STUDENT ENROLLMENT IN COIMBATORE LPA
11.2.4.2 Management of CWSN/Differently Abled Students Composition in Schools in LPA
The analysis of school enrolment data in Coimbatore reveals notable disparities in the inclusion of Children With Special Needs (CWSN) across school types and areas. Government schools have the highest inclusion rate (1.68%), followed by fully aided (1.24%) and partially aided schools (0.74%), while the number of children reported in the Central Government and unaided schools are nil. Geographically, Schools in Town Panchayats have higher enrolments in CWSN / DA Students (0.62%) as compared to the schools in the Corporation(0.44%), Revenue Villages (0.46%), and Municipalities (0.38%).
Table 11.8Management wise CWSN/Differently Abled Students Composition in Schools in LPA
School Type
Schools
Students
CWSN Students
% of CWSN students in Schools
Central Govt
4
6,755
0
0%
Fully Aided
83
20,650
255
1.24%
Government
538
104,545
1,754
1.68%
Partially Aided
32
31,087
229
0.74%
Un-aided
515
319,430
0
0%
Table 11.9Area wise CWSN/Differently Abled Students in Schools in LPA
Area
Schools
Students
CWSN Students
CWSN Students% in Area
Corporation
572
286,843
1,248
0.44%
Municipality
70
29,888
115
0.38%
Revenue Villages
343
97,320
448
0.46%
Town Panchayats
187
68,416
427
0.62%
11.2.4.3 Type of Disability among CWSN students in LPA
The Coimbatore LPA reports 2,238 Children With Special Needs (CWSN), with Intellectual Disability being the most prevalent at 58.6%. This highlights the urgent need for trained special educators, individualized learning plans, and cognitive-supportive infrastructure in both mainstream and special schools. Hearing and Locomotor Impairments each account for 7.4%, emphasizing the importance of assistive devices, accessible school design, and inclusive teaching methods. Other significant disabilities include Autism (6.7%), Multiple Disabilities (5.8%), and Specific Learning Disabilities (3.1%), all of which require multidisciplinary support. This indicates the need to focus on inclusive school infrastructure.
Table 11.10Type of Disability among CWSN students in LPA
Types of Disability
Students Count
Students Proportion
Autism
149
6.66%
Cerebral Palsy
76
3.40%
Chronic Neurological conditions
2
0.09%
Dwarfism
0
0.00%
Hearing Impairment
166
7.42%
Hemophilia
1
0.04%
Intellectual Disability
1311
58.58%
Locomotor Impairment/Handicap
166
7.42%
Mental Illness
4
0.18%
Multiple disability
129
5.76%
Muscular dystrophy
51
2.28%
Parkinsons disease
2
0.09%
Sickle cell disease
0
0.00%
Specific Learning disability
69
3.08%
Speech Impairment
0
0.00%
Thalassemia
10
0.45%
Visual Impairment (Blindness)
41
1.83%
Visual Impairment (Low-vision)
61
2.73%
Grand Total
2238
100.00%
11.2.5Adi Dravidar Department Schools
As per Census 2011, the Scheduled Caste (SC) population constitutes approximately 12.7% of the total population in Coimbatore District. The SC population is predominantly concentrated within the limits of the Coimbatore Municipal Corporation, while areas outside the Corporation exhibit relatively lower concentrations.
At present, all Adi Dravidar Department-run schools in the district—totaling sixteen (16)—are situated outside the boundaries of the Local Planning Area (LPA). Despite this, the educational needs of the SC population within the Corporation limits are being effectively met by the existing schools. These schools cater to the concentration of SC student enrollment within the city, as observed in Map 11.3, ensuring access to education for marginalised communities in the urban area.
11.2.6 Tribal Welfare Department Schools
Out of the 16 Tribal Welfare Department-run Schools in Coimbatore District, only 2 are located within the Local Planning Area (LPA) — one each in No.24 Veerapandi Part and Nayakkanpalayam Revenue Villages with a total student enrolment of 52.
Table 11.11Tribal Welfare Department Run school details in Coimbatore LPA
Administration
Number
Students Enrollment
No.24 Veerapandi Part
1
5
Nayakkanpalayam
1
47
11.2.7Spatial Coverage Analysis of Schools in Coimbatore LPA
The spatial coverage analysis of schools in the Coimbatore LPA is guided by the norms set under the Tamil Nadu Education School Policy as listed in the following Table. These norms aim to ensure equitable distribution of educational facilities and reduce travel burden on students.
Table 11.12Norms for Spatial Coverage Analysis for Schools as per TN Education School Policy
Type of institution
Distance (KM)
Primary
1 Km
Secondary
5 Km
Higher Secondary
8 Km
Source: Tamil Nadu Education School Policy
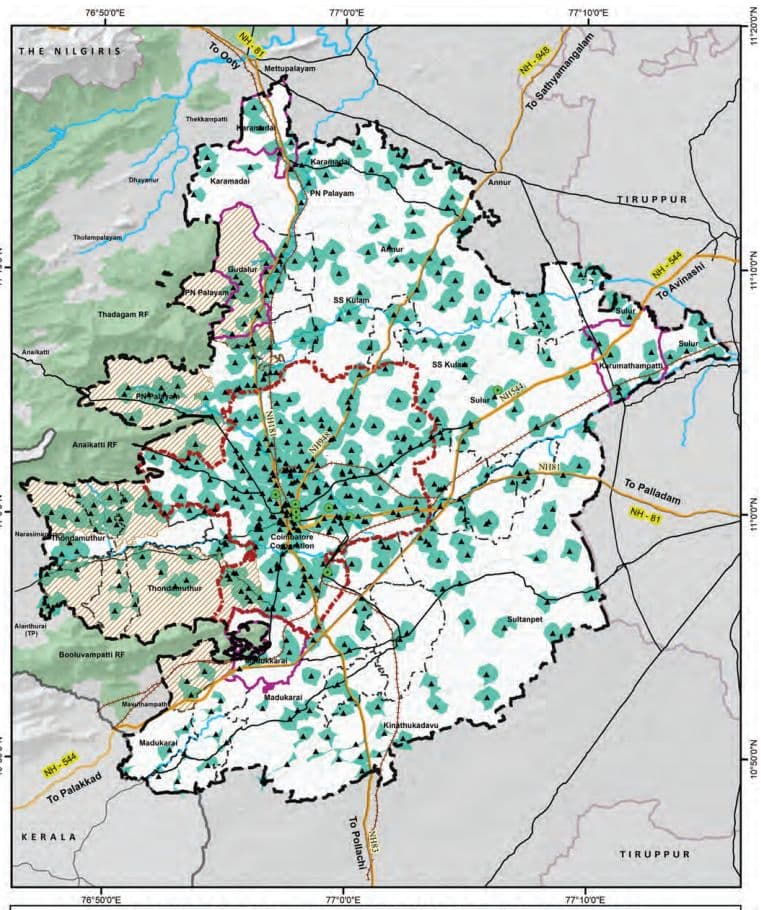
Map 11.5: Pre-Primary and Primary Schools Service Coverage Area (1km)
PRE-PRIMARY AND PRIMARY SCHOOL SERVICE AREA - 1KM
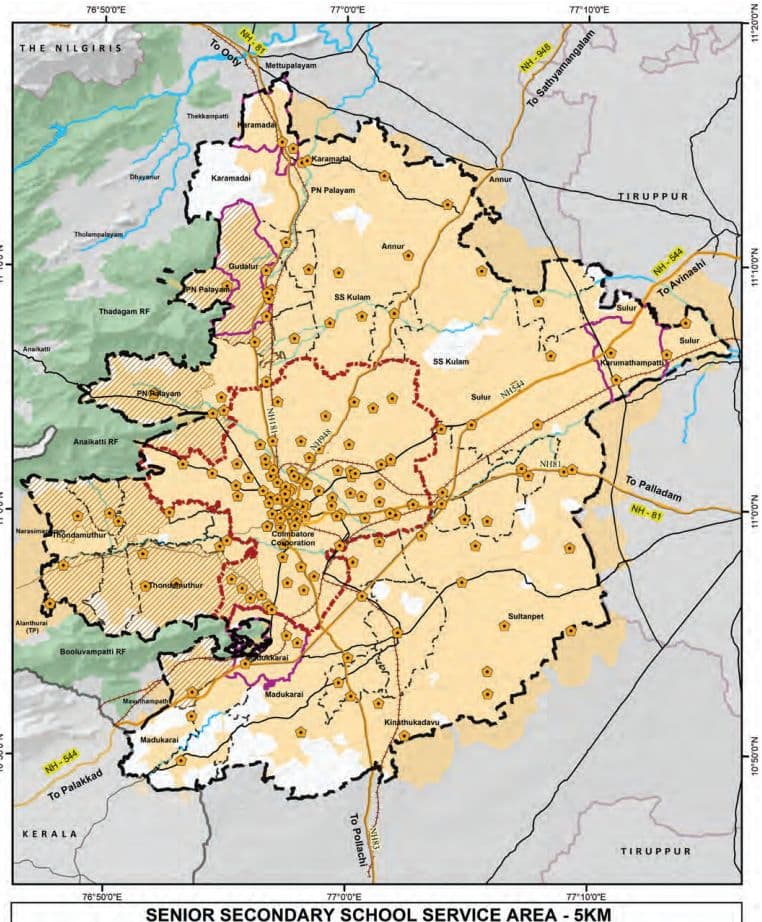
Map 11.6: Senior Schools Service Coverage Area (5km)
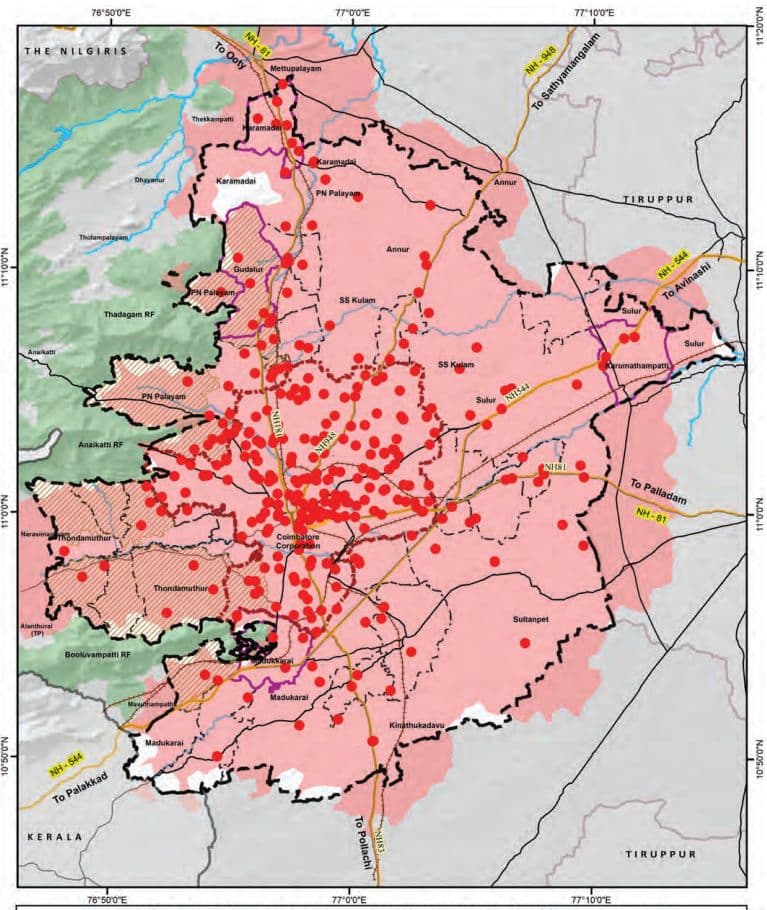
Map 11.7: Higher Secondary Schools Service Coverage Area (8km)
INTEGRATED HIGHER SECONDARY SCHOOL SERVICE AREA - 8KM
It is observed that the spatial service coverage for primary and pre-primary schools adequately encompasses the areas within the Coimbatore Corporation limits. However, regions outside the Corporation boundary, within the LPA region, exhibit relatively lower levels of coverage.
In contrast, over 90% of the Coimbatore LPA is spatially well-served by secondary and higher secondary schools, indicating a wider distribution of institutions catering to higher levels of education across the planning area.
11.2.8Projection and Gaps
The URDPFI Guidelines provide population-based thresholds for different categories of educational institutions, as presented in the below table. These benchmarks serve as a planning tool to assess the adequacy of existing educational infrastructure within a region.
Table 11.13URDPFI Guidelines with Population Threshold for the School Institutions
URDPFI Category
Threshold Populations
Pre-primary, Nursery School
2500
Primary School (I-V)
5000
Senior Secondary (VI-XII)
7500
Integrated School without hostel facility (I-XII)
90000 - 1 lakh
Integrated School with hostel facility (I-XII)
90000 - 1 lakh
Source: URDPFI
The total number of schools in each category has been derived by aggregating institutions with overlapping class ranges in accordance with URDPFI guidelines. As several schools offer multiple levels of education, the figures reflect overlaps, although the actual number of schools within the LPA is 1,172.
Table 11.14URDPFI norms -Catagory wise existing school institutions in LPA
URDPFI Category
Category of School Education
No. of Schools In Coimbatore LPA
Total No. of Schools in Coimbatore LPA
Pre-primary, Nursery School
Nursery Only (PrkG-UKG)
8
141
Nursery & Primary (Pre-KG-V)
133
Primary School (I-V)
Primary Only (I-V)
368
664
Nursery & Primary (Pre-KG-V)
133
Middle School (I-VIII)
163
Senior Secondary (VI-XII)
High Schools (VI-X)
67
170
Hr. Sec School (IX-XII)
1
Hr. Sec School (VI-XII)
98
Middle School (VI-VIII)
4
Integrated School without hostel facility (I-XII)
Hr. Sec School (I-XII)
249
318
High Schools (I-X)
69
As per the Projections in the following section, it is observed that:
Senior Secondary Schools (VI–XII): There would be additional requirement of 358 institutions by 2041,for which the space requirement would be 6.46 sq.km (as per URDPFI norms). The number of additional schools assessed to be provided by 2041, inthe Corporation is 271 school and 24 Schools and 18 Schools in the high growth blocks of PN Palayam and Sulur
Primary Schools (I–V): There would be an additional requirement of 316 primary schools by 2041 requiring an additional area of 1.26 sq. A Substancial part of the additional requirement would be in core urban areas.
Integrated Schools without hostel facilities (I–XII) show surplus availability for the 2041.
Table 11.15Projections and Gap analysis for the School Education Institutions in Coimbatore LPA as per URDPFI norms
Gaps
Gap in Schools 2021
Gap in Schools 2031
Gap in Schools 2041
Pop.2021
Primary School (I -V)
Senior Secondary (VI -XI I)
Inte-grated School without hostel facility (I -XI I)
Pop.2031
Primary School (I -V)
Senior Secondary (VI -XI I)
Inte-grated School without hostel facility (I -XI I)
Pop.2041
Primary School (I -V)
Senior Secondary (VI -XI I)
Inte-grated School without hostel facility (I -XI I)
Corporation
20,51 ,71 9
-
-24
-
27,64,842
-78
-1 1 9
-
39,03,784
-306
-271
-
M unicipal ity
1 ,82,262
-
-
2,36,449
-
-5
-
3,05,996
-3
-1 5
-
Town Panchayats
3,73,063
-
-5
-
4,59,1 88
-
-1 2
-
5,67,685
-3
-1 9
-
Annur Block
50,1 83
3 1
1
4
58,1 1 5
29
0
4
67,51 8
27
-1
4
Karamadai Block
23,784
1 5
2
4
28,728
1 4
1
4
34,773
1 3
0
4
Kinathukadavu Block
25,762
8
0
2
3 1 ,727
7
-1
2
39,204
5
-2
2
Madukarai Block
58,01 0
25
1
5
79,61 0
21
-2
5
1 ,1 3,727
1 4
-6
5
PN Palayam Block
1 ,47,01 1
38
3
23
2,21 ,1 34
23
-6
22
3,49,51 4
-3
-24
21
SS ku lam Block
11.3 Higher Education in Coimbatore LPA
By 2041, Coimbatore LPA will require approximately 7.73 sq.km of additional land to meet the additional schools indicated above. The projections highlight a pressing need for strategic land allocation and infrastructure augmentation, particularly for higher-level institutions, to accommodate the growing population and ensure equitable access to education.
Table 11.16Additional Area Requirement for the Schools Education Institutions in LPA by 2041 - as per URDPFI norms
Area Requirement 2041 in Sq.km
Category
Primary School (I-V)
Senior Secondary (VI-XII)
Corporation
1.224
4.878
Municipality
0.012
0.27
Town Panchayats
0.012
0.342
Annur Block
N/A
0.018
Karamadai Block
N/A
N/A
Kinathukadavu Block
N/A
0.036
Madukarai Block
N/A
0.108
PN Palayam Block
0.012
0.432
SS kulam Block
N/A
N/A
Sultanpet Block
N/A
N/A
Sulur Block
0.004
0.324
Thondamuthur Block
N/A
0.054
Total Revenue Villages
0.016
0.972
Area Required in Total Coimbatore LPA
1.264
6.462
Tamil Nadu, India’s leader in Gross Enrolment Ratio (GER) for higher education, owes its success to a robust network of institutions that blend academic rigor with innovation. At the heart of this achievement lies Coimbatore, a cornerstone of South India’s educational landscape. Renowned as an industrial and intellectual hub, the city hosts a diverse array of state-owned universities and specialized institutes that have consistently ranked high in the National Institutional Ranking Framework (NIRF).
11.3.1Distribution of Higher Education Institutions in LPA
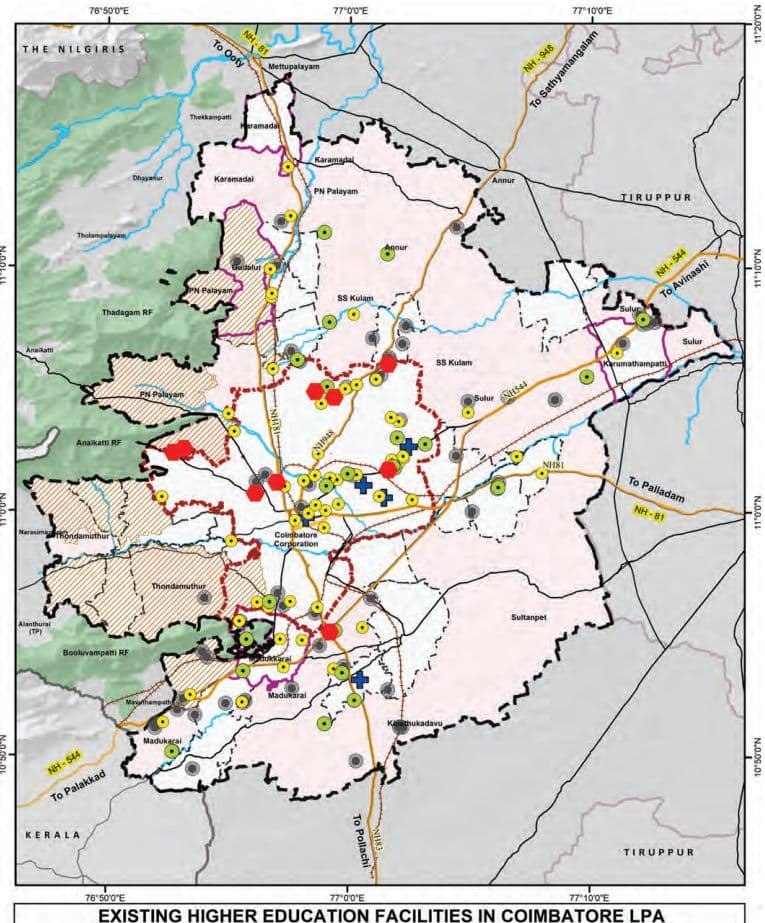
Coimbatore LPA host notable and specialized institutions such as Forest College and Research Institute (1916), Tamil Nadu Agricultural University (1971), Air Force Administrative college 1946, PSG College of Technology, Coimbatore Institute of Technology (CIT), Coimbatore Medical College, and the Government Law College.
The distribution of higher education institutions is depicted in the Map 11.8. The Engineering institutions constituting 41% (73 of 180) of all institutions, with notable penetration in rural areas (25 in Revenue Villages), aligns with the region’s industrial potential. Arts & Science colleges area primarily located in the urban areas (36 out of 60 in the Corporation).
Table 11.17Category wise Distribution of Higher Education Institutions in LPA
Category
Corporation
Municipality
Town Panchayat
Revenue Villages
Total LPA
Engineering
19
6
23
25
73
Arts & Science
36
6
10
8
60
Polytechnic
8
3
4
8
23
Medical Institute
4
0
1
0
5
University
9
0
0
1
10
Others
0
0
0
9
9
Grand Total
76
15
38
51
180
Source: Directorate of Higher Education
Map 11.8: Existing Higher Education Facilities in Coimbatore LPA
11.3.2Projection and Gap analysis of Higher Education Institutions
Table 11.18URDPFI Norms for Population Threshold of Higher Education Institutions
URDPFI guideline
Services
Threshold population
Arts & Science College
1,25,000
Engineering college
10,00,000
Medical college
10,00,000
The following table presents the gap analysis of higher education institutions within the Coimbatore Local Planning Area (LPA), based on the projected population growth for the years 2021, 2031, and 2041. The analysis, carried out in accordance with the URDPFI Guidelines, indicates a consistent surplus across most categories of higher education institutions, including engineering, medical, arts, and technical colleges. The existing infrastructure is adequate to meet the needs of the projected population.
Table 11.19Projections and Gap Analysis for the Higher Education Institutions in Coimbatore LPA as per URDPFI norms
Category
Existing Institution numbers
Estimated population - 2021(31,62,392)
Estimated population -2031(42,04,955)
Estimated population -2041(58,24,706)
Required
Surplus/Gap
Required
Surplus/Gap
Required
Surplus/Gap
Technical Education
25
3
22
4
21
6
19
Arts College
60
25
35
34
26
47
13
Engineering college
73
3
70
4
69
6
67
Medical college
5
3
2
4
1
6
-1
11.4
Existing Health
Care Facilities
However, by 2041, when the estimated population reaches approximately 58.24 lakh, the demand for medical colleges is projected to slightly exceed supply, resulting in a marginal deficit of one institution. Surpluses persist in other sectors, including technical (19 institutions), arts (13 institutions), and engineering (67 institutions). This trend suggests that while the existing higher education infrastructure remains largely adequate. To cater to the projected demand by 2041, the existing medical colleges will need to be expanded with additional capacity. Strategic planning should prioritize addressing potential gaps in medical education while maintaining optimal capacity across other disciplines to align with long-term educational needs.
Coimbatore Local Planning Area (LPA) hosts a wellstructured network of healthcare facilities catering to primary, secondary, and tertiary care needs. The system includes government and private institutions that provide a range of services—from preventive and basic healthcare to advanced medical and surgical treatments. Facilities are categorized based on their service levels, ensuring accessibility from rural sub-centres to urban multispecialty hospitals. They are categorised as follows:
Table 11.20Types of Health Care Facilities
Facility Name
Care Level
Typical Services / Basic Equipment
Health Sub-Centre (HSC / SC)
Primary Care
First contact point, maternal and child care, immunization, basic first aid, referrals
Primary Health Centre (PHC)
Primary Care
Outpatient care, maternity services, immunization, treatment of minor ailments, basic diagnostic support
Urban Primary Health Centre (UPHC)
Primary Care
OPD, maternal & child health, immunization, NCD screening, basic laboratory and pharmacy services
Community Health Centre (CHC)
Secondary Care
Emergency services, labour room, diagnostic services, minor surgeries, specialist consultations
Taluk Hospital / Sub-District Hospital (SDH)
Secondary Care
General OPD and IPD, maternity care, basic surgeries, diagnostics, referral services
ESI Hospital (Medical College)
Tertiary Care
Inpatient and specialist care, ICU, diagnostics, trauma care, medical education and training
Government Hospital (GH)
Tertiary Care
Multispecialty services, surgeries, ICU, blood bank, emergency care, diagnostics
District Hospital (DH)
Tertiary Care
Comprehensive care including trauma services, surgery, ICU, multi-specialty diagnostics and treatment
Multi-specialty Hospital (Private Sector)
Tertiary Care
Advanced diagnostics, critical care, specialized surgeries, multiple specialty departments
Source:IPHS
11.4.1Distribution of Health Care Facilities
Table 11.21Distribution of Health Care Facilities in Coimbatore LPA
Category
Corporation
Municipality
Town Panchayat
Revenue Villages
Total LPA
HSC
0
0
13
47
60
UPHC
34
0
0
0
34
PHC
0
2
9
4
15
CHC/ UGPHC
0
2
2
1
5
Taluk Hospital
1
1
1
2
5
Private MSH
8
0
0
0
8
Medical College Hospital
4
0
1
0
5
Grand Total
47
5
26
54
132
Source: Health Department, Coimbatore District
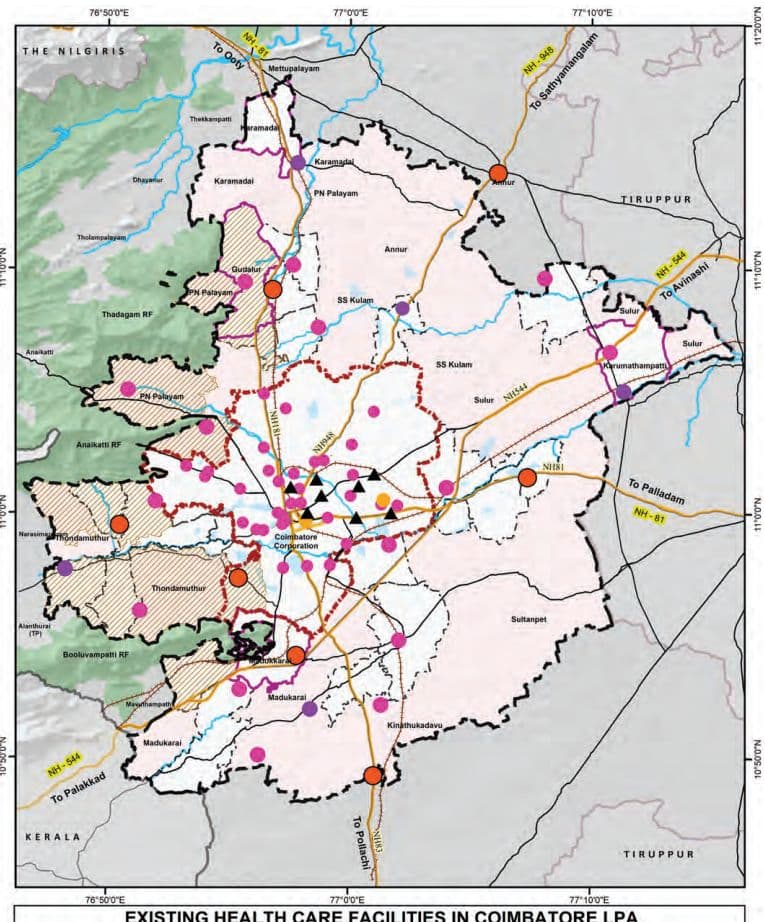
The distribution of healthcare facilities within the Coimbatore Local Planning Area (LPA) reflects a tiered system suited to the area’s urban and rural needs, with a total of 132 institutions spread across Corporation, Municipality, Town Panchayat, and Village areas. Revenue Villages have the highest number of facilities (54), followed by the Corporation (47), Town Panchayats (26), and Municipalities (5).
In the Corporation area there are with 34 Urban Primary Health Centres (UPHCs), 8 Private Multi-Specialty Hospitals, 1 Taluk Hospital and 2 Medical College Hospitals. These facilities cater to specialized and tertiary care.
Municipalities have a total of 5 healthcare institutions: 2 Primary Health Centres (PHCs), 2 Community Health Centres/Upgraded PHCs (CHC/UGPHCs), and 1 Taluk Hospital.
Town Panchayats have 13 HSCs, 9 PHCs, 2 CHC/UGPHCs, and 1 Taluk Hospitals, indicating a structured approach to primary and referral care in semi-urban areas.
Revenue Villages are primarily served by 47 HSCs, along with 4 PHCs, 1 CHC/UGPHC, and 2 Taluk Hospitals
Map 11.9: Existing Health Care Facilities in Coimbatore LPA
EXISTING HEALTH CARE FACILITIES IN COIMBATORE LPA
(located near the LPA boundary), showing a strong foundation in basic healthcare delivery and referral care.
Overall, the distribution ensures wide coverage of primary care in rural and semi-urban areas, while advanced and private healthcare services are concentrated in the urban areas.
11.4.1.1 Mental Health Care Units
Coimbatore has a well-established network of mental healthcare services, predominantly offered through private clinics, multi-speciality hospitals, and specialized rehabilitation centres. These facilities provide a range of services including psychiatric consultation, counselling, therapy, and long-term care, contributing significantly to the city’s mental health ecosystem. The presence of experienced mental health professionals and diverse treatment options across the private sector ensures that residents have access to quality care.
Map 11.10: Mental Health Care Facilities in Coimbatore LPA
EXISTING MENTAL HEALTH CARE FACILITIES IN COIMBATORE LPA
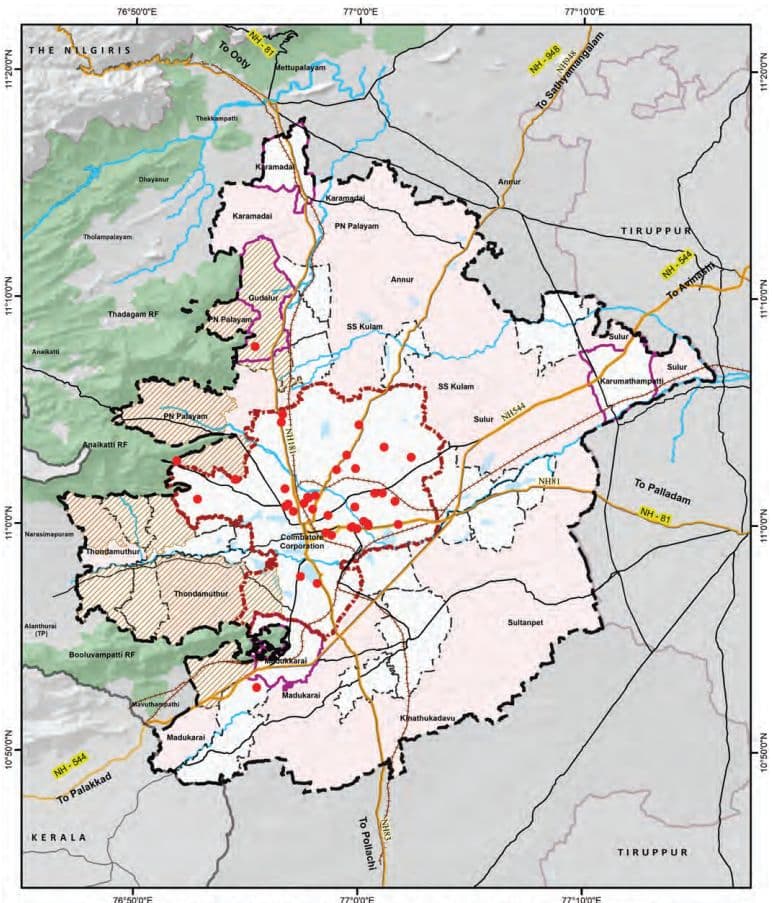
11.4.2Golden Hour Access -Health Facilities Service Coverage Analysis
The concept of the “Golden Hour” represents the critical first sixty minutes following a traumatic injury, during which timely medical intervention significantly enhances the chances of survival and reduces the risk of long-term complications. Within this timeframe, the ability to provide rapid on-site stabilization and swift transportation to a trauma care center is essential.
Access Time: While the full “golden hour” encompasses 60 minutes, studies and emergency response protocols indicate that the first 10 following an incident are especially vital for determining outcomes. In a practical scenario, however, the time taken for an ambulance to reach the site of injury and few additional time may be required to transport the patient from the site to the trauma care facility. This time taken is also depending on various factors such as terrain, traffic, and resource availability.
However, the travel time coverage modeled in this analysis is intended to represent a conservative estimate of the outbound journey, effectively accounting for a total response window of approximately 20 to 25 minutes. This approach enables the identification of areas where a patient can reasonably be reached and transported to a trauma care center within the “golden hour” framework, accounting for both directions of travel.
Coimbatore has witnessed significant growth in road infrastructure, vehicular movement, and population density. With this rapid growth comes an increased risk of road traffic accidents and associated trauma. In such a context, assessing the spatial distribution of trauma care accessibility within this practical response window becomes imperative to inform health system strengthening, infrastructure investment, and emergency preparedness planning.
11.4.2.1 Network Analysis - for the Health Care Service Coverage Analysis:
The network study is designed to identify Revenue Villages and urban areas that fall within this access zone, as well as those that remain underserved. The analysis was conducted using GIS, OpenRouteService (ORS) Tool, and Open Street Map (OSM), considering the road network.
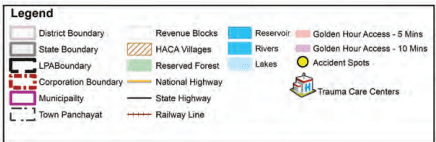
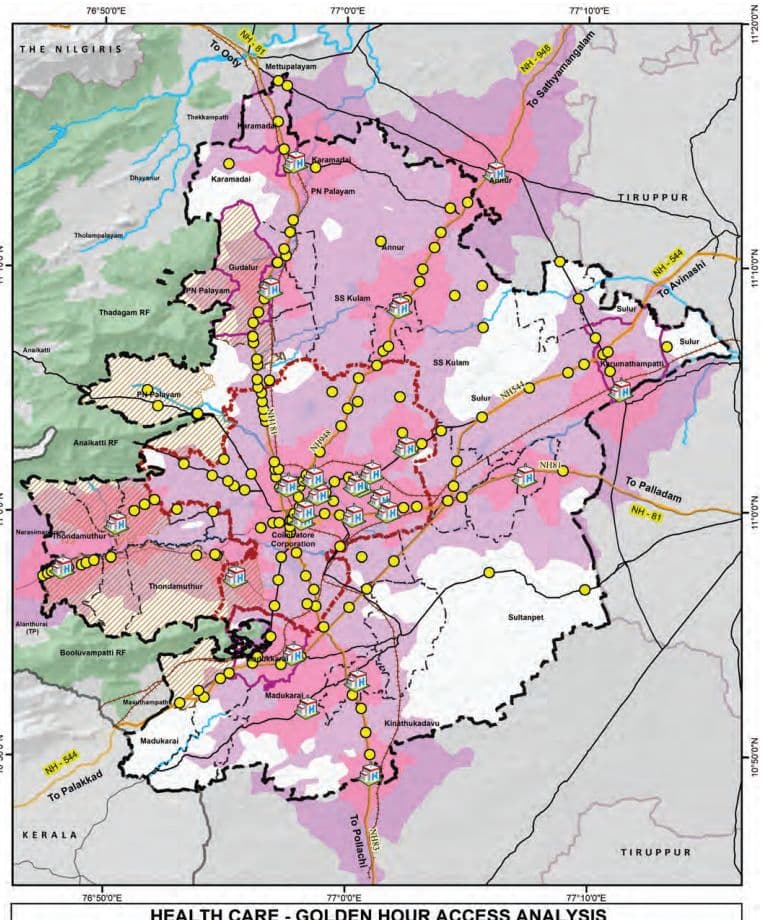
Map 11.11: Golden Hour Coverage Analysis (5-10 mins coverage)
HEALTH CARE - GOLDEN HOUR ACCESS ANALYSIS
Network Analysis Inference: The analysis of trauma care accessibility in Coimbatore LPA reveals significant spatial disparity between urban and rural regions.
• Urban areas such as the Coimbatore Municipal Corporation exhibit a high level of emergency service coverage, with approximately 95% of the area falling within the golden hour access zone.
Similarly, municipalities and town panchayats show substantial coverage levels of 85% and 81% respectively, reflecting relatively well-established road networks and proximity to health facilities.
• The Revenue Villages demonstrate a notably lower coverage of approximately 60%, indicating critical gaps in trauma care accessibility.
Around 11 Revenue Villages fall entirely outside the golden hour zone, with 0% coverage, highlighting their vulnerability in emergency situations. These include: Bogampatti, Chinnathadagam, Idayar palayam, Kallapalayam, Nanjundapuram, Naranapuram, No.24 Veerapandi Part, Pappampatti, Pichanur, Selakkarichel, and Panapatti
In addition, a few Revenue Villages have partial coverage (less than 25%) but remain significantly underserved: Pannimadai – 5%, Mylampatti – 9%, Semmandampalayam – 11%, Somayampalayam – 12%, Pachapalayam – 14% and Pottaayandipurambu – 24%.
These findings underscore the urgent need for targeted interventions in rural areas, such as enhancing road connectivity, deploying decentralized trauma response units, and expanding emergency medical infrastructure. Addressing these accessibility gaps is vital to strengthening the health care delivery system across the entire planning area and ensuring equitable health outcomes for both urban and rural populations.
11.4.3Spatial Coverage Analysis for the Health Care Facilities
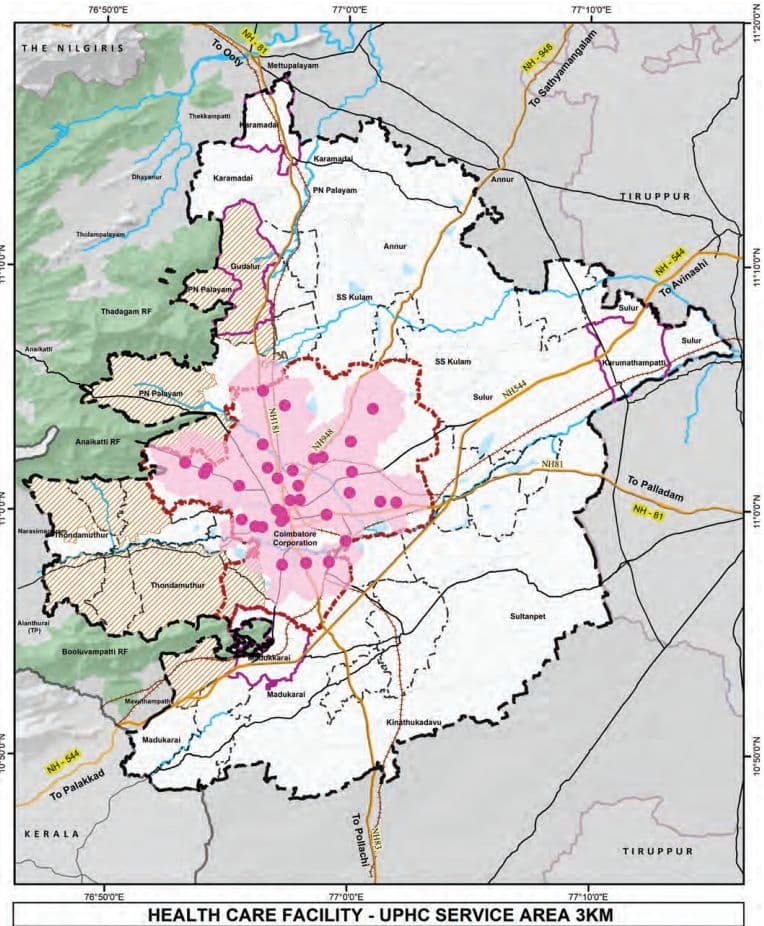
It is observed that the healthcare service coverage analysis for Coimbatore LPA reveals significant disparities in accessibility across different regions. Within the Coimbatore Corporation limits, Urban Primary Health Centers (UPHCs)
Map 11.12: Service Coverage Analysis for UPHC facilities (3Km)
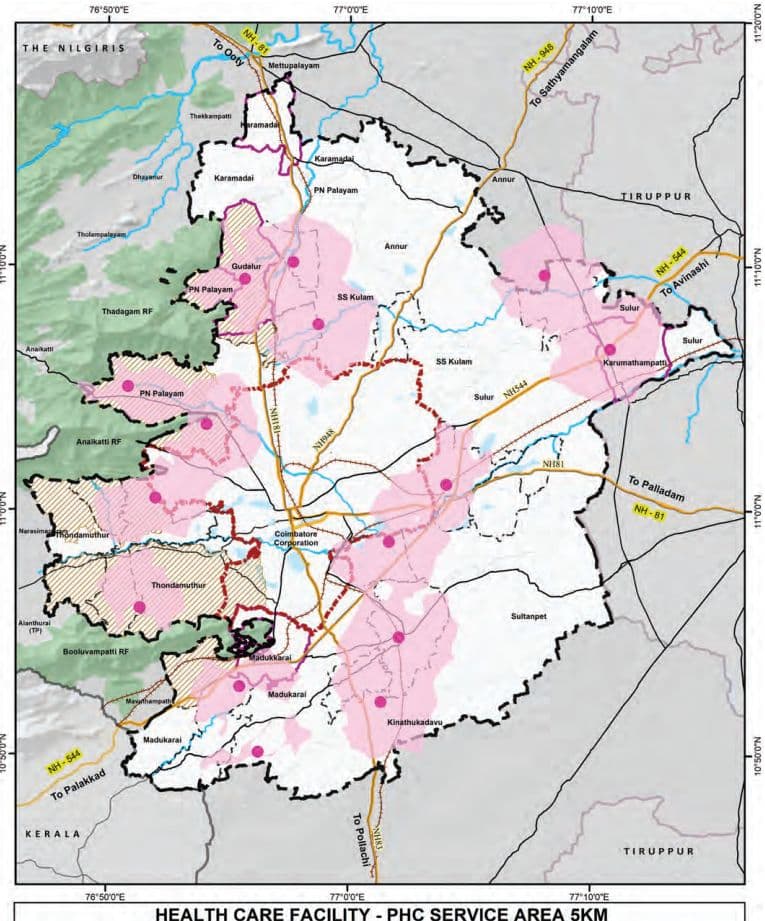
Map 11.13: Service Coverage Analysis for PHC facilities (5Km)
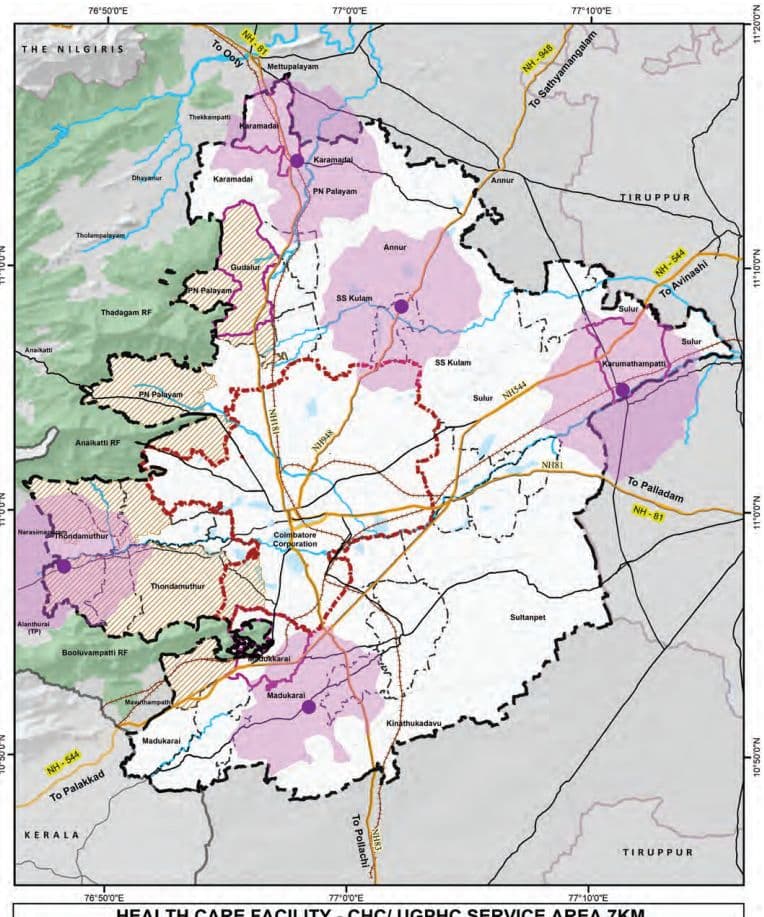
Map 11.14: Service Coverage Analysis for UPHC facilities (7Km)
HEALTH CARE FACILITY - CHC/ UGPHC SERVICE AREA 7KM
provide nearly complete coverage, ensuring adequate primary healthcare services for urban residents.
However, in rural areas, Primary Health Centers (PHCs) are predominantly located along major transportation corridors, leaving many interior Revenue Villages with limited access to basic medical care. For secondary healthcare needs, Community Health Centers (CHCs) and Upgraded PHCs, in the northern and southern parts of the LPA offer sufficient coverage.
A concerning gap exists in the eastern region, which lacks both primary and secondary healthcare facilities, creating a significant service void for the local population. This imbalance highlights the urgent need for strategic expansion of healthcare infrastructure, particularly in the underserved eastern rural areas.
11.4.4Distribution of Beds in Hospitals
As per the Indian Public Health Standards (IPHS) guidelines, essential beds refer to the minimum required inpatient beds provided in public health facilities. These facilities form the backbone of the public healthcare delivery system, focusing on accessible and affordable primary and secondary healthcare. The desirable beds are those available over and above the essential bed count in all facilities, including the advanced and tertiary care facilities. While not mandated under IPHS, desirable beds are critical for addressing complex health needs and emergencies and play a vital role in comprehensive healthcare provisioning in urban areas.
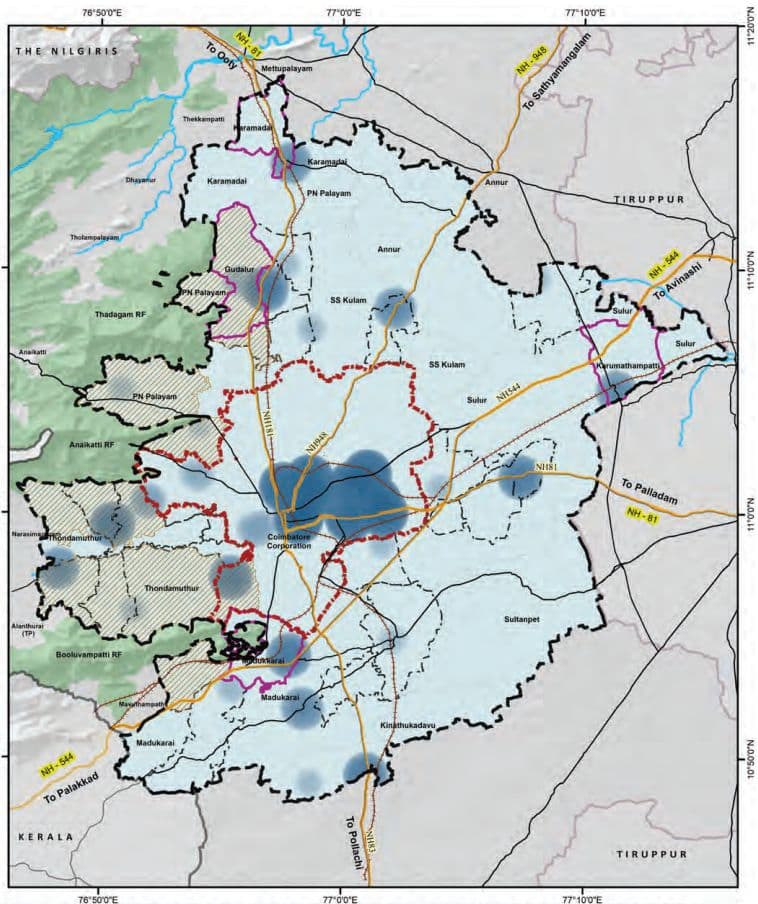
Map 11.15: Heat Map of Health Care Facilities -Beds in Coimbatore LPA
HEAT MAP OF NUMBER OF HEALTH CARE BEDS IN COIMBATORE LPA
Table 11.22Distribution of Hospital Beds in Coimbatore LPA
Category
Corporation
Municipality
Town Panchayat
Revenue Villages
Total LPA
Essential Beds
HSC
-
-
13
52
65
UPHC
49
-
-
-
49
PHC
-
10
54
13
77
CHC/ UGPHC
-
60
60
30
150
Taluk Hospital
50
60
183
-
293
Total (Essential beds)
99
130
310
95
634
Desirable Beds
Private MSH
2400
-
-
-
2400
Medical College Hospital
600
-
-
-
600
Total
3000
0
0
0
3000
Grand Total (Desirable Beds)
3099
130
310
95
3634
The distribution of hospital beds within the Coimbatore Local Planning Area (LPA) highlights the natural healthcare hierarchy that supports the needs of both urban and rural populations. Advanced tertiary healthcare facilities—comprising private multi-specialty hospitals and medical college hospitals—are primarily concentrated within the Corporation limits, accounting for approximately 3,000 of the total 3,634 beds, ensuring high-quality medical services at the urban core. At the same time, essential healthcare infrastructure, including Primary Health Centres (PHCs), Community Health Centres (CHCs), and Taluk Hospitals, is well-represented across Town Panchayats, contributing to broad and inclusive service coverage.
11.4.5 Projections and Gaps of Health Care Facilities in Coimbatore LPA Table 11.23: Indian Public Health Service Guidelines for the Health care Facilities
IPHS guideline
Services
Population per Unit
Bed Norms
HSC
5,000
Essential bed norms: 1 bed for 1000 people Desirable bed norms: 2 bed for 1000 people
UPHC (Urban)
50,000
PHC
30,000
UGPHC/ CHC (Rural)
1,20,000
Taluk / Sub-District Hospital
10 lakh
District Hospital
1 DH per District
According to the Indian Public Health Standards (IPHS) 2022 guidelines, in alignment with the National Health Policy, 2017, the recommended provision of hospital beds is based on a norm of one bed per 1,000 population as an essential requirement, with two beds per 1,000 population as the desirable target to strengthen the public healthcare delivery system.
The essential number of hospital beds is to be met exclusively through infrastructure available under the public sector, including Primary Health Centres (PHCs), Health Sub-Centers (HSCs), Community Health Centres (CHCs), Sub-District Hospitals (SDH) or Taluk Level Hospitals, and District Hospitals (DH). It is also explicitly stated that beds available in tertiary care institutions such as Medical College Hospitals shall not be included in the calculation of essential bed requirements but in the desirable bed count, as such institutions serve a wider catchment area beyond a single district.
Similarly, beds available in private healthcare facilities, including private multi-specialty hospitals, are excluded from the calculation of essential public sector capacity. However, in the context of achieving the desirable norm, the contribution of the private sector and other institutional healthcare providers—such as those operated by the Railways, Armed Forces, Employees’ State Insurance (ESI), and Public Sector Undertakings (PSUs)—may be
considered, particularly in regions where these facilities provide accessible and functional inpatient care for more than 24 hours.
These norms ensures that the public healthcare system is independently capable of meeting the minimum inpatient care needs of the district population, irrespective of the availability of tertiary or private healthcare infrastructure.
Table 11.24Projections – Healthcare Facilities in Coimbatore LPA
Gaps
Health Care Facilities 2021
Health Care Facilities 2031
Health Care Facilities 2041
Area Requirement 2041 (in Sq.Km)
Population 2021
UPHC / PHC
CHC / UGPHC
Population 2031
UPHC / PHC
CHC / UGPHC
Population 2041
UPHC / PHC
CHC / UGPHC
UPHC / PHC
CHC / UGPHC
Corporation
20,51,719
-7
0
27,64,842
-21
0
39,03,784
-44
0
0.088
0
Municipality
1,82,262
-2
0
2,36,449
-2
0
3,05,996
-4
-2
0.008
0.006
Town Panchayats
3,73,063
-6
0
4,59,188
-9
0
5,67,685
-12
2
0.026
0
Annur Block
50,183
-2
0
58,115
-2
0
67,518
-2
-1
0.004
0.003
Karamadai Block
23,784
-1
0
28,728
-1
0
34,773
-1
0
0.002
0
Kinathukadavu Block
25,762
-1
0
31,727
-1
0
39,204
-1
0
0.002
0
Madukarai Block
58,010
0
1
79,610
-1
0
1,13,727
-2
0
0.004
0
PN Palayam Block
1,47,011
-3
-1
2,21,134
-5
-2
3,49,514
-10
-3
0.02
0.009
SS kulam Block
34,520
-1
0
39,984
-1
0
46,338
-2
0
0.004
0
Sultanpet Block
27,250
-1
0
Table 11.25Projections - Healthcare Facilities (Taluk Hospitals) in Coimbatore LPA
Gap
Health Care Facilities 2021
Health Care Facilities2031
Health Care Facilities2041
Area Requirement by 2041 (in Sq. Km)
Population2021
Taluk Hospital
Population2031
Taluk Hospital
Population2041
Taluk Hospital
Annur Taluk
1 07284
1
1 25096
1
1 46273
1
0
Coimbatore (North) Taluk
71 7620
-1
1 1 77698
-1
2002386
-2
0.01
Coimbatore (South) Taluk
1 1 9 1 951
-1
1 3521 64
-1
1 5339 1 2
-2
0.01
Kinathukadavu Taluk
25762
1
3 1 727
1
39204
1
0
Madukkarai Taluk
500547
0
700283
0
993856
0
0
Mettupalayam Taluk
701 85
1
89953
1
1 1 5558
1
0
Perur Taluk
21 8903
1
283750
1
374461
1
0
Su lur Taluk
3301 41
1
444285
1
61 9055
0
0
Gap in Total Coimbatore LPA
3 1 ,62,392
-2
42,04,955
-2
58,24,706
-4
0.04
As per the projected population for the year 2041, Coimbatore Local Planning Area (LPA) is expected to require a significant addition in primary and secondary health facilitiesIn 2021, there was a deficit of 31 UPHCs/ PHCs and 2 CHCs/UGPHCs. By 2041, the required numbers of these facilities would increase to 91 and 7 respectively, to serve a projected population of 58.24 lakh. The Coimbatore Corporation area alone will require 44 additional UPHCs by 2041. For the additional health care facilities, a total area of 0.21 Sq.km is assessed.
Taluks such as Coimbatore North and South lacks taluk hospitals and hence these taluks will require taluk hospital to meet the growing demand. A cumulative area of 0.02 Sq.km will be required for these additional taluk hospitals, while others like Perur and Mettupalayam will be comparatively better equipped by 2041. This also indicates the requirement for substantial augmentation of primary and community-level healthcare facilities to meet the growing demand.
Table 11.26Demand and Gap Analysis of beds requirement for Overall LPA
Category
Existing Health facilities in Coimbatore LPA
Estimated population - 2021(31,62,392)
Estimated population -2031(42,04,955)
Estimated population - 2041(58,24,706)
Required
Surplus/Gap
Required
Surplus/Gap
Required
Surplus/Gap
Essential Beds
UPHC
634
553
81
613
21
726
-92
HSC & PHC
CHC/UGPHC
Taluk Hospital
Desirable Beds
UPHC
3000
700
2300
700
2300
700
2300
HSC & PHC
CHC/UGPHC
Taluk Hospital
Based on IPHS norms, Coimbatore will need a 100 essential bedded hospital by 2041, which is expected to be met through the proposed taluk hospitals.
The number of desirable beds available in private hospitals and medical colleges is in surplus of 2300 beds even for the projected demand of 2041.
In conclusion, bridging the projected gap in essential bed capacity while ensuring strategic utilization of the surplus desirable beds will be critical to achieving an inclusive, responsive, and resilient health system in Coimbatore LPA.
11.4.6 Veterinary Hospital Facilities
Table 11.27Existing and Projected Gap by 2041 - for the Veterinary Hospital Facilities
Taluk
Existing Veterinary Hospitals
Gap analysis of Veterinary Hospitals -(Deficit by 2041)
Population Threshold
1 unit per 50000 Population
Annur
1
1 (Surplus)
Coimbatore (North)
3
-1 (0.002 sq.km)
Coimbatore (South)
0
-3 (0.006 sq.km)
Kinathukadavu
0
0 (Surplus)
Madukkarai
1
-1 (0.002 sq.km)
Mettupalayam
0
0 (Surplus)
Perur
1
0 (Surplus)
Sulur
1
0 (Surplus)
Total Deficit
7
-5 (0.010 sq.km)
Source: TNGIS (Existing Data), URDPFI (Norms)
Map 11.16: Distribution of veterinary Hospitals in Coimbatore LPA
EXISTING VETERINARY HOSPITAL FACILITIES IN COIMBATORE LPA
11.5 Recreational Facilities
The existing Veterinary Hospital facilities are primarily concentrated along the three major roads namely Avinashi road, Sathy Road and Mettupalayam Road, leaving peripheral regions underserved.
A gap analysis of veterinary hospitals in the Coimbatore Local Planning Area (LPA), based on the URDPFI guideline of one veterinary hospital facility per 50,000 population, highlights a total deficit of 5 veterinary hospitals by 2041.
While Taluks such as Annur, Kinathukadavu, Mettupalayam, and Perur show adequate or surplus facilities, deficits are observed in few taluks namely: Coimbatore (North), Coimbatore (South), and Madukkarai, with Coimbatore (South) having the highest shortfall of three hospitals. Establishing additional veterinary hospitals in deficit areas is essential to meet future demand and ensure equitable access to animal healthcare services across the LPA.
The recreational facilities play a vital role in enhancing the quality of life and well-being of urban residents as well as offering a diverse range of recreational opportunities catering to various age groups and socio-economic segments. Coimbatore is endowed with a mix of natural, cultural, and built recreational assets, including parks, stadiums, sports complexes, cultural venues, informal gathering spaces, and lakes.
11.5.1Parks and Open spaces
While Coimbatore Corporation spans a total area of 257.81 sq.km, a cumulative 2.43 sq.km has been designated as parks and open spaces. These include various typologies such as Community Parks (CPS), Open Space Reservations (OSR), public parks, playfields, and public purpose lands as listed below in the table.
Table 11.28Category wise distribution of Parks and Open Spaces
Category
Total Count
CPS
190
OSR
230
PARK
1466
PLAY FIELD
39
PUBLIC PURPOSE
320
TOTAL
2,245
Source: Coimbatore Corporation
In the Coimbatore Corporation, a total of 2,245 sites is designated for recreational and open spaces. This comprises 1,466 parks, 230 Open Space Reservation (OSR) sites, 190 CPS sites, 39 playfields, and 320 public purpose sites. These spaces play a vital role in enhancing urban livability, providing recreational, ecological, and community services across the LPA.
Table 11.29Proposed Open Spaces (across sectors) in the Master Plan
Particulars
Area in Sq.km
Existing Recreational Open Space
2.43
Lake Conservation Area
0.43
River Conservation Area
2.48
Proposed Ecoparks
16.12
Total Open Space
21.46
Map 11.17: Existing Parks and Open Spaces in Coimbatore Corporation
77°0'0"E
Existing Parks and Open Spaces in Coimbatore Corporation
Directorate of Town & Country Planning - Tamil Nadu
DATA SOURCE Coimbatore Corporation DTCP, Coimbatore
DIRECTORATE OF TOWN & COUNTRY PLANNING - TAMIL NADU
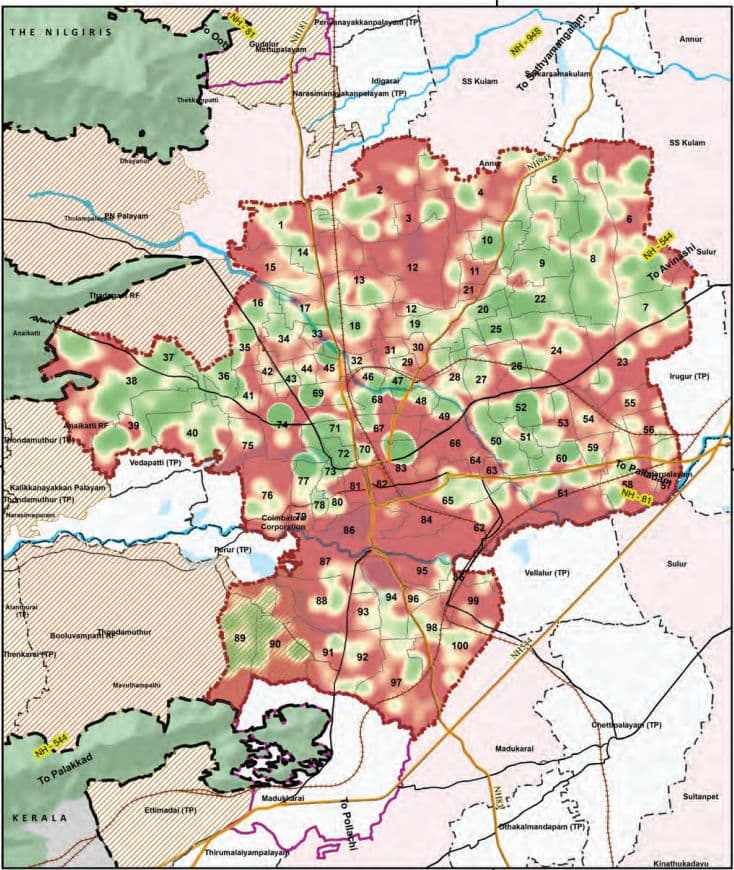
Map 11.18: Heat Map of Parks and Open Spaces in Coimbatore Corporation
77°0'0"E
77°0'0"E
Heat Map of Existing Parks and Open Spaces in Coimbatore Corporation
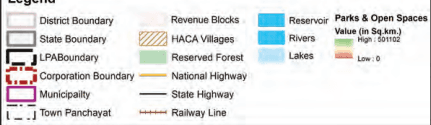
Legend
Planning Norms and Standards:
According to the URDPFI Guidelines, a minimum of 10–12 sq.m of open space per person is desirable and recommended in urban areas. This includes recreational green spaces such as parks, playgrounds, gardens, and public open lands that contribute to physical and mental well-being, environmental sustainability, and community interaction.
URDPFI Guideline Norm: 10–12 sqm per person
Coimbatore LPA (2041): 3.68 sqm per person (approx.) expected.
After accounting for the existing recreational open spaces, proposed lake and river buffers, and planned ecoparks—amounting to a total of 21.46 sq.km—an additional 36.79 sq.km of open space will be required by 2041. To support this future need, enhancing access to green spaces and recreational areas will be key to promoting urban liveability, public health, and environmental sustainability.
11.5.2Unique Recreational Facilities
Coimbatore is home to a range of unique recreational facilities that contribute significantly to the city’s ecological, educational, and tourism value. Key among them are botanical gardens, zoos, nature parks, and eco-tourism destinations, which collectively offer not only leisure but also environmental awareness and biodiversity conservation.
TNAU Botanical Garden: Located within the Tamil Nadu Agricultural University (TNAU), this garden serves as a green lung within the city. It showcases a wide variety of plant species, including medicinal, ornamental, and endemic varieties, supporting both academic and public engagement.
VOC Park and Zoo: Located in the city center, the park includes a mini zoo that attracts thousands of visitors annually. Though modest in size, it remains one of the most accessible nature-centric recreational spaces in the city.
The proximity to the Western Ghats, particularly locations such as Marudhamalai, Velliangiri Hills, and Siruvani, enhances the city’s access to ecotourism and trekking activities. These areas are frequently visited for spiritual tourism, nature walks, and weekend retreats.
11.5.3Multipurpose Grounds
Multipurpose grounds play an essential role in enhancing the social infrastructure of urban areas by providing open, adaptable spaces that can accommodate a variety of public activities, including exhibitions, sports events, cultural programs, and emergency functions. In the Coimbatore Local Planning Area (LPA), the availability of such grounds is limited, with only two major multipurpose venues presently serving the city: the CODISSIA Trade Fair Complex and the Race Course Police Grounds.
CODISSIA Trade Fair Complex: Located near the Coimbatore International Airport in Peelamedu, the CODISSIA Trade Fair Complex is a prominent facility that regularly hosts industrial exhibitions, trade fairs, product expos, and conferences. Developed and managed by the Coimbatore District Small Industries Association (CODISSIA), this ground plays a critical role in supporting Coimbatore’s industrial and entrepreneurial ecosystem. While it primarily functions as a trade and exhibition venue, its vast open area allows for temporary adaptation for cultural and public events as needed.
Race Course Police Grounds: Situated in the central part of the city along the Race Course Road, the Police Grounds serve as another important multipurpose venue. Though primarily designated for official and ceremonial functions, including police parades and government events, public gatherings, awareness campaigns, and sports meets on certain occasions.
11.5.4Stadium and Sports Infrastructure
Coimbatore has a modest yet significant sports infrastructure supporting professional, academic, and community-level activities.
District stadium: Jawaharlal Nehru Stadium is a major district-level multi-purpose stadium, primarily used for football and athletics. It has a seating capacity of around 30,000 and is owned by the Coimbatore Municipal Corporation
Sports Complexes like the District Sports Complex (Peelamedu) provide indoor courts and coaching. Several private clubs and educational institutions also maintain sports grounds, though access is often limited.
Green Corridor in Race Course is situated centrally in Coimbatore near Town Hall locality. The Race Course is a
11.6 Safety and Emergency Services
popular 2.2 km green corridor known for walking, jogging, and fitness activities. The Coimbatore Race Course was originally developed during the British colonial period as a horse racing track. Over time, it evolved into a public recreational space. Today, while horse racing no longer takes place, the area remains a prominent civic landmark, symbolizing Coimbatore’s colonial heritage and urban transformation. At present, it is surrounded by elite clubs and recreational amenities, and it enhances urban livability by offering open space, wellness opportunities, and social engagement, playing a vital role in the city’s social infrastructure.
Race Clubs: Coimbatore hosts prominent race clubs and facilities that have significantly contributed to the growth of motor racing in the country.
Coimbatore Auto Sports Club (CASC): Located in R.S. Puram, it is among India’s oldest motorsport clubs, organising rallies, hill climbs, and autocross events under FMSCI, and plays a key role in nurturing local racing talent.
Kari Motor Speedway: Situated in Chettipalayam, around 20 km south of the city centre along the Coimbatore–Pollachi Highway (NH 83), this 2.1 km Kari Motor Speedway has hosted national races since 2003. It serves as a premier circuit for training and professional motorsport events.
Rifle Club, located near Avinashi Road, provides professional shooting facilities and training in rifle and pistol sports. It promotes physical discipline and skill development among youth and enthusiasts.
Ensuring the safety, security, and well-being of the population is a fundamental responsibility of urban governance. Within the Coimbatore Local Planning Area (LPA), the provision and spatial distribution of safety and emergency services—including police stations, fire stations, and correctional facilities—are essential components of a resilient urban framework. These services play a crucial role in upholding law and order, responding to emergencies, managing disasters, and reinforcing public confidence in institutional systems.
Table 11.30Existing Safety and Emergency Services in Coimbatore LPA
Existing Number of Safety and Emergency Services - Facilities in the Coimbatore LPA
Location
Police Station
Fire Station
Prison /Jail
Corporation
15
5
1
Total Municipalities
3
2
0
Town Panchayats
6
3
0
Annur Block
0
0
0
Karamadai Block
0
0
0
Kinathukadavu Block
0
1
0
Madukarai Block
0
0
0
PN Palayam Block
2
0
0
SS kulam Block
0
0
0
Sultanpet Block
0
0
0
Sulur Block
0
0
0
Thondamuthur Block
1
0
0
Total Existing Facilities in LPA
27
11
1
Source: TNGIS, Tamil Nadu Fire and Rescue Department
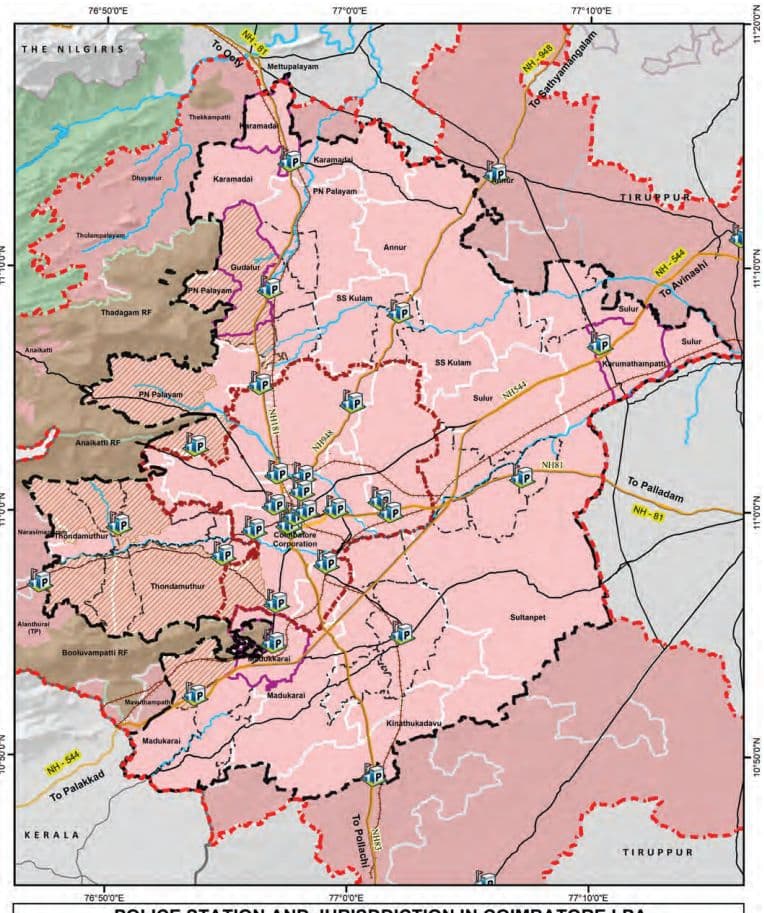
Map 11.19: Existing Police Stations and Jurisdiction in Coimbatore LPA
POLICE STATION AND JURISDDICTION IN COIMBATORE LPA
11.6.1Police Stations
Police stations form the primary interface between law enforcement agencies and the community. Their location must be based on population density, and urban growth patterns to ensure prompt response and effective coverage.
Planning Area (LPA) currently hosts a total of 33 police station serving the LPA. However location wise, only 27 police stations are present within the LPA region, with a significant concentration of 15 stations within the Corporation limits, followed by 6 in Town Panchayats and 3 in Municipalities. Among the rural blocks, PN Palayam (2) and Thondamuthur (1) are the only ones with police stations. This distribution indicates a relatively balanced allocation of police services between the urban core and peripheral areas.
11.6.2Fire Stations
Fire stations are critical for emergency response and disaster mitigation. Their siting should consider response time radius, risk-prone zones (industrial clusters, high-rise areas, markets), road accessibility, and water availability. The inclusion of fire safety infrastructure in high-density and periurban zones is necessary to address the rising complexity of urban emergencies.
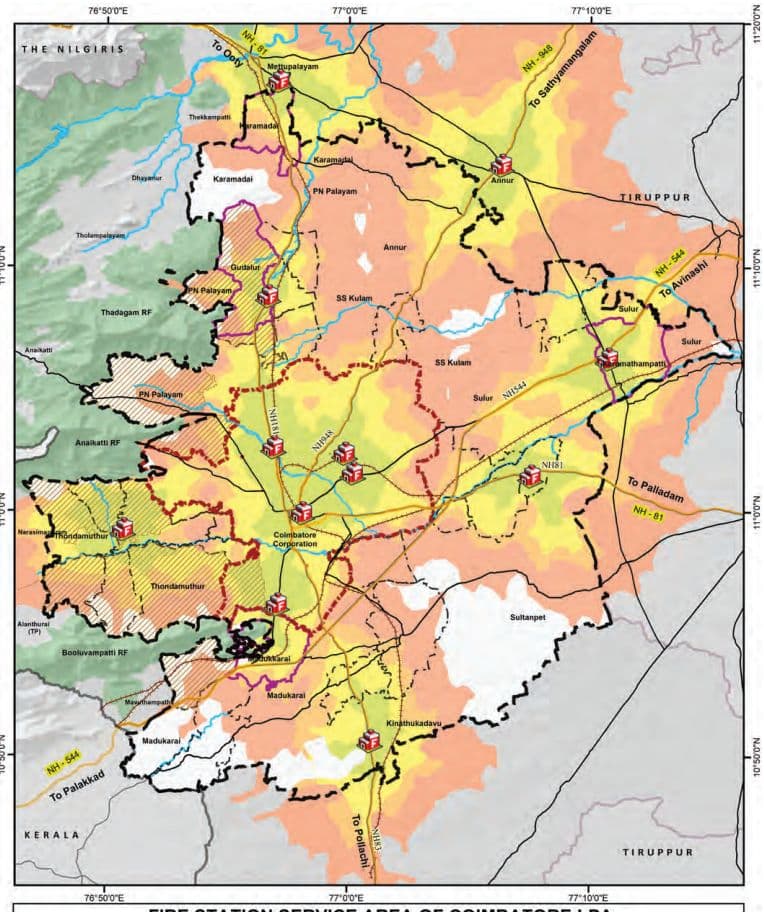
The Coimbatore LPA has a total of 11 fire stations, with 5 located in the Corporation area, 3 in Town Panchayats, 2 in Municipalities, and 1 in Kinathukadavu block. There is an additional fire station located very close to the LPA serving the LPA area.
11.6.2.1 Fire Station Service Coverage Analysis – Coimbatore LPA
As per the NDMA guidelines, a fire service response time of 5 minutes is recommended for urban areas, while 20 minutes is suggested for rural areas. An assessment of fire station service coverage across the Coimbatore Local Planning Area (LPA) reveals critical gaps in emergency response accessibility, particularly in rural revenue blocks. The analysis categorizes service levels based on response times:
Well-Served Revenue Blocks (5–8 Minute Response Time): Optimal fire service coverage is concentrated in Coimbatore Corporation and its immediate vicinity,
Map 11.20: Fire Stations and its Service Area in Coimbatore LPA
FIRE STATION SERVICE AREA OF COIMBATORE LPA
supported by strong infrastructure. Select areas of Madukkarai and P.N. Palayam revenue blocks also benefit from this coverage due to proximity to urban fire stations.
Areas with 10-15 Minute Response Time Several rural revenue blocks, including Sulur, Annur, Kinathukadavu, Thondamuthur, and Karamadai, experience suboptimal response times.
Areas with more than 15 Minute Response Time: Remote portions of Sulthanpet, Sulur, Annur, Karamadai, Thondamuthur, and Kinathukadavu revenue blocks— especially in western forest-fringe areas—remain outside reliable response zones. The absence of nearby fire stations and poor rural connectivity leaves these communities highly vulnerable during fire emergencies Although the assessment indicates certain underserved areas in terms of fire service coverage, the response times still fall within the acceptable limits prescribed by the NDMA guidelines.
11.6.2.2 Fire Accident Data for Coimbatore District
The escalating fire incidents in Coimbatore District, particularly in public spaces and industrial zones, underscore systemic vulnerabilities in fire-resilient infrastructure. The concentration of fires in such high-occupancy areas may highlight the inadequate compliance with regulations and insufficient fire-safe spatial planning. This signals the gap and necessity for accessible emergency corridors and decentralized fire stations. Urban policies must leverage geospatial data to retrofit high-risk clusters.
Type of Occupancy
Number of Casualties (Injuries / Fatalities)
67
Last five years Fire Accident Details
Table 11.31Fire Accidents in Coimbatore District
Year
Small
Medium
Serious
Total
Saved
Injured
Death
Residential
Commercial
Industrial
Public Place
2020
978
9
4
99 1
1 8
0
1 6
1 71
85
94
640
2021
797
1 4
2
81 3
4
0
1
1 39
81
1 1 3
480
2022
1 079
43
2
1 094
1
0
2
1 85
98
1 44
666
2023
1 658
25
3
1 687
1 2
7
7
21 9
1 35
1 3 1
1 207
2024
1 558
1 9
1 0
1 587
24
0
9
1 93
1 37
1 37
1 1 30
2025 (til l Date
868
5
2
875
1
0
2
66
53
67
690
03.04.2025)
11.6.3 Prison and Jail
Correctional facilities such as prisons and jails, while serving a custodial function, must also align with broader objectives of rehabilitation and reintegration. Their planning requires careful consideration of land availability, environmental impact, access to judicial institutions, and secure buffer zones.
In the Coimbatore LPA, one prison/jail facilities exist, and is located within the Coimbatore Corporation area.
11.6.4Projections and Gaps for the Safety and Emergency Services
Table 11.32URDPFI Guidelines for the Safety and Emergency Services
Category
Population Threshold per Unit as per URDPFI Guidelines
Police station
90,000
Fire station
2,00,000
District Jail
10,00,000
Source: URDPFI
As per the URDPFI Guidelines, the recommended norms include: one police station per 90,000 persons, one fire station per 2,00,000 persons or within a 5–7 km radius, and these are assessed as per Administrative Boundaries. Whereas one prison per 10 lakh persons, assessed at the taluk level due to the larger population threshold and broader custodial functions. These benchmarks serve as a planning standard for assessing infrastructure adequacy and determining future requirements in the Coimbatore LPA.
Table 11.33Demand and Gap Analysis of Safety and Emergency Services
Deficit and the Area Required as per URDPFI for the Amenities
Admin
Police Station
Fire Station
Total Area in sq.km
Population Threshold
90000
200000 or Radius of 5-7km
-
Corporation
-3 (-0.045)
-15 (-0.15)
-0.065
Total Municipalities
-1 (-0.015)
(Surplus)
-0.015
Town Panchayats
-1 (-0.015)
(Surplus)
-0.015
Annur Block
-1 (-0.015)
0
-0.015
Karamadai Block
0
0
0
Kinathukadavu Block
0
(Surplus)
(Surplus)
Madukarai Block
-1 (-0.015)
-1 (-0.01)
-0.025
PN Palayam Block
-2 (-0.03)
-2 (-0.02)
-0.05
SS Kulam Block
-1 (-0.015)
0
-0.015
Sultanpet Block
0
0
0
Sulur Block
-3 (-0.045)
-1 (-0.01)
-0.055
Thondamuthur Block
0
0
0
Total Deficit in LPA
-12 (-0.18)
-19 (-0.08)
-0.26
Deficit and the area required for Police Station: There is a deficit of 12 police stations, requiring 0.18 sq.km of land. The Corporation area has the largest shortfall with 3 stations, followed by Sulur (3) and PN Palayam (2). Minor deficits are also observed in Madukkarai, SS Kulam, and Annur. These gaps align with urban expansion, high-density settlements, and emerging peri-urban clusters. Areas such as Karamadai, Sultanpet, Thondamuthur, and Kinathukadavu show no deficit, indicating current adequacy.
Deficit and the area required for Fire Station: As per the population threshold in URDPFI guidelines, the LPA requires large number of additional fire stations. There is a deficit of 15 Fire Stations in the Corporation and 4 in the Rest of the LPA. However, Corporation is spatially covered with adequate number of fire stations. Hence the deficits are found in PN Palayam, Sulur, and Madukkarai blocks. Overlay of the Fire Station network analysis and the gap identified in it can be considered for proposal of any additional fire stations, rather considering the population threshold guided deficits for the fire station.
11.7 Socio-Cultural Facilities
The socio-cultural infrastructure in Coimbatore LPA comprises key public amenities that play a vital role in enhancing the quality of urban life. These include public libraries, post offices, community halls, marriage halls, crematorium and burial grounds. Collectively, these facilities foster social interaction, cultural expression, civic engagement, and community well-being.
Table 11.34Taluk-wise Existing Socio-Cultural Facilities in Coimbatore LPA
Taluks
Orphanages
Old Age homes
Regulated Markets
Uzhavar Sandhai
Post Offices
Annur
3
0
0
0
0
Coimbatore (North)
7
4
0
0
8
Coimbatore (South)
16
5
1
2
19
Kinathukadavu
0
0
0
0
0
Madukkarai
2
2
0
1
2
Mettupalayam
1
0
1
0
0
Perur
3
10
1
2
5
Sulur
1
0
1
1
0
Total Existing Facilities in LPA
33
21
4
6
34
Source: TNGIS, Open Source
The facilities such as orphanages, old age homes, regulated markets, Uzhavar Sandhais (farmers’ markets), and post offices are assessed across nine taluks in the LPA, since they serve a large region and population threshold. Whereas the other facilities such as Libraries, Anganwadi, bank Facilities and Community halls are assessed at administrative level.
Table 11.35Administration-wise Existing Socio-Cultural Facilities in Coimbatore LPA
Admin
Library
Anganwadi
Bank Facilities
Community Halls
Corporation
74
524
200
225
Total Municipalities
25
64
0
0
Town Panchayats
30
146
0
0
Annur Block
3
41
0
0
Karamadai Block
2
16
0
0
Kinathukadavu Block
0
16
0
0
Madukarai Block
3
29
0
0
PN Palayam Block
13
49
0
0
SS kulam Block
1
19
0
0
Sultanpet Block
2
18
0
0
Sulur Block
8
56
0
0
Thondamuthur Block
3
18
0
0
Total Existing Facilities in LPA
164
996
200(Data available for Corp Only)
225(Data available for Corp Only)
Source: Coimbatore Corporation, TNGIS, Open Source
11.7.1Library
The District Central Library, located in the heart of Coimbatore city, functions as the primary library for the entire district. Along with its network of branch libraries, parttime centres, and village libraries, it forms a robust public knowledge system within the Coimbatore LPA. The District Library serves as the central knowledge hub, while branch libraries ensure balanced access across urban and semi-urban areas. Part-time libraries support smaller communities with flexible services, and village libraries enhance grassroots literacy in rural regions.
The libraries continue to serve as a critical educational and intellectual resource, promoting literacy and lifelong learning, and contributing significantly to the social and cultural development of the region.
Table 11.36Existing Library Facilities in Coimbatore LPA
S. No
Library
Corporation
Rest of LPA
Total No.
1
District Library
1
-
1
2
Branch Library
28
28
61
3
Part-time Library
12
19
31
4
Village Library
33
43
71
Source: Local Library Authority, Coimbatore
The Coimbatore LPA hosts a diverse library network comprising 1 District Library, 61 Branch Libraries, 31 Parttime Libraries, and 71 Village Libraries.
When assessed based on administrative divisions, there are 164 libraries in the Coimbatore LPA, with the Corporation area accounting for the largest share—74 in total. Town panchayats and municipalities have 30 and 25 libraries respectively. Among the rural blocks, PN Palayam Block has 13 libraries and Sulur Block has 8. On the other hand, blocks such as Kinathukadavu and SS Kulam have limited or no library facilities, indicating disparities in access to public reading and learning resources.
11.7.2Community Halls
Community halls are multi-functional public spaces used for hosting social, cultural, and civic events. In the Coimbatore LPA, these halls are instrumental in promoting community bonding and supporting activities such as public meetings, health camps, awareness programs, weddings, and other social gatherings. The Coimbatore Corporation area has all 225 community halls, with no data available for the other administrative divisions in the LPA.
Map 11.21: Existing Library Facilities in Coimbatore LPA
EXISTING LIBRARY FACILITIES IN COIMBATORE LPA
11.7.3Anganwadi Facilities
Anganwadi Centres function as focal points for early childhood care, nutrition, and maternal health services under the Integrated Child Development Services (ICDS) scheme. They provide preschool education, supplementary nutrition, immunization, health check-ups, and referral services to children under six years of age and pregnant or lactating mothers. Ensuring that Anganwadi Centres are adequately staffed, equipped, and integrated with healthcare facilities enhances their outreach and efficiency.
The Coimbatore LPA has a total of 996 Anganwadi centres as per TNGIS website. The Corporation leads with 524 centres, followed by town panchayats (146) and municipalities (64). Among rural blocks, Sulur Block has 56 centres, PN Palayam Block has 49, and Annur Block has 41. This wide distribution highlights a strong framework for child welfare services, although some blocks still reflect lower service density.
In the Coimbatore LPA, the planning of new Anganwadi centres should be aligned with demographic projections and child population clusters. Strengthening them is crucial for achieving long-term human development goals.
11.7.4Orphanages and Old Age Homes
Orphanages and old age homes serve as institutional care facilities for two vulnerable groups—children without parental care and the elderly population. These homes provide shelter, nutrition, medical care, counseling, and emotional support. In the Coimbatore LPA, spatial planning should consider allocation of land for such facilities within residential zones, especially where ageing population density or child welfare needs are high. The existing data is obtained from open data sources and may show differences.
Orphanages: The Coimbatore LPA has a total of 33 orphanages. The highest concentration is in Coimbatore (South) with 16 facilities, followed by Coimbatore (North) with 7, Perur has 3 orphanages, while Annur and Madukkarai have 3 and 2 respectively. Mettupalayam and Sulur each have 1 facility, whereas Kinathukadavu lacks any orphanages.
Old Age homes: There are 21 old age homes in the Coimbatore LPA. Perur has the highest number with 10 homes, followed by Coimbatore (South) with 5 and Coimbatore
Map 11.22: Existing Anganwadi Facilities in Coimbatore LPA
EXISTING ANGANWADI FACILITIES IN COIMBATORE LPA
(North) and Madukkarai with 4 and 2 respectively. Notably, Annur, Kinathukadavu, Mettupalayam, and Sulur do not have any old age homes.
11.7.5Postal and Banking Facilities
Postal and banking facilities are fundamental to the socio-economic framework of any urban area. In Coimbatore LPA, these services facilitate communication, financial inclusion, and access to government welfare schemes. In the Coimbatore LPA, planning should focus on expanding postal banking services, especially in underserved and newly urbanized areas. Integrating these services within mixed-use zones, transport hubs, and rural service centres enhances accessibility. Encouraging digital financial infrastructure, such as ATMs and mobile banking units, supports financial inclusion.
The Coimbatore LPA hosts 34 post offices. Coimbatore (South) has the largest number at 19, followed by Coimbatore (North) with 8, Perur with 5, and Madukkarai with 2. Annur, Kinathukadavu, Mettupalayam, and Sulur show limited or no presence of post offices. However, available data of Banks for the Coimbatore LPA is restricted to the Corporation limits, where 200 bank facilities are reported.
11.7.6Regulated Markets, Uzhavar Sandhai and Public Distribution System (PDS) Facilities
Regulated markets, Uzhavar Sandhais (farmers’ markets), and the Public Distribution System (PDS) are integral to ensuring food security and equitable market access in Coimbatore LPA. They form a critical link between producers and consumers.
Regulated markets provide farmers with a transparent pricing mechanism and prevent exploitation by middlemen. In the Coimbatore LPA, only 4 regulated markets are present—one each in Coimbatore (South), Mettupalayam, Perur, and Sulur. The absence of such facilities in the other taluks, especially Annur, Kinathukadavu, and Madukkarai, reflects a gap in structured agricultural market acces
Uzhavar Sandhais promote direct farmer-to-consumer sales, ensuring fair prices for both parties and the availability of fresh produce. Six such markets are
present across the Coimbatore LPA. Coimbatore (South) and Perur have 2 each, while Madukkarai and Sulur have 1 each. Other taluks, including Coimbatore (North), Annur, Kinathukadavu, and Mettupalayam, do not have any Uzhavar Sandhai,
PDS outlets ensure subsidized food grains and essential commodities reach economically weaker sections. There are 875 PDS shops in the Coimbatore LPA.
In the Coimbatore LPA, spatial planning must ensure that regulated markets and Uzhavar Sandhais are located near farming belts and accessible via major transport corridors. These facilities are vital for food security, farmer welfare, and urban affordability.
Map 11.23: Existing Anganwadi Facilities in Coimbatore LPA
EXISTING REGULATED MARKETS, UZHAVAR SANDHAI, PDS FACILITIES IN COIMBATORE LPA
11.7.7Burial Grounds
Burial grounds are vital for culturally appropriate and dignified interment. In Coimbatore LPA, their planned availability and distribution ensure accessibility and prevent overcrowding, with a focus on maintenance and land protection.
Table 11.37Area Requirement for Burial Ground in 2041 for Coimbatore LPA
SNo
Taluk
Existing Burial Ground Area in 2021
Burial Ground Total area demand by 2041 (1 unit per 5 Lakh Population threshold)
Additional Area to be proposed (Total area required -Existing area)
1
Annur
0.31 Sq.km
-
(Surplus)
2
Coimbatore (North)
0.23 Sq.km
0.16 Sq.km
(Surplus)
3
Coimbatore (South)
0.36 Sq.km
0.12 Sq.km
(Surplus)
4
Kinathukadavu
0.02 Sq.km
-
(Surplus)
5
Madukkarai
0.21 Sq.km
0.08 Sq.km
(Surplus)
6
Mettupalayam
0.03 Sq.km
-
(Surplus)
7
Perur
0.10 Sq.km
0.04 Sq.km
(Surplus)
8
Sulur
0.44 Sq.km
0.04 Sq.km
(Surplus)
Total
1.71 Sq.km
0.44 Sq.km
(Surplus)
The above table presents an assessment of existing and projected burial ground requirements across 8 taluks within the Coimbatore LPA. The evaluation is based on a threshold of 1 unit per 5 lakh population, as per URDPFI guidelines, with 4 hectares per unit.
All taluks have been identified as having a surplus in burial ground provision based on the projected demand. It is therefore considered that the existing burial grounds in the taluks can adequately serve the needs of the planning period by 2041.
11.7.8Crematoriums
Crematoriums in Coimbatore LPA include traditional and modern eco-friendly facilities. Emphasis is on electric and gas-based systems to reduce pollution. Strategic
Map 11.24: Existing Crematorium Facilities
EXISTING CREMATORIUM FACILITIES
placement ensures accessibility and avoids overcrowding. Upgrading existing crematoriums with emission control aligns with sustainable urban goals and supports respectful disposal of the deceased.
There are thirteen crematoriums located within the Coimbatore Corporation limits, along with one crematorium each in the Karumathampatti and Karamadai Municipalities. As per the URDPFI Guidelines, it is recommended that at least one crematorium be provided for large cities.
11.7.9 Projections and Gap Analysis for Other Amenities
Table 11.38Taluk wise Gap Analysis and Area Requirement for Other Amenities as per URDPFI
Location
Orphanages
Old Age Homes
Regulated Markets
Uzhavar Sandhai
Post Offices
Total Area required for the Deficits
Population Threshold
5 Lakh
5 Lakh
10 Lakh
10 Lakh
5 Lakh
Annur
3 (Surplus)
(Sur0plus)
0 (Surplus)
0 (Surplus)
(Sur0plus)
(Surplus)
Coimbatore (North)
3 (Surplus)
(Sur2plus)
-2 (0.20sq.km)
-2 (0.20sq.km)
(Sur4plus)
0.74sq.km
Coimbatore (South)
13 (Surplus)
(Sur3plus)
-1 (0.10sq.km)
0 (Surplus)
16(Surplus)
0.10sq.km
11.8.1Strengths
Coimbatore LPA demonstrates robust human development outcomes, underscored by a high Human Development Index (HDI) and a declining Multidimensional Poverty Index (MPI).
A well-distributed school network spans the LPA, ensuring broad access to primary and secondary education.
The area benefits from a dense concentration of higher education institutions, reinforcing its position as a regional academic hub.
Healthcare infrastructure is notably advanced, with urban areas achieving near-complete coverage under the Golden Hour accessibility, while only 60% of rural areas fall within this critical healthcare window.
Urban centers further excel in tertiary and specialized healthcare services.
11.8.2 Weaknesses
Approximately 40 percent of Revenue Villages remain outside the Golden Hour healthcare coverage, highlighting gaps in rural and peri-urban medical access.
• Fire service infrastructure remains inadequate, particularly in rural and peri-urban locations, posing risks in emergency situations.
11.8.3Opportunities
There is considerable potential to establish Institutes of National importance and strengthen the region’s skill development infrastructure.
11.9 Proposals and Policy Recommendations
Public educational institutions can be upgraded to improve quality and enhance their competitiveness with private institutions.
Additional medical college can be established in a suitable area, to support equitable access and promote diversification in higher education.
Health Hubs can be developed in peri-urban and underserved rural areas to expand the reach of healthcare services.
Fire stations and emergency response infrastructure can be decentralized and expanded to improve resilience and responsiveness.
11.8.4 Threats
Ensuring that infrastructure development keeps pace with population growth presents an ongoing challenge to maintaining equitable access and high-quality service delivery.
Rising population pressure on existing facilities may result in overcrowding and a decline in service quality.
Constraints related to land availability, particularly in densely urbanized areas, may limit the future expansion of social infrastructure.
11.9.1Proposal (Govt.) of Relocation of Coimbatore Jail
The Coimbatore Central Prison, currently situated in the dense urban core of Gandhipuram, is proposed by the Government, to be relocated to a new site in Bilichi Village, within Coimbatore North Taluk. The identified land spans S.F. Nos. 1134/1, 2, 3; 1154/1B, 2B; 1161/3C; and 1135/1.
This relocation aims to decongest the central area, repurpose prime urban land for future civic or public uses, and develop a modern correctional facility in a more appropriate peripheral location. The Bilichi site offers suitable spatial conditions for security, accessibility, and facility expansion.
The move aligns with urban planning principles of land use optimisation and infrastructure decentralisation, while also creating potential for urban renewal in the heart of Coimbatore.
Map 11.25: Proposal of Social Infrastructure Facilities
PROPOSED SOCIAL INFRASTRUCTURE FACILITIES IN COIMBATORE LPA
11.9.2Proposal (Govt.) of Semmozhi Poonga
The Semmozhi Poonga, currently being developed at the ground of the Central Prison in Coimbatore, represents a transformative public initiative aimed at enhancing the city’s open space. This initiative, aims to repurpose the high-value urban land into a vibrant public green space, contributing to the enhancement of environmental quality and community well-being in the city.
The project is envisioned as a cultural and ecological landmark that promotes inclusive access to open spaces for recreation, learning, and cultural interaction.
Strategically located in Ward 80 of the Central Zone, the proposed park spans an area of approximately 45 acres. The site benefits from its proximity to key city nodes and transport infrastructure, increasing its accessibility to a broad section of residents. Also, the development of Semmozhi Poonga will enhance the per capita open space index for the Coimbatore LPA.
With the Semmozhi Poongha proposal, the per capita open space is expected to increase by 0.014 sq.m per person, resulting in a total of 1.812 sq.m per person when combined with the existing infrastructures.
11.9.3Proposal (Govt.) of International Cricket Stadium
Tamil Nadu has consistently demonstrated excellence in the field of cricket, with notable achievements at the domestic, franchise, and international levels. While Chennai has historically been the primary hub for cricket in the state, Coimbatore is emerging as a key secondary centre, owing to its growing cricket culture and ongoing investments in sports infrastructure. A proposal has been initiated for the development of an International Cricket Stadium in Coimbatore District. The objective is to establish a worldclass sporting facility that will serve as a premier destination for cricket and other sports activities, thereby enhancing the city’s profile as a regional sports hub.
Table 11.40Location Details of the Proposed Cricket Stadium
Village Name
Survey Field No.
Ward
Block
Town Survey No.
Taluk
Area (acres)
Corporation village -Singanallur
777, 778
AJ (36)
26
1, 2
Coimbatore South
20.18
Irugur
379/2
-
-
-
Sulur
10.18
Total Area
-
-
-
-
-
30.36
The stadium is proposed to include the following core facilities:
An international-standard main cricket stadium
• Practice pitches and high-performance training grounds
Gymnasiums, sports academies, and support facilities for athletes
Spectator galleries and associated amenities
In addition to sports infrastructure, the facility will also incorporate allied features to enhance visitor experience and utility:
Retail outlets, food courts, and club areas
Banquet halls, swimming pools, and jogging tracks.
• Comprehensive parking and public access facilities.
The proposed stadium is envisioned to host a range of events—from grassroots-level competitions to international tournaments—serving both professional athletes and the general public.
11.9.4Proposal (Govt.) of Hockey Stadium
To augment sports infrastructure and encourage the growth of athletics at both local and regional levels, a Hockey Stadium is proposed to be developed by the Coimbatore City Municipal Corporation. The project is planned at R.S. Puram, located in Ward H, Block 18, encompassing Town Survey Numbers 645, 646, 647, 648, 649, 650, 651, and 652. The total site area measures approximately 7 acres.
The stadium is designed to meet premier standards and will include a range of modern facilities. It will feature an ASTRO turf spread over 6,500 square metres, a dressing room covering 147 square metres, and six high-mast stadium lights. The facility will also comprise a 1,700-seater spectator gallery, a conference hall, a dining hall for players, a gymnasium, restrooms, office rooms, and dedicated parking facilities for 114 cars and 208 two-wheelers. The proposed stadium is anticipated to serve as a premier venue for hosting professional hockey tournaments and training programmes, while also supporting youth engagement in sports.
With the Hockey Stadium proposal, the per capita open space is expected to increase by 0.034 sq.m per person, resulting in a total of 1.832 sq.m per person when combined with the existing infrastructures.
11.9.5Proposals from Tamil Nadu Budget 2025
To strengthen the socially inclusive development and improve access to essential services, a number of social infrastructure initiatives have been proposed, as outlined in the Tamil Nadu Budget 2025. These initiatives aim to enhance educational and research facilities, improve student accommodation, and expand rehabilitation services. Collectively, these proposals are expected to play a significant role in advancing human development outcomes and strengthening the overall social infrastructure landscape in the region. The proposals from Tamil Nadu Budget 2025 are as detailed below:
11.9.5.1 Basic Sciences and Mathematics Research Centre
A Basic Sciences and Mathematics Research Centre is proposed to be developed in collaboration with the Indian Institute of Science (IISc) and the Tata Institute of Fundamental Research (TIFR). This centre will focus on promoting high-quality research in fundamental sciences.
11.9.5.2 Industrial Training Institute at Perur:
An Industrial Training Institute (ITI) is proposed to be established at Perur, with an annual intake capacity of approximately 1,370 students. The institute will provide technical education to equip students with industry-relevant skills and improve their employability.
11.9.5.3 Centres of Excellence in Manufacturing and Foundry Technology
Two Centres of Excellence are proposed in Coimbatore—one dedicated to advanced pump motor manufacturing and the other to foundry technology. These centres will serve as innovation hubs for industry-oriented research, skill development, and knowledge exchange in key manufacturing sectors.
11.9.5.4 Modern Hostel for Girl Students
The construction of a modern hostel facility with the capacity to accommodate 1,000 girl students is proposed to support female education and provide a safe and inclusive residential environment. The facility will be equipped with modern amenities to ensure the well-being and academic focus of its residents.
11.9.5.5 Integrated Rehabilitation Centre for Persons with Disabilities
An Integrated Rehabilitation Centre for persons with disabilities is proposed to provide comprehensive support services including medical care, social rehabilitation etc. The centre is envisioned to promote inclusion and improved quality of life for differently-abled individuals.
11.9.6Proposal for Establishing a Comprehensive Mental Healthcare Institution in Coimbatore LPA
In alignment with the Tamil Nadu Government’s vision of achieving a $1 Trillion economy, which outlines the establishment of three new mental health institutions outside Chennai, it is proposed to develop a state-of-the-art mental healthcare institution within the Coimbatore LPA. While Coimbatore currently hosts several mental health care centers, the majority are privately run and operate as clinics or wellness facilities rather than full-fledged institutions. There exists a critical gap in accessible, affordable, and integrated mental health services, particularly for vulnerable and underserved populations across the region.
The proposed institution shall function as a holistic centre of excellence, integrating mental health research, clinical services, and rehabilitation. It will cater not only to Coimbatore district but also serve as a regional hub for adjacent districts in western Tamil Nadu and the Kongu belt. The institution will focus on both preventive and curative aspects of mental health through multidisciplinary care. This initiative aligns with state’s broader goals of social wellbeing and inclusive development.
34,520
1 8
2
5
39,984
1 7
2
5
46,338
1 6
1
5
Su ltanpet Block
27,250
1 3
1
2
30,466
1 2
1
2
34,1 48
1 1
0
2
Su lur Block
1 ,36,1 64
3 1
3
1 1
1 ,94,073
1 9
-5
1 0
2,93,363
-1
-1 8
9
Thondamuthur Block
52,664
1 0
-1
3
60,640
9
-2
3
68,656
7
-3
3
Total Revenue Vi l lages
555,347
-
-1
-
744,476
-
-1 6
-
1 ,047,241
-4
-54
-
Total Gap assessed in Coimbatore LPA
3 1 ,62,392
-
-30
-
42,04,955
-78
-1 52
-
58,24,706
-3 1 6
-358
-
30,466
-1
0
34,148
-1
0
0.002
0
Sulur Block
1,36,164
-5
-1
1,94,073
-6
-2
2,93,363
-10
-2
0.02
0.006
Thondamuthur Block
52,664
-2
0
60,640
-2
-1
68,656
-2
-1
0.004
0.003
Total Revenue Villages
5,55,347
-16
-2
7,44,476
-20
-5
10,47,241
-31
-7
0.062
0.021
Gap in Total Coimbatore LPA
31,62,392
-31
-2
42,04,955
-52
-5
58,24,706
-91
-7
0.184
0.021
Kinathukadavu
0 (Surplus)
(Sur0plus)
0 (Surplus)
0 (Surplus)
(Sur0plus)
(Surplus)
Madukkarai
0 (Surplus)
(Sur1plus)
-1 (0.10sq.km)
0 (Surplus)
(Sur0plus)
0.18sq.km
Mettupalayam
1 (Surplus)
(Sur0plus)
0 (Surplus)
0 (Surplus)
(Sur0plus)
(Surplus)
Perur
2 (Surplus)
10(Surplus)
1 (Surplus)
2 (Surplus)
(Sur4plus)
(Surplus)
Total Deficit
(Surplus)
(Surplus)
-4 (0.40sq.km)
-2 (0.20sq.km)
(Surplus)
1.02sq.km
Table 11.39Administration wise Gap Analysis and Area Requirement for Other Amenities as per URDPFI
Admin
Library
Anganwadi
Bank Facilities
Community Halls
Total Area required
Population Threshold
15000
5000
1 Lakh
15000
for the Deficits (in Sqkm)
Corporation
-186 (-0.372sq.km)
-257 (0.072sq.km)
161 (Surplus)
-35 (0.07sq.km)
0.514sq.km
Total
-6 (-0.012
-6 (0.0018
-4 (0.01
-19 (0.038
0.0618
Municipalities
sq.km)
sq.km)
sq.km)
sq.km)
sq.km
Town Panchayats
-19 (0.038sq.km)
-15 (0.0045sq.km)
-1 (0.003sq.km)
-39 (0.076sq.km)
0.1215sq.km
Annur Block
-2 (0.002sq.km)
27 (Surplus)
-1 (0.003sq.km)
-5 (0.01 sq.km)
0.015sq.km
Karamadai Block
0 (Surplus)
9 (Surplus)
0 (Surplus)
-2 (0.004sq.km)
0.004sq.km
Kinathukadavu
-3 (0.006
8 (Surplus)
0 (Surplus)
-3 (0.006
0.012
Block
sq.km)
sq.km)
sq.km
Madukarai Block
-5 (0.01sq.km)
6 (Surplus)
-1 (0.0025sq.km)
-8 (0.016sq.km)
0.0285sq.km
PN Palayam Block
-10 (0.02sq.km)
-21 (0.0063sq.km)
-3 (0.0075sq.km)
-23 (0.046sq.km)
0.0798sq.km
SS Kulam Block
-2 (0.004sq.km)
10 (Surplus)
0 (Surplus)
-3 (0.006sq.km)
0.01 sq.km
Sultanpet Block
0 (Surplus)
3 (Surplus)
0 (Surplus)
-2 (0.004sq.km)
0.004sq.km
Sulur Block
-12 (0.024sq.km)
-3 (0.0009sq.km)
-3 (0.0075sq.km)
-20 (0.034sq.km)
0.0664sq.km
Thondamuthur
-2 (0.004
5 (Surplus)
-1 (0.0025
-2 (0.004
0.0105
Block
sq.km)
sq.km)
sq.km)
sq.km
Total Deficit in
-247 (0.494
-302 (0.0072
-14 (0.035
-164 (0.326
0.8622
LPA
sq.km)
sq.km)
sq.km)
sq.km)
sq.km
Inference of Gap and Area requirement assessment:
Orphanages and Old Age Homes: All planning zones report a surplus of orphanages and Old Age Homes. This indicates that the current infrastructure sufficiently caters to the population threshold of 5 lakh. However, it is to be noted that the existing data was obtained from open source and may have disparities. Post Offices: Post office infrastructure is in surplus across all planning zones.
Regulated Markets: A total deficit of 4 regulated markets is observed in the LPA. This corresponds to a land requirement of approximately 0.40 sq.km. Deficits are primarily found in Coimbatore North, Coimbatore South, and Madukkarai Taluks. This indicates a need to enhance formal market access.
Uzhavar Sandhai (Farmer Markets): There is a deficit of 2 units, requiring 0.20 sq.km of land. The shortfall is concentrated in Coimbatore North. This highlights the enhanced provision for decentralised farmer markets to support local agriculture and consumer access.
Libraries: A total deficit of 247 libraries has been identified across the LPA. The cumulative land requirement to bridge this gap is approximately 0.494 sq.km. The highest shortfall is observed within the Coimbatore Corporation area with a deficit of 186 libraries, followed by Town Panchayats (19 libraries) and Sulur Block (12 libraries). Spatially, the library infrastructure is relatively adequate in blocks such as Karamadai and Sultanpet, which exhibit no shortfall.
Anganwadi: The assessment indicates a total deficit of 302 Anganwadi centres across the LPA. The land required to address this shortfall is estimated at 0.0072 sq.km. The Corporation has the highest deficit with 257 centres, followed by Town Panchayats (15 centres) and PN Palayam Block (21 centres). Several blocks such as Annur, Karamadai, and SS Kulam exhibit surpluses.
Bank Facilities: The LPA reflects a cumulative shortfall of 14 bank branches. The total land area required for this amenity deficit is around 0.035 sq.km. Though the magnitude of the deficit is lower compared to other amenities, areas such as PN Palayam, Sulur, and Thondamuthur show gaps in banking access. The Corporation demonstrates a surplus, indicating that banking services are predominantly urban-focused.
Community Halls: A total of 164 community halls are deficient across the LPA. The estimated land requirement to meet this demand is 0.326 sq.km. The maximum gap is reported in Town Panchayats with 39 halls, followed by 35 in corporation (after deducting the existing community halls of 225 number), Sulur Block (20 halls) and PN Palayam Block (23 halls). The shortfall in community spaces is more pronounced in peri-urban and developing areas, which require enhanced public assembly infrastructure.
11.8 SWOT Analysis on Social Infrastructure
In conclusion, the total area required to meet the identified deficits in all socio-cultural amenities is approximately 1.88 sq.km. The Coimbatore Corporation contributes the largest share of the deficit both in terms of number of facilities and area required. Town Panchayats and blocks such as PN Palayam, Sulur, and Madukkarai also emerge as priority rural zones for intervention. Conversely, blocks such as Karamadai, Sultanpet, and SS Kulam exhibit minimal or no shortfalls, providing potential to balance spatial distribution of amenities through strategic planning.
The Detailed Project Report (DPR) for the proposed International Cricket Stadium in Coimbatore has been prepared. The project is being benchmarked against prominent national and international cricket stadiums to incorporate best practices in architectural design, operational efficiency, and user experience. Concurrently, the tendering process is in progress, with all requisite procedures being duly undertaken. This project is expected to serve as a significant milestone in the development of sports infrastructure in Coimbatore LPA and will contribute meaningfully to the promotion of cricket and other sporting activities in the region.
With the International Cricket Stadium proposal, the per capita open space is expected to increase by 0.06 sq.m per person, resulting in a total of 1.858 sq.m per person when combined with the existing infrastructures.
11.9.5.6 Medical Devices Testing Laboratory
The proposed Medical Devices Testing Laboratory in Coimbatore will be established on 1.28 acres of government land at Jeeva Nagar, Kavundampalayam. It will be a NABL-accredited facility equipped to test Category A and B medical devices, including in-vitro diagnostic equipment, as per the Medical Devices Rules under the Drugs and Cosmetics Act. The facility will house advanced equipment for chemical, biological, and performance testing. The initiative is part of the Strengthening of State Drug Regulatory System scheme and aims to improve regulatory compliance and quality assurance within the state’s healthcare system.
11.9.7Proposal of Fire Stations
Two additional fire stations are proposed to strengthen the emergency response network and to ensure compliance with the response time thresholds recommended by the URDPFI and National Disaster Management Authority
(NDMA) guidelines, which mandate a response time of 5 to 7 minutes. The following proposed stations are strategically located to cover critical network gaps in fire and emergency services as identified in the Fire service coverage area analysis:
Table 11.41Location details of Proposed Fire Stations
Proposed Fire Station (2 numbers) To meet the demand Service Gap
S No
Taluk
Proposed Village
Survey number
Area required
1
Sulur
Idayarpalayam
199(pt)
1 Hectare
2
Annur
Sarkarsamakulam
74(pt)
1 Hectare
Total
2 Hectares
Though the analysis based on population norms, as per the URDPFI Guidelines, identified numerous gaps in the provision of fire stations across the Local Planning Area (LPA), a more location-specific assessment using the 5 to 7 minutes response time coverage criteria (as seen in the Map 11.19) revealed comparatively fewer service gaps. Accordingly, two additional fire stations are proposed to effectively bridge these critical gaps. The proposed locations are Idayarpalayam Village in Sulur Taluk and Sarkarsamakulam Village in Annur Taluk, each allocated 1 hectare as per URDPFI norms. These fire stations are strategically positioned to strengthen the emergency response network, improve operational efficiency, ensure rapid response during emergencies, and mitigate risks in high-density residential, commercial, and industrial zones.
11.9.8Proposal of Taluk Hospital
Two additional taluk-level hospitals are proposed within the Coimbatore Local Planning Area (LPA), one each for Coimbatore North Taluk and Coimbatore South Taluk. At present, both taluks are served by non-taluk hospitals and other tertiary hospitals, and there exists a clear requirement for dedicated taluk-level healthcare facilities to meet the demand by 2041. These proposals stem from service gap evaluations as per URDPFI norms, which underscore the need for improved tertiary-level health care accessibility at the sub-district level. The following locations are selected for the proposed Taluk Hospitals:
Table 11.42Location details of Proposed Taluk Hospital
Proposed Taluk Hospital - To meet the demand by 2041
S No
Taluk
Proposed Village /TP
Survey number
(Minimum 1 Hectare is required for a Taluk Hospital)
1
Coimbatore North Taluk
Veerapandi TP
526
2
Coimbatore South Taluk
Corporation (Sundakamuthur Village)
181
To bridge the healthcare infrastructure gap at the taluk level, an additional Taluk Hospital is proposed in both Coimbatore North and Coimbatore South Taluks by 2041. Both selected sites are government owned. These hospitals will serve as crucial health nodes, reducing the patient load on higher-order facilities and providing timely medical services to a broader population base, particularly in semi-urban and peripheral areas of the LPA.
11.9.9Proposal of Veterinary Hospital
In response to the service deficiencies identified in the veterinary health sector as per URDPFI norms to meet the demand by 2041, five additional veterinary hospitals are proposed across the Coimbatore LPA—distributed strategically to cater to underserved taluks as follows:
Table 11.43Location details of Proposed Veterinary Hospital
Proposed Veterinary Hospitals - To meet the demand by 2041
S No
Taluk
Proposed Village /TP/Municipality
Survey number
(Minimum 2000 sq.m is required for a Veterinary Hospital)
1
Coimbatore North Taluk
Veerapandi TP
532(pt)
2
Madukkarai Taluk
Madukkarai Municipality
60
3
Coimbatore South Taluk
Corporation (Sundakamuthur Village)
181
By the year 2041, as per norms and gap analysis, an estimated five additional veterinary hospitals will be required within the Coimbatore LPA to adequately meet growing demand—one each in Coimbatore North and Madukkarai Taluks, and three in Coimbatore South Taluk.
However, considering spatially, only three new veterinary hospitals are proposed. One is planned in Coimbatore North Taluk at Veerapandi Town Panchayat, and
another in Madukkarai Taluk, within Madukkarai Municipality. A third facility is recommended as a high capacity veterinary hospital to be developed in Coimbatore South Taluk, within the Corporation limits at Sundakaputhur Village
These facilities will address the region’s demand for animal healthcare and welfare services, especially in areas where livestock rearing and dairy farming form an integral part of the local economy. The expansion of veterinary infrastructure will support the livelihood of rural and periurban communities, promote animal health, and contribute to sustainable agri-based development.
11.9.10Proposal of Mini Libraries at Railway Junction and Community Parks in Coimbatore
The Coimbatore Local Planning Area (LPA) is projected to have a requirement of 247 public libraries by the year 2041 to cater to the growing need for accessible educational and reading facilities, with the Corporation libraries requirement accounting for 186. To meet the rquriemnets and address this requirement as well as to ensure equitable access to knowledge resources, it is proposed to establish Mini Libraries at strategic, high-footfall public locations such as railway station, and community parks. This initiative aims to cultivate a reading culture and support inclusive learning opportunities across the city.
Mini Libraries at Railway junction: Integrating mini libraries at these locations offers a practical and cost-effective means to promote reading and educational engagement. The following places as listed in the table below, are identified for the proposed initiative for the integration of mini-library. These terminals offer strategic locations for mini libraries due to their accessibility, high daily user volume, and potential for community outreach.
Mini Libraries at Community Parks: In addition to transit hubs, it is proposed to establish mini libraries within community parks across the city. Coimbatore Corporation currently has approximately 190 community parks serving as important recreational and social spaces. The presence of mini libraries in these parks will foster reading as a leisure activity and benefit a wide demographic, including children, senior citizens, and local residents.
To ensure effective upkeep and responsible usage, these libraries shall be maintained by the respective neighborhood associations or resident welfare societies. This community-led approach will encourage local ownership and promote sustainable operations.
Table 11.44Proposed locations for Mini Libraries
Railway Junction (1)
Community parks
Coimbatore Railway Junction
There are 190 community parks in the corporation. These can be utilised for integration of Mini-Libraries
Access and Operational Recommendations:
To ensure responsible use and long-term sustainability of mini libraries at both terminals and community parks, the following measures are recommended:
Facilitate access for students through student passes to promote youth engagement.
Introduce minimal or nominal user fees for the general public to ensure accountability and support operational costs.
Adopt a membership-based model to monitor usage and enable service enhancements.
This initiative promotes inclusive, knowledgeoriented urban development and optimizing the use of public infrastructure for educational and community benefit.
11.9.11Recommendations for Institute of National Importance
Coimbatore boasts a robust presence of engineering, medical, arts, science, and management institutions that significantly contribute to the region’s educational landscape. However, the city presently lacks institutions of national importance—Category A institutions established through Acts of Parliament and recognized for their academic excellence, research output, and national-level capacity building.
Given Coimbatore’s strong industrial base, academic ecosystem, and strategic geographic location, it is wellpositioned to host institutions of national importance. The following are recommended:
As a well-established textile and manufacturing hub, Coimbatore presents a compelling case for the establishment of national-level institutions focused on textiles, fashion, and design. Institutions such as the National Institute of Design (NID) and the National Institute of Fashion Technology (NIFT), if located in Coimbatore, would create strong synergy with the city’s existing textile industries, supporting future skill development, advanced research, and innovation in textile technology and design.
In addition, an Indian Institute of Science Education and Research (IISER) could also be established in Coimbatore. IISERs, with their focus on high-quality research and science education, would align well with the city’s growing industrial sectors such as manufacturing, engineering, and emerging technologies. The presence of an IISER would further strengthen and encourage industry-academia collaboration, and contribute to the development of a knowledge-based economy in the region.
It is also noted that premier institutions like NID and IISER currently do not have a presence in Tamil Nadu. Establishing such institutions in Coimbatore would bridge this gap while reinforcing Tamil Nadu’s position in education, research, and industrial innovation.
11.9.12Recommendations for Skill Development in alignment with Sunrise Sectors
To align with Coimbatore’s evolving economic base, the economic sector details the identified sunrise sectors that are expected to drive future growth—namely: Electric Vehicles (EV) and Renewable Energy, Aerospace and Defence Applications, Electronic System Design and Manufacturing, Medical Electronic Devices and Equipment, and Agro and Food Processing.
It is recommended that existing colleges and universities in Coimbatore introduce or expand targeted skill development programs and academic courses that are aligned with these sectors. These programs can be introduced or strengthened in collaboration with industry stakeholders to ensure relevance to market needs.
In the long term, the proposed national-level institution, if established, can also be designed to complement and further elevate these sectoral training domains by acting as a hub for advanced research, innovation, and professional education.
Table 11.45Recommended courses for Sunrise Sectors Skill Development
Sunrise Sector
Level
Recommended Courses
1. Electric Vehicles (EV) & Renewable Energy
Bachelor's Level
- B.Tech in Sustainable Energy Engineering
- B.Sc in Renewable Energy Policy & Management
Master's Level
- M.Tech in Advanced Battery Technologies & Energy Storage
- M.Sc in Smart Grid & Microgrid Systems
- MBA in Renewable Energy Business
2. Aerospace & Defence Applications
Bachelor's Level
- B.E in Aerospace Materials & Composites
- B.Tech in Drone & UAV Technology
Master's Level
- M.Tech in Hypersonic Systems & Spacecraft Engineering
- M.Sc in Defence Cybersecurity & AI
- MBA in Aerospace Supply Chain Management
3. Electronic System Design & Manufacturing (ESDM)
Bachelor's Level
- B.E in Robotics & Automation Engineering
- B.Tech in Semiconductor Fabrication Technology
Master's Level
- M.Tech in Advanced VLSI & Chip Design
- M.Sc in AI-Enabled Embedded Systems
- MBA in Electronics Product Management
4. Medical Electronic Devices & Equipment
Bachelor's Level
- B.Tech in Biomedical Imaging & Diagnostics
- B.Sc in Healthcare IoT & Wearable Devices
Master's Level
- M.Tech in Medical Robotics & Surgical Systems
- M.Sc in Biomedical Data Analytics
- MBA in Medical Device Regulatory Affairs
5. Agro & Food Processing
Bachelor's Level
- B.Tech in Precision Agriculture & Agri-Tech
- B.Sc in Food Safety & Quality Assurance
Master's Level
- M.Tech in Advanced Food Biotechnology
- MBA in Agri-Business & Supply Chain Optimization
- M.Sc in Sustainable Packaging & Cold Chain Management
11.10 Future Ready Social Infrastructure:
The proposed action plans for the Coimbatore LPA are strategically aligned to leverage existing strengths, address critical weaknesses, capitalize on emerging opportunities, and proactively mitigate potential threats. Building upon the district’s commendable momentum on human development indicators and its established urban networks in healthcare and education, the recommendations aim to enhance equitable access and service delivery across both urban and rural areas.
To address existing disparities—particularly in rural and peri-urban areas—the action plan proposes the decentralization of key infrastructure through the establishment of new taluk-level hospitals, veterinary healthcare facilities, and fire stations, thereby narrowing the urban–rural divide in healthcare, safety, and education services. Simultaneously, it seeks to harness opportunities for academic and skill-based advancement by introducing Institutes of National Importance, additional medical colleges, and upgraded skill development infrastructure aligned with emerging sunrise sectors.
Potential threats, such as limited recreational open spaces and constraints on land availability, are addressed through proposals such as relocation of Jail, the Semmozhi Poonga and the International Cricket Stadium—which serve dual roles in optimizing land use and improving overall liveability.
These proposals collectively lay the groundwork for a resilient and socially inclusive future, ensuring equitable access to healthcare, education, safety, and socio-cultural facilities across LPA. In doing so, they also align with Tamil Nadu’s $1 trillion economy vision by promoting inclusive growth and improving quality of life for all segments of the population.
11.10.1Phasing of Social Infrastructure Proposals for Coimbatore LPA
The social infrastructure proposals under the Coimbatore Local Planning Area (LPA) Master Plan have been strategically phased into short-term (immediate), medium-term (2031), and long-term (2041) actions to ensure systematic, equitable, and sustainable service delivery. These proposals encompass a mix of new developments and
upgradation of existing facilities across education, health, safety, recreation, and socio-cultural sectors. The phasing aligns with the gaps identified and the analysis conducted for projected population demand in the respective timeframes.
In the education sector:
The short-term plan focuses on the upgradation of 24 primary schools in the Corporation area, 5 in Town Panchayats, and 1 rural primary school to the secondary level.
The key short-term education sector proposals from Tamil nadu Budget 2025 -include the establishment of an Industrial Training Institute (ITI) at Perur, a Basic Sciences and Mathematics Research Centre in collaboration with the Indian Institute of Science (IISc) and Tata Institute of Fundamental Research (TIFR), and two Centres of Excellence—one for advanced pump motor manufacturing and another for foundry technologies. In addition, a modern hostel facility for girl students has also been proposed.
The medium and long-term vision includes the proposal of new establishment of 122 and 206 secondary schools, and 78 and 238 primary schools respectively across LPA.
Additionally, the long-term vision includes new proposals for a Institutes of National Importance to cater to higher education and specialized academic needs.
In the health sector:
The short-term proposals include the upgradation of 7 Urban Primary Health Centres (UPHC) within the Corporation limits, and proposals for 24 new UPHCs/ Primary Health Centres (PHCs) in town panchayats and rural areas, along with 2 new CHCs/UGPHCs in LPA.
The key short-term health sector proposals from Tamil nadu Budget 2025 -include Integrated Rehabilitation Centre for Persons with Disabilities and a Medical Devices Testing Laboratory.
• The medium- and long-term plans include progressive expansion to an additional 21 and 39 UPHCs/ PHCs respectively, with proposals for 5 and 7 new CHCs/UGPHCs.
A new comprehensive Mental Health Care Institution is proposed in the medium term, while new taluk hospitals and veterinary hospitals are planned for the long term to meet increasing health care needs.
Under safety and security:
The key proposals include the relocation of the existing jail facility and the establishment of new fire stations to ensure equitable spatial distribution of emergency services across the LPA.
In recreational and open space facilities:
The short-term proposals include the development of Semmozhi Poonga, an International Cricket Stadium and International Hockey Stadium, enhancing urban liveability. With the implementation of all three proposals, the per capita open space is expected to increase by 0.107 sq.m per person, resulting in a total of 1.905 sq.m per person when combined with the existing infrastructures.
For socio-cultural development:
Mini-library proposals are phased progressively to meet the demand of the projected populations—libraries at the Railway Junction and 63 community parks in the short term, to 3 new terminals and 47 community parks in the medium term, and ultimately to 80 community parks in the long term, strengthening cultural engagement and public access to knowledge resources.
This phased implementation approach not only addresses current deficiencies but is also designed to accommodate the anticipated growth in population and service demand. By aligning each phase with identified infrastructure gaps and projected demographic trends, the proposals/recommendations ensure that Coimbatore LPA evolves into a resilient, socially inclusive, and future-ready progressive space.
12.1 Introduction
Housing is a basic necessity, along with food and clothing. Access to adequate housing is considered a basic right and is a key requirement to achieve a comprehensive improvement in the quality of life of citizens. Housing is also a key component to fuel the economic growth and its spatially balanced pattern of development. Safe, secure, and affordable housing enriches communities with increased opportunities for access to employment and educational opportunities, leading to an improved quality of life and a better civil society. Housing also plays a vital role in fostering social inclusion, promoting economic opportunities, and shaping the physical and cultural landscape of a city. Adequate housing encompasses more than just four walls and a roof, it includes access to essential services such as clean water, sanitation, and reliable infrastructure that makes the houses liveable.
This Chapter examines the existing housing situation within the planning area, providing a comprehensive overview of current housing conditions. It analyses key characteristics such as housing typologies, tenure patterns (owner-occupied vs. rental), age and condition of housing stock, affordability, and spatial pattern of distribution across the region. Identification of the extent of prevalent housing challenges, including issues related to overcrowding, inadequate infrastructure, and accessibility, is also in focus. Furthermore, it also explores the current dynamics of the housing market, considering factors like population growth, migration patterns, and economic influences on housing demand and supply. This assessment serves as a foundation for developing housing strategies and policies to ensure access to safe, affordable, and suitable housing for all residents within the planning area.
Housing demand in Tamil Nadu, particularly in Coimbatore, is being driven by both population growth and increasing migration to urban centres in search of better employment opportunities. Rapid industrial expansion, access to increasing quality educational institutions, and improved urban infrastructure complement each other in propelling employment opportunities and increasing in-migration into the Coimbatore region. There is a significant clarity that to sustain the momentum of growth, adequate and affordable housing is a prerequisite and it deserves special consideration in addressing the essentials in a city for improving its liveability.
12.2.1Distribution and Density of Households
12.2.1.1 Distribution and Density of Households 2011
Coimbatore has a densely populated core, with the hitherto sparsely populated radial corridors increasingly gaining population concentration. With the expansion of the boundary of the Municipal Corporation, the number of households increased from 4,26,482 to 6,75,835, as mentioned in the Table 12.3 registering an increase of 58.5% in the number of households.
Table 12.3Density of Households 2011
Coimbatore LPA
Population 2011
Households 2011
Household Density 2011
Corporation
15,84,719
4,26,482
1,654
Municipality
1,39,444
38,913
399
Town panchayat
3,03,834
85,686
272
Revenue village
4,29,455
1,21,952
142
Total
24,57,452
6,73,033
439
Sources: Census of India, 2011
As of 2011, the overall household density in the CCMC area has been 1654 per sq.km, while in the older areas of CCMC, it has been 2678 per sq.km. Within the Municipal Corporation, areas such as Goundanpalayam (TP), Kuniamuthur, and Kurichi had higher densities of 2591, 2154 and 1616 persons/sq.km. resulting due to location of employment avenues and educational institutions. Location of SIDCO industrial estate in Kurichi, and numerous MSMEs in Goundampalayam and Kuniyamuthur as well as the educational institutions in Thudiyalur have led to a higher level of residential growth is presented in the Map 12.1. It is also evident that density along the major transit corridors is relatively higher than in other areas as mentioned in the Map 12.2.
Map 12.1: Distribution of Households 2011
DISTRIBUTION OF HOUSEHOLDS 2011
Map 12.2: Density of households 2011
DENSITY OF HOUSEHOLDS 2011
12.2.1.2 Distribution and Density of Households 2024
The increase in number of households and its spatial distribution exhibit an increased residential development along the major roads and closer to the corporation boundary as presented in Map 12.3. Facilitated by the concentration of employment opportunities and aligned with the growth corridors to major cities of the Coimbatore region, the north and eastern parts of the LPA with substantially growing as compared to the southern side, which is constrained by natural barriers to some extent.
Table 12.4Density of Households 2024
Coimbatore LPA
Population2024
Households2024
Household Density 2024
Corporation
22,97,839
6,75,835
2,621
Municipality
1,81,065
53,254
546
Town panchayat
4,54,271
1,33,609
424
Revenue village
7,82,782
1,33,609
267
Total
37,15,957
10,92,929
714
Sources: Urban Local Bodies
The household density in the municipal corporation as of 2024 is 2621 per sq.km., as against 1654 in 2011. The growth of households during this period in municipalities is 36.8% (increased from 399 to 546 households per sq.km), town panchayats 55.8% (272 to 424 households per sq.km) and in respect of Revenue villages 88% (142 to 267 households per sq.km) during 2011 to 2024 is mentioned in Table 12.14.
In regard to the spatial pattern of household concentration as of 2024, the core areas (wards) of the municipal corporation depict a higher level of household concentration is exhibit in the Map12.5. The ward-wise density distribution in the Municipal Corporation is depicted in Map 12.6. Among all the wards within the Coimbatore Municipal Corporation, Ward 32 (proximity to Central Business District (CBD), ward 41(P.N Pudhur having Tamil Nadu Agriculture University and few MSME industries), ward 44 (KK Pudhur), ward 45 and 47 (located in proximity to CBD) have higher household densities as presented in Map 12.4.
Map 12.3: Distribution of Households 2024
DISTRIBUTION OF HOUSEHOLDS 2024
12.2.2Housing Conditions
The condition of census houses (as of 2011) across the LPA, in terms of being in good, liveable and dilapidated condition is presented in the figure 12.1.
Sources: Census of India, 2011
Figure 12.1: Percentage share of Housing condition in Census Houses
Of the total households in the corporation area (4,26,482 units), 80.5% (3,42,892), 19% (81,031), and 0.60% (2559) are categorised as being good, liveable, and in dilapidated conditions, respectively. The total household in municipalities is 38,913, out of which 75.90% (29,534), 23.30% (9,066), and 0.75% (292) are in good, liveable, and dilapidated condition respectively. In the Town Panchayats, of the 85,686 houses, 71.5% (61,265), 27.70% (23,735), and 0.80% (685) are in good, liveable, and dilapidated condition, respectively. The total households in all the Revenue villages together is 1,21,959, out of which 71.5% (87,201), 27.40% (33,416), and 1.10% (1,341) are in good, liveable, and dilapidated condition respectively as presented in Map 12.7.
Overall, the LPA boasts of 74.8% (5,03,428 houses) being of ‘good’ condition, ‘liveable’ houses being 24.4% (1,64,220 units), and ‘dilapidated’ houses forming a marginal 0.8% (5,384 housing units). While the Corporation area shows a higher proportion of ‘good’ condition houses (80.45%), the lowest percentage (71.5%) is found in Revenue villages. Similarly, Revenue villages exhibit a relatively higher share of ‘dilapidated’ housing units compared to other areas.
Map 12.7: Distribution of Condition of Census Houses
12.2.3Tenurial Status
As per the Census definition, a household is living in an ‘owned’ house if they self-occupy the house they own and do not pay rent to anyone. If a household pays rent in cash or kind for the accommodation they occupy, including cases where the employer provides the accommodation (e.g., government quarters), they are classified as living in a ‘rented’ house. The ‘others’ category encompasses households that reside in encroachments or unauthorized structures.
The tenurial status of houses (as of 2011) across the LPA is demonstrated in terms of ‘owned’, ‘rented’ and ‘others’ categories. About 59.4% of the dwelling units in the LPA are ‘owned’, while 36.6% is rented and about 4% form the ‘others’ category.
Sources: Census of India, 2011
Figure 12.2: Percentage share of Tenure Status in Census Houses
The total number of households in the corporation is 4,26,482, of which 54.7%, 43.6%, and 1.7% constitute owned, rental and other categories respectively. The municipalities with a total of 38,913 households have 59.15%, 39% and 2.30% living in owned, rental and other categories respectively. The Town Panchayats have a total of 85,686 households, of which 68.60%, 28.8%, 2.5% are of owned, rental and other categories, respectively. The total households in Revenue villages is 1,21,959, of which 77.8%, 19.50%, and 2.7% are categorised to be living in ‘owned’, ‘rental’ and ‘other’ categories, respectively as preseted in Map 12.8.
Overall, the tenurial status of ‘owned houses’ in the LPA is higher in the constituting Revenue villages (77.8%) and town panchayats (69.3%) as compared to the core urban areas presented in the Figure 12.2. The rental houses
Map 12.8: Distribution of Tenure in Census Houses
OWNERSHIP STATUS OF CENSUS HOUSE 2011
are largely present in the core areas which can be related to the employment opportunities and higher cost of properties. The proportion of rental houses is comparatively higher along the major transit corridors as well, as households opt for rental accommodation in view of the ease of mobility and accessibility.
12.2.4Status of Rooms in Residential Properties
The status of availability of number of rooms in the residential houses in various constituent areas across LPA has been presented in Table 12.5, in terms of dwelling units ‘with-out exclusive room’ and those houses with one to six and above number of rooms. The corporation area has a higher percentage of multi-room dwellings, while Revenue villages have more single-room and non-exclusive room units.
Table 12.5Dwelling Units Details in the LPA (2011)
Size of Dwelling Units
District(%)
Overall LPA
Corporation(%)
Municipality(%)
Town Panchayat(%)
Revenue Villages (%)
No exclusive rooms
1.9
1.45
1.8
2.11
2.17
One
34.3
25.4
31.1
35.25
40.56
Two
31.5
30
32
32.5
33.6
Three
18.2
22.3
20.1
18.13
15.0
Four
8.5
12.8
9
7.69
5.87
Five
3.3
5.45
3.72
2.685
1.689
Six & above
2.2
3.6
2.2
1.55
1.07
Sources: Census of India, 2011
The analysis indicates that one-room units are the most common in Revenue villages (40.56%), while six and six and above catagory of room units have the lowest share in Revenue villages (1.07%). Similarly, three-room units are most prevalent in Corporation (22.3%), whereas five-room units have the least share in Revenue villages (1.689%).
From this, it can be considered that areas with a higher percentage of one-room and no-exclusive-room units may require support. The lower share of larger dwellings in certain areas also suggest issues of affordability, infrastructure availability, and household size demands.
12.2.5Student Communities
Coimbatore district is a major education hub and is dotted with the number of engineering, medical science and arts colleges as well as polytechnic colleges. The assessment indicates the total number of students is 1,16,761 in that boys are 63,806 and girls are 52,951. The major education facilities, colleges. The assessment in Coimbatore LPA highlights the areas that would be provided with hostel for student communities. The education facilities are largely located at Somayampalayam, Ettimadai, Madukkarai and Pichanur. Surrounding these areas, the residential landuse has been identified for the provision of housing to support the student communities.
Map 12.9: Location of Women’s Hostel
12.2.6 Women’s Hostel
In the context of migrants forming a major part of the district’s population, and also in view of the employment opportunities available in the city, the availability of women’s hostels is a prerequisite to address the accommodation requirement for the working as well as student community. The location of women’s hostels has been mapped across the LPA (Map 12.9), and it is noted that most Women’s Hostels are located within the Corporation boundary, more particularly inside the old corporation boundary area.
12.2.7Night Shelters in Municipal Corporation
In an effort to provide secure accommodation for the urban homeless, the Coimbatore city municipal corporation has set up five shelters in different zones of the corporation. The five existing shelters are located at Poosaripalayam, R.S. Puram (two shelters), K.N.G Pudur, and Kempatty Colony. As of now, these shelters together have a combined capacity of 276 beds, which is already proposed to be increased to 300.
As part of the National Urban Livelihood Scheme, four urban homeless shelters (UHS) are under construction at Kadalakkara Lane (Central Zone) near the district collectorate, Mullai Nagar (North Zone), NTP Nagar (South Zone), and Nesavalar Colony (East Zone). This will bring the total number of shelters for urban homeless to nine. As per norms of the Scheme of Shelter for Urban Homeless (SUH) under the National Urban Livelihoods Mission (NULM), these shelters should be permanent all-weather shelters for the urban homeless, and for every one lakh urban population, provisions should be made for permanent community shelters for a minimum of one hundred persons, and depending upon local conditions each shelter could cater to 50 or 100 persons.
As per the assessment by the local bodies in the LPA, the population of Coimbatore LPA in 2024 is 37,15,957 and considering the above guideline, Coimbatore LPA currently requires an additional 28 shelters comprising 100 beds each. Based on the projected population for LPA in 2031 and 2041, assuming 100 beds in a shelter, a total of 42 shelters and 58 shelters respectively would be the requirement in these years.
12.2.8Scenario of Informal Settlements
Towards promotion of slum free cities, the Rajiv Awas Yojna (RAY) had advocated a twofold strategy - (i) Curative Strategy, a plan to bring about the improvement of the existing slums through the participation of the existing slum dwellers and (ii) Preventive Strategy to prevent the formation of future slum. As part of this effort, a Slum Free City Plan of Action (SFCPoA 2013-2022) enlisted the role of various institutions, of which a primary role is attributed to the Tamil Nadu Urban Habitat Development Board (TNUHDB).
Based on a comprehensive exercise, the Coimbatore corporation has been divided into five zones with 20 wards in each zone. Based on the morphological pattern of slums in the corporation area, the slums have been identified under five categories, (i) slums near residential areas, (ii) in the vicinity of industries, (iii) along kulams (large water tanks), (iv) linear slums along roads, railway tracks, and nullahs (drains), (v) slums in agricultural areas.
A total of 214 pockets of slums have been identified in the corporation under the RAY scheme. All the identified existing slum settlements were categorised as tenable and non-tenable with verifiable parameters such as land ownership, land use, spatial location, health risk, etc. Informal settlements suitable for human habitation, which were not located in/along a hazardous zone and where the land was not earmarked for major public facilities were categorised as tenable slums. Prioritisation of untenable slums was based on parameters that included environmental risk, proportion of female population, Scheduled Caste/Scheduled Tribe (SC/ST) population, minority population, and Below the Poverty Line (BPL) families. Accordingly, 115 tenable slums pockets and 99 non-tenable slums pockets accounting for 19,266 households and 10,616 households, respectively have been identified. Spatially, the southern parts, which exhibit more employment and institutional base, have been mapped to have more slum areas, as compared to the northern part of corporation is presented the Map 12.10.
Table 12.6Context of Slums and Measures Taken Since 2016
Coimbatore City Municipal Corporation
Total number of slums identified in RAY scheme
214
Total number of HHs in identified slums
29,882
Total number of evicted slums
64
Total number of houses allocated under JNNURM and AHP
9,762
In addition to the 214 slums under the RAY scheme, more slum pockets were also identified under various other schemes and missions of the government. A total of 64 slums were evicted and through schemes like JNNURM and Affordable Housing in Partnership (AHP) component, 9,762 houses have been allocated to rehabilitated slum dwellers by TNUHDB as mentioned in the Table 12.6.
The untenable slum areas in Coimbatore are categorized as such due to their high vulnerability to environmental and infrastructural risks. These settlements are located extremely close to water bodies, railway lines, and major roads such as state and national highways, making them unsafe for habitation. Slums like Uppiliar Thittu, Gandhi Nagar, Annaimedu, Periyar Nagar, V.O.C. Nagar, Karuppakal Thottam, Mullai Nagar, Echanari Railway Gate, and Sampath Street are exposed to frequent flooding, accidents and lack of infrastructure, rendering them unsuitable for in-situ development.
The Tamil Nadu Urban Habitat Development Board (TNUHDB) should prioritize the resettlement and rehabilitation of untenable slums in the above-mentioned location by identifying alternative sites. It should also undertake the rehabilitation of tenable slums through in-situ development in a phased manner.
Map 12.10: Location of Slums
Slums in Coimbatore City Municipal Corporation
DIRECTORATE OF TOWN & COUNTRY PLANNING - TAMIL NADU
DATA SOURCE Tamil Nadu Urban Habitat Development Board (Slums Identified in Rajiv Awas Yojana)
SCALE
0 0.4250.85 1.7 2.55 3.4 Km
PROJECTION: UTM ZONE 43N DATUM: WGS 1984
12.2.9Public Housing
Public housing projects that prioritize provision of safe and affordable housing for all residents are being formulated and implemented primarily through Tamil Nadu Housing and Urban Development Board (TNUHDB) and Tamil Nadu Housing Board (TNHB).
12.2.9.1 Tamil Nadu Urban Habitat Development Board (TNUHDB)
The Tamil Nadu Urban Habitat Development Board (TNUHDB), with its focus on housing for the weaker sections, has constructed over 4.40 lakhs tenements/houses, providing grants to urban poor families for housing. TNUHDB’s efforts contribute to achieving Sustainable Development Goal-11 of ensuring access to safe and affordable housing and upgrading urban poor habitations. The TNUHDB addresses the housing needs of EWS and LIG income categories. Over a period of 10 to 20 years, through various schemes under 11th finance commission, 12th finance commission, 13th finance commission, hire purchase, JNNURM and PMAY (AHP-HFA), TNUHDB has implemented 44 schemes providing a total of 18,647 tenements in Coimbatore LPA. Additionally, 7 schemes providing 1665 tenements are in progress under the PMAY-HFA. The details of the activities by TNUHDB in Coimbatore is provided below:
Table 12.7Tenements provided by TNUHDB
Schemes
Tenements
Implemented
18,647
Ongoing
1665
Proposed
2162
Sources: TNUHBD
In addition to the schemes that are on-going for providing new units, certain existing schemes have been assessed for reconstruction, having a total of 1892 tenements as provided in Table 12.8. These have been identified based on an assessment of their condition linked to the age and physical status / condition of the tenements.
Table 12.8Proposed Tenements by TNUHDB
Name of the Scheme
Type of Construction
No of Units
Periyar Nagar (SOP Ph- III)
Reconstruction
400
Kalaignar Karunanithi Nagar (SOP Ph - IV)
Reconstruction
360
Muthamizh Nagar (NOP II)
Reconstruction
460
Ukkadam Lake View (Slauter House)
Reconstruction
672
Total
1892
Sources: TNUHBD
12.2.9.2 Tamil Nadu Housing Board (TNHB)
The TNHB undertakes housing and area development schemes (consisting of plots) for EWS, LIG, MIG and HIG income groups. The projects by TNHB in Coimbatore LPA varied from individual houses, flats and plots through area development schemes as presented in the Table 12.9.
Table 12.9Housing Provided by TNHB
Projects
Tenements
Flats
2233
Individual Houses
4647
Area Development Schemes (Plots)
9311
Sources: TNUHBD
Spatially, the TNUHDB and TNHB implemented schemes are predominantly located in the core municipal corporation and on the periphery of the corporation boundary as shown in Map 12.11. The ongoing schemes are also located inside the corporation boundary as shown in Map 12.12. While these have addressed the issues of close proximity of housing units to the employment locations, in view of the growth envisaged in the outer areas, including factor of affordability, in the coming years, it is imperative that the focus area would move to the emerging areas of activity and population concentration expected in the coming years.
Map 12.11: Implemented Public Housing Scheme (TNUHBD & TNHB)
IMPLEMENTED PUBLIC HOUSING SCHEMES
Map 12.12: Ongoing Public Housing Schemes (TNUHBD)
ONGOING PUBLIC HOUSING SCHEMES
12.3 Housing Shortage
The housing shortage has been calculated based on the approach used in the Technical Group on Housing – XII Five Year Plan (TG 12) by the Ministry of Housing and Urban Poverty Alleviation, Government of India. This approach considers multiple factors, which inter-alia include deficit in housing stock against the existing number of households, number of Temporary Houses, shortage due to congestion (overcrowding) and shortage due to obsolescence.
12.3.1Houseless Households
Households that do not live in buildings or census houses but live in the open or roadside, pavements, under flyovers and staircases, or in the open in places of worship, mandaps, railway platforms, etc., are treated as Houseless Households. According to 2011 census, there were 442 houseless households in the Coimbatore district. Considering 70% of the district households are in LPA, a total of 310 houseless households are estimated in LPA.
Table 12.10Houseless Households in Coimbatore District 2011
Coimbatore District
Houseless Households
Rural
70
Urban
372
Total District
442
Sources: Census 2011
12.3.2Temporary (Kutcha) Houses
The housing typologies are classified as permanent/ pucca, semi-permanent/ semi-pucca and temporary/ kutcha based on the residential structures (the percentage of housing typologies as in table 2.11).
Table 12.11Housing Typology
Housing Typology
District(%)
Overall LPA
Corporation
Municipality
Town Panchayat
Revenue Villages
Pucca / permanent
81.8%
88.9%
78.52%
73.79%
74.86%
Semi Pucca / Permanent
15%
9%
16.92%
22.31%
20.82%
Kutcha / Temporary
2.1%
0.5%
0.97%
2.23%
2.47%
HHS Sensus 2011
6,73,033
4,26,482
38,913
85,686
1,21,952
Kutcha / Temporary Households in LPA
2,132
377
1,910
3,012
Sources: Census of India, 2011
The Town Panchayats and Revenue villages have a relatively lower proportion of their houses under Pucca category (73.79% and 74.86% respectively). For the estimation of housing shortage, the temporary houses in which both walls and roof are made of materials, which have to be replaced frequently are considered. According to census 2011, there are a total of 7,431 temporary houses estimated in the LPA.
12.3.3 Shortage Due to Congestion
As per 2011 census, 6.5 percent of households did not have a separate room. Accordingly, the shortage due to congestion in LPA is estimated to be 43,747 units.
12.3.4 Shortage Due to Obsolescence
According to the 58th Round of NSSO, 4.3 percent of households lived in obsolete houses. Accordingly, the shortage due to obsolescence in LPA is estimated to be 28,940 houses.
12.3.5 Houses in Dilapidated Condition
As per 2011 census, 0.5%, 1%, 0.8%, and 1% houses are in dilapidated condition in corporation, municipalities, town panchayats and Revenue villages respectively as mentioned in the Table 12.12, adding up to 4,425 households being in dilapidated housing in the LPA.
Table 12.12Dilapidated Houses in LPA 2011
Condition
Corporation
Municipality
Town panchayat
Revenue village
Dilapidated
0.5%
1%
0.8%
1%
Dilapidated Houses
2,132
389
685
1219
Sources: Census of India, 2011
12.3.6Households in Slums
According to the RAY scheme, 214 slums consisting of 29,882 households were identified. Accounting for the households allotted with alternate accommodation since 2015 (9,762 units) through schemes like JNNURM and AHP, a total of 20,120 households are assessed to be in slums requiring better housing and infrastructure conditions and percentage of shortages mentioned in the Figure 12.3.
Figure 12.3: Percentage of Housing Shortage in LPA
Table 12.13Housing Shortages in LPA for 2024
Housing shortage
Number of House-holds
Percentage of shortage
Houseless Households
310
0.3%
Temporary houses
7,431
6.8%
Shortage due to congestion
43,747
43.8%
Shortage due to obsolescence
28,940
26.6%
Dilapidated houses
4,425
4.1%
Slum houses
20,120
18.5%
Total
1,04,973
100%
Sources: Census of India, 2011, TG12 report, Urban Local Bodies
12.4 Residential Demand and Supply Market
Overall, the housing shortage for LPA is estimated to be of the order of 1,04,973 units in the LPA as per the census 2011 datum as mentioned in the Table 12.13.
Independent dwellings and modest apartment complexes are increasingly giving way to a more diverse typology of housing in Coimbatore, including apartments, villas, and luxury homes, to some extent contributed by NRI investment in the city’s real estate. Coimbatore residential property prices have increased 5-10% annually, mostly in Saravanampatti, Peelamedu, and RS Puram areas and studies show that flats have a 70% occupancy rate overall, and in respect of luxury villas, it is 50-60%.
12.4.1Residential Property Development Trends
The residential layout and residential building approvals in the LPA for the last five years (2020-2024) indicate 163 layout approvals and 55 building approvals as presented in Map 12.13. The residential layout approvals over the years demonstrate a scattered nature of developments without any specific designated residential growth direction. There are noticeable developments along the transit corridors and in the northern side of LPA compared to the southern side.
Map 12.13: Building and Layout Approvals (DTCP 2020-2024)
Building and Layout Approvals (2020 - 2024)
The pattern of layout approvals indicates the type of activities that have emerged in respective areas.
In the Municipal Corporation area, the following patterns emerge:
Kalapatti & Saravanapatti – These areas have emerged as IT and industrial hubs, with proximity to TIDEL Park and KGISL SEZ, leading to demand for high-density residential layouts and commercial spaces.
ii. Vellakinar & Thudiyalur – Located near NH-181 and Avinashi Road, these regions serve as key residential zones supporting the IT sector and industrial workforce.
iii. Veerakeralam & Chinnavedampatti – With increasing urbanization, these areas are experiencing mixed-use developments, driven by improved road networks and public transport connectivity.
iv. Kurichi – A rapidly growing locality benefiting from Coimbatore’s western expansion, where affordable housing and township projects are gaining momentum.
In the rest of LPA areas, the following type of developments have emerged:
i. Vellanaipatti & Irugur – Located near Coimbatore International Airport, these areas are seeing rapid real estate development, including premium residential layouts and logistics hubs.
ii. Pattanam & Kallapalayam – Proximity to NH-81 and NH-544 makes these regions ideal for industrial expansion, warehousing, and low-cost housing projects.
iii. Malumichampatti & Seerapalayam – Emerging as satellite towns with a focus on integrated township developments and large-scale residential layouts.
iv. Madukkarai & Kalangal – Home to manufacturing units, logistics parks, and educational institutions, leading to increasing demand for worker housing and commercial properties.
v. Keeranatham & Gudalur – Benefiting from IT sector spillover from Saravanapatti, driving residential and infrastructure growth.
In terms of the spatial patterns of approvals availed, the core corporation and expansion areas as high activity zones (more than 100,000 Sq. m):
Coimbatore Corporation received the highest approvals due to rapid urbanization, commercial growth, and increasing population density.
i. Vellanaipatti, located next to the corporation, is witnessing spill-over development, driven by its proximity to IT parks, industries, and improved connectivity.
The emerging residential and commercial hubs with moderate levels of approvals accorded (50,001 - 100,000 Sq.m) include the following:
i. Thenkarai, Madampatti, Veerakeralam, Vedapatti, Vellalur, Thudiyalur, Vellakinar, Chinnavedampatti, Kalapatti
ii. Kalapatti & Chinnavedampatti are near IT corridors, influencing high-rise approvals.
iii. Vellalur is near the Integrated Bus Terminus, making it a key transit-oriented zone.
iv. Thudiyalur & Vellakinar are along the Coimbatore-Mettupalayam corridor, which is seeing increasing urban development
These Villages are experiencing moderate approvals due to:
Proximity to Coimbatore city and arterial roads (NH-544 & NH-81).
Presence of educational institutions, employment hubs, and logistics parks.
12.5 Household Projections
The slow-growth zones (lower approval areas with 1,000 - 10,000 Sq.m) include the villages of Arisipalayam, Myleripalayam, East Chitrachavadi, Somayampalayam, Keeranatham, Vilankurichi, Irugur, and Vadavalli. This could be attributed to
Limited infrastructure & basic amenities, making them less attractive for large-scale development.
Environmental constraints, such as hilly terrain (Vadapatti, Vadavalli) or waterbody proximity.
Lower land prices and less commercial interest, leading to slow real estate activity.
Irugur, despite being a railway hub, has limited approvals due to industrial zoning restrictions and lower housing demand.
Household projections have been attempted to assess the likely requirement of houses by the horizon period.
Table 12.14Projection of Household and Density 2041
Coimbatore LPA
Population 2041
Households 2041
Household density 2041
Corporation
39,03,784
12,19,933
4732
Municipality
3,05,996
95,624
980
Town panchayat
5,67,685
1,77,402
563
Revenue village
10,47,241
3,27,263
380
Total
58,24,706
18,20,221
1188
Based on the historical census data, the population for 2041 in the Coimbatore LPA has been projected as 58,24,706 comprising of 39,03,784, 3,05,996, 5,67,685 and 10,47,241 population in the corporation, municipalities, town panchayats and Revenue villages respectively as mentioned in the Table 12.14.
Accordingly, the households for the same were projected as 12,19,933, 95,624, 1,77,402 and 3,27,263 households with a density of 4844, 1030, 577, 374 in corporation, municipalities, town panchayats and Revenue villages respectively. The total number of households in LPA by 2041 is projected as 18,20,221 with a household density of 1,188 households per sq.km as presented in the Map 12.15. A gradual decline in the household size has been adopted with a household size of 3.2 from 2031 onwards (considering the HH size in 2011 was 3.6 and 2024 was 3.4 approximately). The spatial distribution of households continues to present a scenario of dense core with a noticeable growth along the major connecting roads as presented in the Map 12.14. Goundampalayam and Veerakeralam show possibilities for an increased density due to the existence of educational institutions and universities as well as the availability of social amenities and character of the area.
12.5.1Housing Requirement for 2041
The housing requirement assessment in relation to the current status of housing as well as projected number of households for 2041 is provided in the below Table 12.15.
Table 12.15Assessment of Housing Requirements for 2041
Category
No. of Households2024
Projected Households2041
Total Requirement of HHs (considering HH size of 3.4 upto 2031, 3.2 upto 2041)
Corporation
675835
1219933
544098
Municipalities
53254
95624
42370
Town Panchayat
133609
177402
43793
Revenue village
230230
327261
97031
Consolidated LPA
1092928
1820220
7,27,292
Housing shortage (calculated as per census 2011, 58th round NSSO, RAY scheme)
1,04,972
Total LPA
8,32,264
Including the existing housing shortage and accounting for projected population growth and household size, the total housing requirement by 2041 is estimated at 832,264 units
12.5.2Income Categories
The income categories according to PMAY guidelines are classified as EWS, LIG, MIG I and MIG II based on the annual income of the households as less than 3 lakh, 3-6 lakh, 6-12 lakh and 18 lakhs respectively. During the preparation of ‘Updation of Comprehensive Mobility Plan for Coimbatore Local Planning Area (LPA) 2023’, household interview surveys were conducted covering 12,117 households’ which also inquired into their household income levels as mentioned the Table 12.16. The number of households under different income groups across the LPA is estimated as follows:
Table 12.16Classification of income catagories
Income Group
Annual Income (INR)
Sample Household
Percentage
EWS (Economically Weaker Section)
below 3 lakhs
5214
43%
LIG (Lower income group)
3 lakh - 6 lakh
5193
42.8%
MIG I (Middle income group) and above
6 lakh - 12 lakh
1,710
14.2%
Total
12117
100%
Source: 'Updation of Comprehensive Mobility Plan for Coimbatore Local Planning Area (LPA) 2023’, Technical group report on urban housing shortage TG-12
Based on the above percentage of income distribution, the number of households required for each income category in 2041 is projected in the Table 12.17.
Table 12.17Housing requirement & income categories
Income Group
Annual Income (INR)
Percentage
Households Required in2041
EWS (Economically Weaker Section)
below 3 lakhs
43%
3,57,874
LIG (Lower income group)
3 lakh - 6 lakh
42.8%
3,56,209
MIG I (Middle income group)
6 lakh - 12 lakh
14.2%
1,18,183
The EWS and LIG are the income categories that need primary focus through public housing schemes. The MIG and HIG shall be catered through the private market.
12.5.3Land Allocation
The total area of the LPA is 1531.57 sq.km, and there is 317.67 sq.km of existing residential land use constituting 20.74% of the total area of LPA. The additional housing units is calculated with a household size of 3.4 upto 2031 and 3.2 upto 2041, considering a steady decrease in the household size, the additional households required for 2041 is estimated at 7,27,292 units. The housing shortage is estimated as 64,177 (of total 1,04,972), considering only houseless households, congested houses, slums will require
land. Hence the total additional houses/households requiring additional land will be 7,91,469. Assuming an average housing unit size as 1000 sq.ft, the total built-up area for the additional houses is calculated as 791.47 mn sq. ft and after applying a FSI of 1.5 (1.5 against 2 permitted), the land area required will be 527.64 mn sq. ft. Further including the plot coverage as 50%, roads as 25% and livable buffers as 15%, the total land area adds up to 1108.06 mn sq. ft which when converted to sq.km, it is 103 sq.km.
In continuation with the above analysis, and considering the potential to accommodate additional housing units in the existing low-density areas—up to 20% of the additional housing units projected by 2041—and the provision that residential land use can accommodate at least 20% of commercial space (as per TNCDBR), the additional land area required for residential use has been assessed to be 98.9 sq.km. The details are provided in Table 12.18 below:
Table 12.18Residential Land Area Required for LPA 2041
Particulars
Coimbatore LPA
Population (as per Census 2011)
24,57,452
Households (as per Census 2011)
6,73,033
No. of Households in 2024
10,92,928
Projected households 2041
18,20,221
Additional House/households (at the rate of 3.4 up to 2031 and 3.2 up to 2041)
Total additional housing in LPA requiring additional area
7,91,469
Assuming average housing unit size (43% EWS, 42.8% LIG, 14.2% MIG and above)
1000 sq. ft
Total Built -up Area
79,14,69,000 sq. ft
Assumed FSI consumption (1.5 against the 2 permitted)
1.5
Land area required after applying FSI
52,76,46,000 sq. ft
Land area required after including plot coverage (adding 50%)
79,14,69,000 sq. ft
Land area requirement including infrastructure (adding 25% roads, 15% liveable spaces)
110,80,56,600 sq. ft
Total land requirement (converted to sq.km)
103 sq.km
Assuming 20% of the requirement will be built on the existing residential area
82 sq.km
Adding 20% of a permissible commercial space in residential landuse
98.9 sq.km
In case of FSl increase to 2.5, FSl 2 may be consumed, which will result in the requirement of additional residential land use to 74.1 sq.km, and if FSl is increased to 3.5 with likely consumption of 3, it may result in the requirement of additional area under residential land use to the extent of 49.4 sq.km
9: Total Residential Land Area Required fo
ided in the table below: It is to be noted that, for the estimation, the assumed FSI is 1.50 against ssessment details for the constituent units in terms of the Corporation, Municipalities, To
Category
re lEasxnididset uinnstgieal
HPoruo 2sj0ee4ch1toeldds
Total requirement (c Ho 3H on.4fs s Hi uidzHpeetsro oinfg2031 , 3.2upto 2041 )
Assuming ho avuesreahgoeld d E LeWHInGSsa,i,t ( 1 4y44-23. H2.%8%H%/ M IG and above)
B Rueils StT-iqdout.epa fnt altriaela
reLqaunidr fet adre Saq.
Land area r i sne cqcqo.luvu ftiedrre (iaandgdg aed pfit inlnoegtr50%)
Land area requirement in (af i irdnnadcs siltnuqrgdu.kic 2nmtg5u%re roads, 1 5% livable spaces)
r (eT tcqooout snaiqvrlee. lkmarmtneed)dnt
2A0s%su omf i tnhge w r tei rhlqeleus bii eerdxee bimsnuttieilitnang otl sn area
Adding 20% of a c r poe semspriamdmceieesnrstc iiniaiballle landuse
Corporation
1 1 5.28
1 21 9933
5,44,098
1 000
54,40,98,000
36,27,32,000
54,40,98,000
76,1 7,37,200
71
57
68
M unicipal ities
22.326
95624
42,370
1 000
4,23,70,000
2,82,46,667
4,23,70,000
5,93,1 8,000
6
4
5
Town Panchayat
57.97
1 77402
43,793
1 000
43,793,000
2,9 1 ,95,333
4,37,93,000
6,1 3,1 0,200
6
5
5
Revenue vi l lage
1 21 .8
327261
97,03 1
1 000
9,70,3 1 ,000
6,46,87,333
9,70,3 1 ,000
1 3,58,43,400
1 3
1 0
1 2
Consol idated LPA
3 1 7.376
1 820220
7,27,292
1 000
72,72,92,000
48,48,61 ,333
72,72,92,000
1 ,01 ,82,08,800
95
76
9 1
Housing shortage (calcu lated as per census 201 1 )
64,1 77
1 000
6,41 ,77,000
4,27,84,667
6,41 ,77,000
8,98,47,800
8
7
8.0
Total LPA
7,91 ,469
1 000
79,1 4,69,000
52,76,46,000
79,1 4,69,000
1 ,1 0,80,56,600
1 03
82
98.9
12.6 Proposal & Strategies
12.2 Current Housing Scenario
The first master plan of Coimbatore (1994) noted that the pattern of residential development in the Coimbatore LPA followed the most common pattern observed in other urban areas of Tamil Nadu - high densities in the older parts and low density in the newly planned developments, particularly in peripheral areas. The newly planned areas had better street patterns and shaped plots, whereas older parts, which were primarily spontaneous/ organic developments, were supported by context-based infrastructure developments later. The pattern of development was already evident along the transportation lines, and accordingly, future developments were also formulated in consonance with the same.
Coimbatore, at present, is experiencing a vibrant growth in all sectors. Over the last two decades, diversification of its industrial base from its earlier textile and pump industries base to include IT and ITes sectors, major infrastructure upgrades such as the Coimbatore International Airport, and improved road connectivity have boosted real estate development/sales. At the city scale, the spatial patterns of location of activities need to be taken into cognisance to appropriately address the issues of demand and supply of housing in due regard to the income groups and affordability, overcrowding in core urban areas, evolution of slums, and need for infrastructure upgradation. As cities grow and evolve, addressing housing needs becomes increasingly complex, requiring innovative solutions and collaborative efforts to ensure equitable access to safe, affordable, and sustainable housing options for all. This plan envisages addressing such critical issues in consonance with the emerging growth patterns in Coimbatore, through measures for the delivery of affordable and adequate housing.
As of 2011, the Coimbatore district had a total population of 34,58,045, with 9,58,035 households (Table 12.1), with the average household size working out to 3.6. There has been a declining trend in the household size over the years, which was 3.8 in 2001, declined by 0.2 in 2011.
Table 12.1Population and Household of Census 2011
Coimbatore
Population
Households
Household
District
2011
2011
size 2011
Urban
26,18,940
7,15,878
3.66
Rural
8,39,105
2,42,157
3.46
Total
34,58,045
9,58,035
3.60
Sources: Census of India, 2011
As per census 2011, Coimbatore Local Planning Area (LPA) had a population of 24,57,452 and 6 , 7 3 , 0 3 3 households with the average household size being 3.6. The LPA accounted for about 70 % of the district’s households. As per the assessment by the constituent Local Bodies of the LPA, the population in 2024 has been of the order of 37,15,957. The Multiple Indicator Survey in India, NSS report no.589 (78/5.1/1), 2020-2021, indicates that the average household size in Tamil Nadu was 3.5 (3.4 in urban areas and 3.7 for rural areas). Accordingly, based on an average household size of 3.4, the households for the assessed population in 2024 are estimated to be 10,02,929, as mentioned in the Table 12.2 registering an increase of 62.4% with respect to the number of households from 2011 to 2024. The trends demonstrate a period of accelerated urbanization and declining household size, underscoring the need for appropriate approaches to accommodate the expanding population and evolving household dynamics.
Table 12.2Existing Households Details in LPA
Coimbatore LPA
Population2011
Households2011
Household Size 2011
Population2024
Households2024 (@3.4persons per household)
Increase in No. of Household
Corporation
15,84,719
4,26,482
3.72
22,97,839
6,75,835
58.5%
Municipality(4)
1,39,444
38,913
3.58
1,81,065
53,254
36.9%
Town panchayat(21)
3,03,834
85,686
3.55
4,54,271
1,33,609
55.9%
Revenue village (66)
4,29,455
1,21,952
3.52
7,82,782
2,30,230
88.8%
Total
24,57,452
6,73,033
3.65
37,15,957
10,92,929
62.4%
Source: Census of India, 2011, Population 2024 (Coimbatore City Municipal Corporation), 2024 HH projected
Map 12.4: Density of Households 2024
DENSITY OF HOUSEHOLDS 2024
Map 12.5: Distribution of Households 2024 (Corporation)
Distribution of Households 2024 (corporation)
DIRECTORATE OF TOWN & COUNTRY PLANNING - TAMIL NADU
DIRECTORATE OF TOWN & COUNTRY PLANNING - TAMIL NADU
DIRECTORATE OF TOWN & COUNTRY PLANNING - TAMIL NADU
DIRECTORATE OF TOWN & COUNTRY PLANNING - TAMIL NADU
DIRECTORATE OF TOWN & COUNTRY PLANNING - TAMIL NADU
DATA SOURCE Coimbatore City Municipal Corporation
DATA SOURCE Coimbatore City Municipal Corporation
DATA SOURCE Coimbatore City Municipal Corporation
DATA SOURCE Coimbatore City Municipal Corporation
DATA SOURCE Coimbatore City Municipal Corporation
SCALE 0 0.4250.85 1.7 2.55 3.4 Km PROJECTION : UTM ZONE 43N DATUM : WGS 1984
SCALE 0 0.4250.85 1.7 2.55 3.4 Km PROJECTION : UTM ZONE 43N DATUM : WGS 1984
SCALE 0 0.4250.85 1.7 2.55 3.4 Km PROJECTION : UTM ZONE 43N DATUM : WGS 1984
SCALE 0 0.4250.85 1.7 2.55 3.4 Km PROJECTION : UTM ZONE 43N DATUM : WGS 1984
SCALE 0 0.4250.85 1.7 2.55 3.4 Km PROJECTION : UTM ZONE 43N DATUM : WGS 1984
DIRECTORATE OF TOWN & COUNTRY PLANNING - TAMIL NADU
DIRECTORATE OF TOWN & COUNTRY PLANNING - TAMIL NADU
DIRECTORATE OF TOWN & COUNTRY PLANNING - TAMIL NADU
DIRECTORATE OF TOWN & COUNTRY PLANNING - TAMIL NADU
DIRECTORATE OF TOWN & COUNTRY PLANNING - TAMIL NADU