Population projection for Coimbatore LPA using various methods....496
Arithmetical increase method....496
Geometrical increase method....500
Housing - Annexures....504
Existing Population And Households 2011, 2024....504
Projected Population & Households 2031 And 2041....509
Condition Of Census Houses 2011....513
Tenure Of Census Houses 2011....517
Public Housing Provided By Tnuhdb....521
Public Housing Provided By Tnuhdb – Ongoing....523
Public Housing Provided By Tnhb....527
List Of Slums Evicted And Alloted Under Jnnurm & Ahp
In Coimbatore Division....527
Existing Stormwater Drain....530
Proposed Storm Water Drain....534
Existing Solid Waste Management....538
Proposed Solid Waste Generation....542
Annexure no: 10-1 shows the “Coimbatore LPA Present Power consumption and Service connection details – Substation wise”....546
Annexure no. 10-2 “Substation wise Energy Capacity and Gap....552
Energy Demand projection – Village wise....556
Coimbatore Master Plan - 2041....556
Proposed Substation Capacity - Short term and Long Term – Village level....563
MENT ORDERS
GOVERNMENT ORDERS....568
Government Orders
xiii
List of Abbreviations
AAI
Airport Authority of India
AC
Air Conditioned
AG
Aspirational Growth
AHP
Affordable Housing in Partnership
AID
Automatic Incident Detection
API
Application Programming Interface
ASI
Archaeological Survey of India
ATIS
Automatic terminal information service
ATMP
(Assembly, Testing, Marking & Packaging
ATMS
Advanced traffic management system
BAU
Business as Usual
BFSI
Banking, Financial Services, and Insurance
BIS
Bureau of Indian Standards
BOV
Battery Operated Vehicles
BPO
Business process outsourcing
BWSSB
Bangalore Water Supply and Sewerage Board
CAGR
Compounded Annual Growth Rate
CASC
Coimbatore Auto Sports Club (
CBD
Central Business District
CBIC
Chennai-Bengaluru Industrial Corridor
CBIC
Chennai-Bengaluru Industrial Corridor
CBMIC
Chennai Bengaluru-Mumbai Industrial Corridor
CBSE
Central Board of Secondary Education
CCMC
Coimbatore City Municipal Corporation
CCTV
Closed-circuit television
CETPs
Common effluent treatment plants
CHC
Community Health Center
CHIL SEZ
Coimbatore Hi-tech Infrastructure Private Limited Special Economic Zone
CIBI
Coimbatore Innovation and Business Incubator
CII
Confederation of Indian Industry
CIT
Coimbatore Institute of Technology
CKIC
Chennai - Kanniyakumari Industrial Corridor
CLPA
Composite Local Planning Area
CMP
Comprehensive Mobility Plan
xxviii
CNG Compressed Natural Gas CODISSIA Coimbatore District Small Industries Association CPCB Central Pollution Control Board CPHEEO Central Public Health and Environmental Engineering Organisation CPS Community Parks CSC Common Service Centers CUMTA Chennai Unified Metropolitan Transport Authority CWSN Children With Special Needs CWSS Combined Water Supply Schemes DAY-NULM Deen Dayal Antyodaya Yojana - National Urban Livelihoods Mission DDP Detailed Development Plan DEWATS Decentralised Wastewater Treatment System DGPS Differential Global Positioning System DHH District Headquarter Hospital DIC District Industries Center (DIC) DMA District Metering Areas DPSUs Defence Public Sector Undertakings DRDO Defence Research and Development Organisation DSDC District Skill Development Centre DTCP Directorate of Town & Country Planning ECBC Energy Conservation Building Code ELCOT Electronics Corporation of Tamil Nadu ESDM Electronics Hardware Manufacturing ESDM Electronics System Development and Maintenance ESI Employees State Insurance ESR Elevated Storage Reservoirs ESZ Eco-Sensitive Zones ETA Estimated Time of Arrival ETC Estimated Time of Completion ETP Effluent Treatment Plant EWS Economically Weaker Section FAR Floor Area Ratio FHTC Functional Household Tap Connections FMSCI Federation of Motor Sports Clubs of India FRL Full Reservoir Level FSI Floor Space Index FSTP Faecal Sludge Treatment Plant GCCs Global Capability Centres
xxix
GCP Ground control point GDDP Gross District Domestic Product GDP Gross Domestic Product GER Grass Enrollment Ratio GI Geographic Indication GIS Geographical Information System GoTN Government of Tamil Nadu GQ Golden Quadrilateral GSDP Gross State Domestic Product GSI Geological Survey of India GSR Ground Service Reservoirs GVA Gross Value Addition H&UD Housing & Urban Development HACA Hill Area Conservation Authority HDI Human Development Index HGT High Growth Trajectory HIG Higher Income Group HR&CE Hindu Religious & Charitable Endowments Departments HSC Health Sub-Center HVAC Heating, ventilation, and air conditioning ICCC Integrated Command and Control Centre ICD Inland container depots ICTT International Container Transshipment Terminal IIS Indian Institute of Science IISER Indian Institute of Science Education and Research IIT Indian Institute of Technology ILPs Integrated Logistics Parks IMD Indian Meteorological Department IPHS Indian Public Health Standards IPT Intermediate Public Transit IRC Indian Road Congress ISRO Indian Space Research Organization IT Information Technology ITeS Information Technology Enabled Services ITI Indian Training Institute ITS Intelligent Transport System JJM Jal Jeevan Mission JNNURM Jawaharlal Nehru National Urban Renewal Mission
xxx
KLD Kiloliters per Day KNTDA Kurichi New Town Development Authority L&T Larsen & Toubro Limited LIG Lower Income Group LPA Local Planning Area LPCD Liters per capita per day LPO Legal Process Outsourcing MBBR Moving Bed Biofilm Reactor MICE Meetings, Incentives, Conferences, and Exhibitions MIG Middle Income Group MLD Million Litres per Day MMDA Madras Metropolitan Development Authority MMLP Multimodal Logistics Park MPI Multidimensional Poverty Index MRTS Mass Rapid Transit System MSL Mean Sea Level MSME Micro, Small and Medium Enterprises MVA Megavolt-Amperes NBFCs Non-Banking Financial Companies NCT National Capital Teritory NDMA National Disaster Management Authority NDMC New Delhi Municipal Council NH National Highway NID National Institute of Design NIFT National Institute of Fashion Technology NIRF National Institutional Ranking Framework NMT Non- Motorized Transport NMV Non -Motorized Vehicles NPV Net Present Value NRSC National Remote Sensing Center NRW Non-Revenue Water NSSO National Sample Survey Office NULM National Urban Livelihood Mission OEMs Original Equiment Manufacturers OHT Over Head Tanks ORS Open Route Service OSM Open Street Map OSR Open Space Reservation
xxxi
PACS Primary Agricultural Credit Societies PDS Public distribution system PHC Primary Health Center PHPDT Peak Hour Peak Direction Traffic PMAY Pradhan Mantri Awas Yojana PPP Public-Private Partnership PSU Public Sector Unit PSU Public Sector Unit PwD Person with Disabilities R&D Research & Development RAY Rajiv Awas Yojana RFID Radio Frequency Identification RoB Rail over Bridge RoW Right of Way RRTS Regional Rapid Transit System RTO Regional Transport Office SaaS Software-as-a-Service SACON Sálim Ali Centre for Ornithology and Natural History SAFE Site Adjacent Factory Employee SBR Sequential Batch Reactor SCA Service Center Agency SCADA Supervisory control and data acquisition SDGs Sustainable Development Goals SEZ Special Economic Zone SH State Highway SHG Self-Help Groups SIDCO Small Industries Development Corporation SIPCOT State Industries Promotion Corporation of Tamil Nadu SME Small and Medium Enterprises SRTM Shuttle Radar Topography Mission STEM Science, Technology, Engineering, and Math STP Sewage Treatment Plant STPI Software Technology Park of India STR student-Teacher Ratio SUH Shelter for Urban Homeless T&CP Town & Country Planning TACTV Tamil Nadu Arasu Cable TV Corporation Limited TANGEDCO Tamil Nadu Generation and Distribution Corporation Limited
xxxii
TANTRANSCO Tamil Nadu Transmission Corporation Limited TDM Traffic Demand Management TIDCO Tamil Nadu Industrial Development Corporation TIDEL Tamil Nadu Industrial Development Corporation and Electronics Corporation of Tamil Nadu TIFR Tata Institute of Fundamental Research TMC Traffic Management Centers TNAU Tamil Nadu Agricultural University TNCDBR Tamil Nadu Combined Development Building Rules TNDIC Tamil Nadu Defence Industrial Corridor TNEB Tamil Nadu Electricity Board TNeGA Tamil Nadu e-Governance Agency TNGECL Tamil Nadu Green Energy Corporation Limited TNHB Tamil Nadu housing board TNPCB Tamil Nadu Pollution Control Board TNPDCL Tamil Nadu Power Distribution Corporation Limited TNPGCL Tamil Nadu Power Generation Corporation Limited TNSRLM Tamil Nadu State Rural Livelihood Mission TNSSGF Tamil Nadu Startup Seed Grant Fund TNSTC Tamil Nadu State Transport Corporation TNUHDB Tamil Nadu Urban Habitat Development Board TNULM Tamil Nadu Urban Livelihood Mission TOD Transit Oriented Development TP Town Panchayats TWAD Tamil Nadu Water Supply and Drainage Board UASB Upflow Anaerobic Sludge Blanket UDA Urban Development Authority UGPHC Up Graded Primary Health Centre UGSS Under Ground Sewerage Schemes ULB Urban Local Bodies UMTA Unified Metropolitan Transport Authority UNESCO United Nations Educational, Scientific and Cultural Organization UPHC Upper Primary Health Center URDPFI Urban and Regional Development Plans Formulation & Implementation URPs University Research Parks USGS United States Geological Survey VPRC Village Poverty Reduction Committee WTP Water Treatment Plant
SOCIAL INFRASTRUCTURE
Coimbatore District is on a progressive trajectory toward achieving social equity and sustainable human development. The district exemplifies a model of balanced urban growth, where economic development is complemented by strategic investments in human capital and social infrastructure.
To build upon this momentum in the LPA, future planning efforts must prioritise inclusive service delivery, equitable access, and the strengthening of last-mile linkages to ensure that the benefits of development reach all population segments.
In Urban Core Areas – The focus must evolve from mere access to a deliberate enhancement of quality in service delivery across sub-sectors of Social Infrastructure.
In Rural and Peri-Urban Areas – The focus must be placed on bridging infrastructure gaps, ensuring universal access, and last-mile delivery of social infrastructure.
These aims to guide Coimbatore LPA toward a socially inclusive future, where every citizen benefits from the city’s progress. It is aligned with Tamil Nadu’s vision of becoming a $1 trillion economy, wherein human capital is identified as growth driver for building a progressive society and access to essential goods and services is envisioned as a cornerstone for socially inclusive growth, particularly across the domains of healthcare, education, safety and security, as well as culture and sports infrastructure.
11.1Social Indicators
Coimbatore district reflects substantial progress in reducing multidimensional poverty and commitment to human development, highlighting the impact of sustained investments in social infrastructure.
11.1.1 Human Development Index (HDI), 2017
Coimbatore ranked 6th among all districts in Tamil Nadu with a Human Development Index (HDI) of 0.844 in 2017, placing it firmly in the ‘Very High Human Development’ category. The HDI is calculated as the average of three indices: the Life Expectancy Index, the Education Index, and the Gross National Income (GNI) Index. To put this into perspective, Coimbatore’s HDI is comparable to that of developed countries such as Kuwait (0.847) and even higher
than that of Oman (0.819), highlighting the district’s strong performance in health, education, and income dimensions..
11.1.2Multidimensional Poverty Index (MPI), 2019
The Multidimensional Poverty Index (MPI) derived from National Family Health Survey (NFHS) offers a more recent and granular assessment of deprivation across 10 indicators which are divided into three equally weighted dimensions: Education, Health and Standard of Living.
Notably, education and health, which fall under the domain of social infrastructure, together account for twothirds (2/3) of the MPI. This indicates the critical role that social infrastructure plays in improving human well-being. As per MPI data for the Coimbatore District:
The MPI value in the Coimbatore district has halved - from 0.009 in NFHS-4 (2015–16) to 0.004 in NFHS-5 (2019–21), indicating a significant overall reduction in deprivation.
The headcount ratio—which represents the percentage of people identified as multidimensionally poor—dropped from 2.29% to 0.96%.
This highlights that fewer people in Coimbatore are poor today, and those who are still poor face fewer and less severe hardships related to education, healthcare, and living conditions.
11.1.3Literacy Rate in Coimbatore LPA
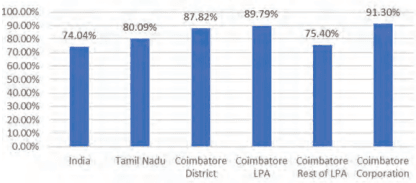
Coimbatore district demonstrates strong educational attainment, with a literacy rate of 87.82%, surpassing Tamil Nadu (80.09%) and India (74.04%). Coimbatore Corporation leads with 91.3%, while the Urban LPA stands at 84.3%, and Rural LPA lags at 75.4%, reflecting a significant urban-rural gap (~16%).
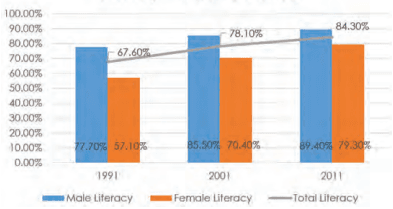
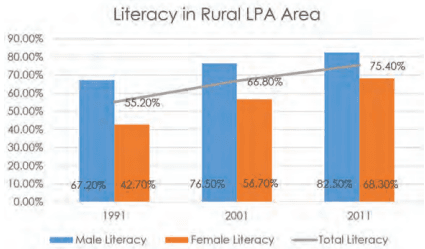
Between 2001 and 2011, literacy rate in Coimbatore LPA rose from 55.2% to 75.4%, driven by a notable increase in female literacy (42.7% to 68.3%). However, rural female literacy remains 14.2% below rural males and 21.2% below urban males, indicating persistent gender disparities.
Urban areas benefit from better infrastructure while rural zones face cultural and economic barriers.
Literacy Rate
Source: Census of India, 2011
Figure 11.1: Coimbatore LPA Literacy Rate Comparison with State and Country
Literacy in Urban LPA Area
Source: Census of India, 2011
Figure 11.2: Literacy Rate Trend in Urban Areas of Coimbatore LPA
Source: Census of India, 2011
Figure 11.3: Literacy Rate Trend in Rural Area of Coimbatore LPA
11.1.4Spatial Trends in Social Infrastructure Development
Further reinforcing this above trend in indices, a comparative analysis between the proposed land use (2001) and the existing land use (2021) in the Coimbatore Local Planning Area (LPA) reveals that institutional and commercial sectors have witnessed more pronounced growth than residential and industrial sectors. This clearly highlights that Coimbatore LPA has a strong foundation in institutional growth.
Coimbatore’s urban core areas have largely overcome access-based deprivations and now stand to benefit from improvements in service quality and efficiency. However, rural and peri-urban areas still show marginal deprivation. These areas require focused interventions to ensure lastmile delivery and equitable access to essential services.
11.2 School Education in Coimbatore LPA
11.2.1Distribution of Schools in Coimbatore LPA
11.2.1.1 Category wise Distribution of Schools in LPA
The available data on the distribution of schools across different categories, funding types, and management systems within the region reveals important patterns that highlight both the strengths and gaps in the existing educational infrastructure. A total of 1,172 schools have been identified, distributed across various administrative units such as Corporation, Municipalities, Town Panchayats, and Revenue Villages. These schools are categorized into five types: Pre-Primary, Primary, Middle, High, and Higher Secondary Schools.
School Category-wise Distribution in LPA
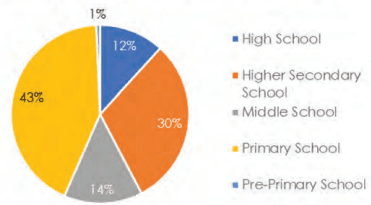
Figure 11.4: Category wise Distribution of Schools in Coimbatore LPA
A review of the distribution across school categories indicates that Primary Schools constitute the largest proportion (42.7%) of the total, followed by Higher Secondary Schools (30.5%) and Middle Schools (14.2%). High Schools and Pre-Primary Schools account for 11.8% and 0.7%, respectively. This distribution aligns with a typical educational pyramid structure, where the base level—Primary Education—has the widest presence, ensuring foundational education at the local level, while the number of institutions tapers off at higher education levels, reflecting increasing centralization and specialization.
Table 11.1Category wise Distribution of Schools in Coimbatore LPA
School Category
Corporation
Municipality
Town Panchayat
Revenue Villages
Grand Total
%
Higher Secondary School
215
22
55
66
358
31%
High School
72
7
21
38
138
12%
Middle School
63
18
25
61
167
14%
Primary School
215
23
86
177
501
43%
Pre-Primary School
7
0
0
1
8
0.7%
Grand Total
57249%
70<sub>6</sub>%
18716%
34329%
1172100%
100%
Spatially, Corporation areas exhibit the highest concentration of schools (49% of the total), followed by Revenue Villages (29.3%), Town Panchayats (15.9%), and Municipalities (6%). This pattern suggests a strong presence of educational infrastructure in urban areas, particularly within the core city limits. In contrast, Revenue Villages and Town Panchayats, despite serving a considerable population base, have relatively fewer schools, indicating potential access gaps in less urbanized areas.
11.2.1.2 Funding-wise Distribution of Schools in LPA
The funding structure of schools further reveals the role of both public and private sectors. Government schools account for 46% of the total institutions, making them the largest single contributor to the education system. Un-aided private schools, however, are nearly equal in number (44%), suggesting a significant presence of privately managed educational institutionsthroughout the LPA. Fully Aided and Partially Aided schools comprise 7% and 3%, respectively, while Central Government institutions constitute only a negligible share.
Table 11.2Funding wise Distribution of Schools in Coimbatore LPA
Funding Category
Corporation
Municipality
Town Panchayat
Revenue Villages
Grand Total
%
Central Govt
3
0
1
0
4
0%
Fully Aided
61
6
5
11
83
7%
Government
175
30
235
98
538
46%
Partially Aided
22
3
2
5
32
3%
Un-aided
311
31
100
73
515
44%
Grand Total
572
70
343
187
1172
100%
49%
6%
29%
16%
100%
11.2.1.3 Management wise Distribution of Schools in LPA
With regard to the management and curriculum of schools, the Samacheer Kalvi or State Board system overwhelmingly dominates the landscape, comprising 92.3% of all schools. Central Board of Secondary Education (CBSE) schools represent 6.9%, followed by International Board and ICSE schools with marginal shares. CBSE and International schools are predominantly concentrated in Corporation and Town Panchayat areas, while their presence in rural regions is almost negligible
Table 11.3Management wise Distribution of Schools in Coimbatore LPA
Management Category
Corporation
Municipality
Town Panchayat
Revenue Villages
Grand Total
%
CBSE
47
4
21
9
81
6.91
ICSE
2
1
0
1
4
0.34
International Board
2
0
2
1
5
0.43
Samacheer Kalvi / State Board
521
65
320
176
1082
92.32
Grand Total
572
70
343
187
1172
100
48.81%
5.97%
29.27%
15.96%
100%
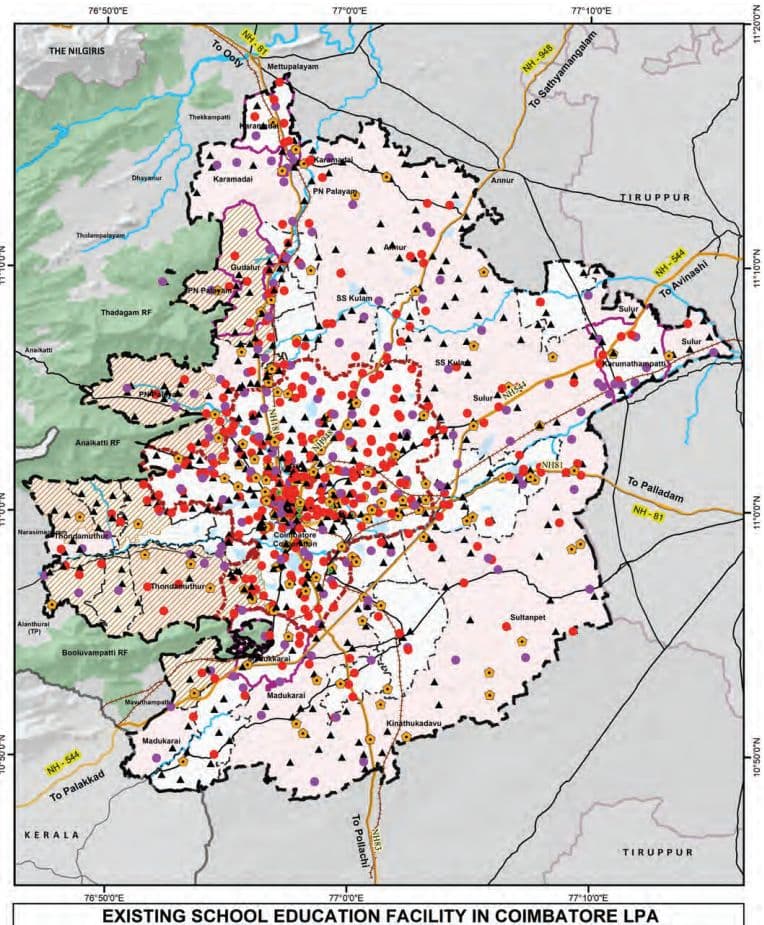
Map 11.1: Existing School Educations in Coimbatore LPA
11.2.2Students Enrolment in School Education
Table 11.4School Management wise Students Enrolment in Coimbatore LPA
Management
Total Number of Boys
Total Number of Girls
Total Number of Students
Central Govt
3567
3188
6755
Fully Aided
10339
10311
20650
Government
50806
53739
104545
Partially Aided
14184
16903
31087
Un-aided
165935
153495
319430
Grand Total
244831
237636
482467
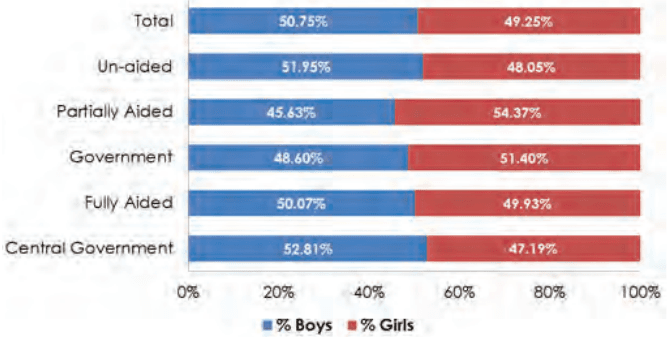
Figure 11.5: Management wise Boys and Girl Students Enrolment in Coimbatore LPA
The Coimbatore LPA records a total student enrollment of 482,467, with a balanced gender ratio (50.7% boys, 49.3% girls), indicating steady progress toward gender parity in education. Un-aided schools account for 66.2% of enrollments, reflecting high demand. Over 156,000 students attend Government, Fully Aided, and Partially Aided schools.
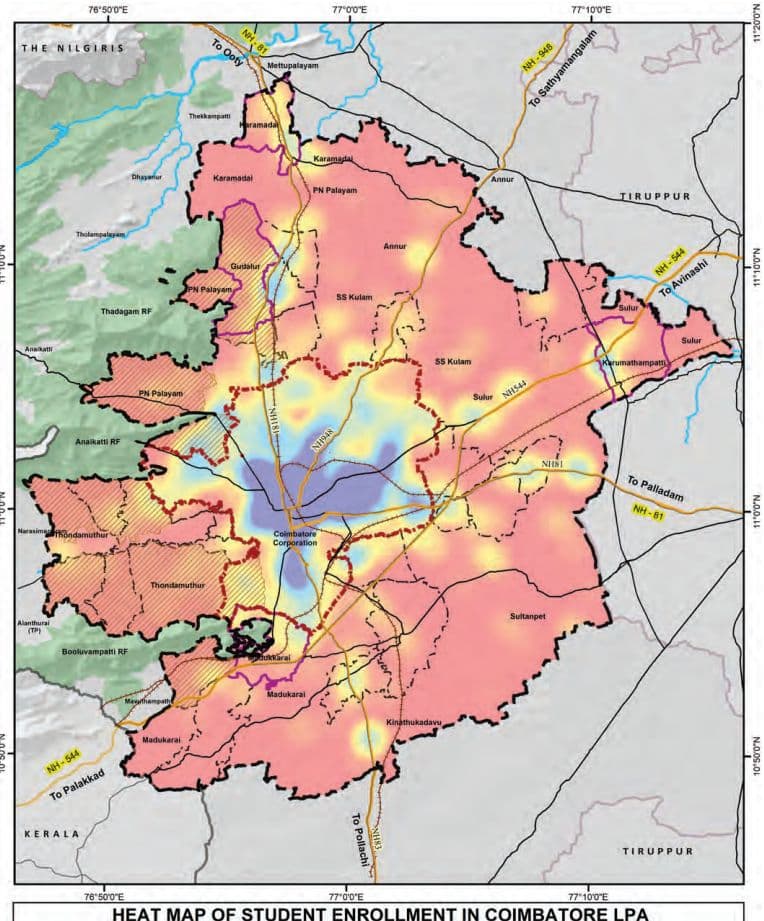
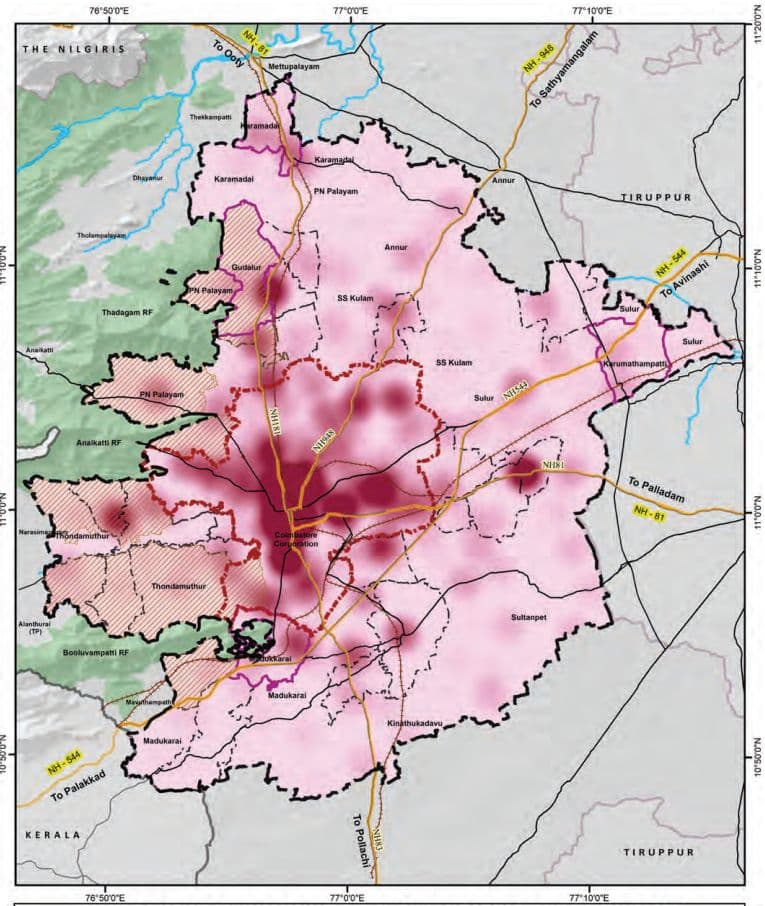
Map 11.2: Heatmap of Students Enrolment in Coimbatore LPA
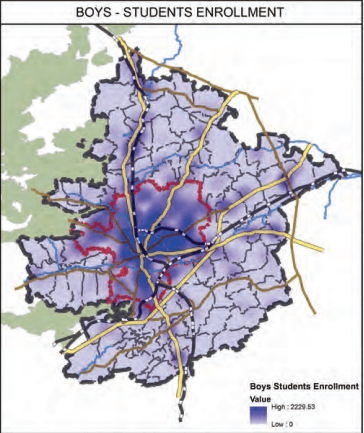
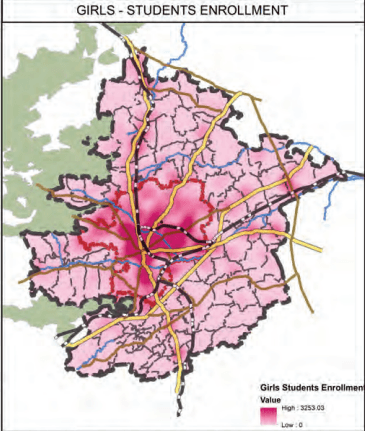
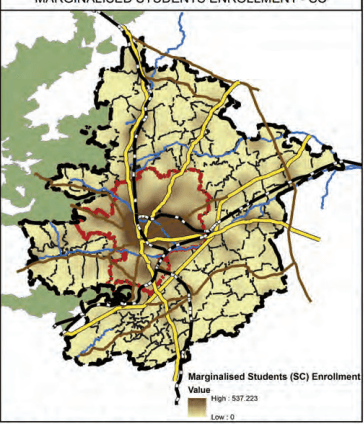
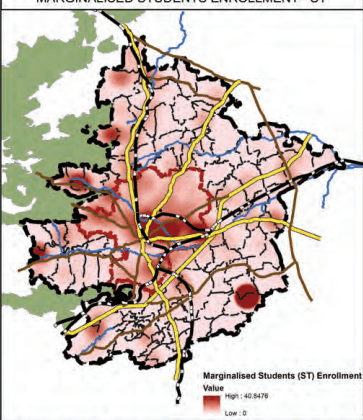
Map 11.3: Heatmaps of Students Enrolment - Boys, Girls, and Marginalised Students in LPA
Heat Map of Distribution of Students Enrollment in Coimbatore LPA
11.2.3Student-Teacher Ratio in Coimbatore LPA
The student-Teacher Ratio (STR) across all school categories within the Coimbatore Local Planning Area (LPA) remains well within the prescribed normative limits between 20 to 25, with no category exceeding the recommended benchmarks as shown in the Table 11.5. This reflects an adequate deployment of teaching personnel, thereby supporting the effective delivery of quality education at all levels.
Table 11.5Students - Teachers Ratio in Schools of Coimbatore LPA
School Category
Students Enrollment
Teaching Staffs
Student Teachers Ratio
As per Norms
High School
47898
2199
21.78
30:1(as per RMSA framework)35:1(as per RTE Act 2009)
Hr. Sec. School
344339
13607
25.30
Middle School
35799
1707
20.97
Primary School
53456
2362
22.63
30:1(as per RTE Act 2009)
Pre-Primary School
975
40
24.37
11.2.4Differently Abled Schools and CWSN Schools in Coimbatore LPA
Sustainable Development Goal (SDG) 4 emphasizes inclusive and equitable quality education for all, including children with disabilities.
The higher number of special schools for the differently abled/ Children With Special Needs (CWSN) within Coimbatore Corporation reflects the city’s commitment to this goal, highlighting its efforts toward fostering an inclusive and equitable urban environment.
There are 14 special schools for differently abled students, with the majority (11) located within Coimbatore Corporation, all managed by un-aided institutions. The remaining three schools are located in Gudalur Municipality, Perur Town Panchayat, and Narasimhanaickenpalayam Town Panchayat, with only the Perur school being government-run.
Table 11.6Special Schools for Differently Abled Students/Children With Special Needs (CWSN)
Administration Area
Number
Management
Coimbatore Corporation
11
Un-aided
Gudalur Municipality
1
Un-aided
Perur TP
1
Government
Narasimhanaickenpalayam TP
1
Un-aided
11.2.4.1 Comparison of CWSN/Differently Abled Students in Mainstream vs CWSN Schools in LPA
Out of 2,674 CWSN students in Coimbatore LPA, 83.7% are in mainstream schools, reflecting strong inclusion efforts, especially at the Higher Secondary (824) and Middle School (519) levels. Special schools primarily serve CWSN in Primary (61) and Middle (236) levels, indicating early identification and targeted support.
Table 11.7Comparison of CWSN/Differently Abled Students in Mainstream and Special Schools
Category
CWSN/Differently abled students in Mainstream Schools
CWSN/ Differently abled students in Special Schools
High Schools (I-X)
3
71
High Schools (VI-X)
391
0
Hr.Sec School (I-XII)
20
68
Hr.Sec School (VI-XII)
824
0
Middle School (I-VIII)
509
236
Middle School (VI-VIII)
10
0
Pre-Primary & Primary Only (I-V)
481
61
Grand Total
2238
436
Map 11.4: Heat Map of CWSN Students Enrolment in Coimbatore LPA
HEAT MAP OF CWSN STUDENT ENROLLMENT IN COIMBATORE LPA
11.2.4.2 Management of CWSN/Differently Abled Students Composition in Schools in LPA
The analysis of school enrolment data in Coimbatore reveals notable disparities in the inclusion of Children With Special Needs (CWSN) across school types and areas. Government schools have the highest inclusion rate (1.68%), followed by fully aided (1.24%) and partially aided schools (0.74%), while the number of children reported in the Central Government and unaided schools are nil. Geographically, Schools in Town Panchayats have higher enrolments in CWSN / DA Students (0.62%) as compared to the schools in the Corporation(0.44%), Revenue Villages (0.46%), and Municipalities (0.38%).
Table 11.8Management wise CWSN/Differently Abled Students Composition in Schools in LPA
School Type
Schools
Students
CWSN Students
% of CWSN students in Schools
Central Govt
4
6,755
0
0%
Fully Aided
83
20,650
255
1.24%
Government
538
104,545
1,754
1.68%
Partially Aided
32
31,087
229
0.74%
Un-aided
515
319,430
0
0%
Table 11.9Area wise CWSN/Differently Abled Students in Schools in LPA
Area
Schools
Students
CWSN Students
CWSN Students% in Area
Corporation
572
286,843
1,248
0.44%
Municipality
70
29,888
115
0.38%
Revenue Villages
343
97,320
448
0.46%
Town Panchayats
187
68,416
427
0.62%
11.2.4.3 Type of Disability among CWSN students in LPA
The Coimbatore LPA reports 2,238 Children With Special Needs (CWSN), with Intellectual Disability being the most prevalent at 58.6%. This highlights the urgent need for trained special educators, individualized learning plans, and cognitive-supportive infrastructure in both mainstream and special schools. Hearing and Locomotor Impairments each account for 7.4%, emphasizing the importance of assistive devices, accessible school design, and inclusive teaching methods. Other significant disabilities include Autism (6.7%), Multiple Disabilities (5.8%), and Specific Learning Disabilities (3.1%), all of which require multidisciplinary support. This indicates the need to focus on inclusive school infrastructure.
Table 11.10Type of Disability among CWSN students in LPA
Types of Disability
Students Count
Students Proportion
Autism
149
6.66%
Cerebral Palsy
76
3.40%
Chronic Neurological conditions
2
0.09%
Dwarfism
0
0.00%
Hearing Impairment
166
7.42%
Hemophilia
1
0.04%
Intellectual Disability
1311
58.58%
Locomotor Impairment/Handicap
166
7.42%
Mental Illness
4
0.18%
Multiple disability
129
5.76%
Muscular dystrophy
51
2.28%
Parkinsons disease
2
0.09%
Sickle cell disease
0
0.00%
Specific Learning disability
69
3.08%
Speech Impairment
0
0.00%
Thalassemia
10
0.45%
Visual Impairment (Blindness)
41
1.83%
Visual Impairment (Low-vision)
61
2.73%
Grand Total
2238
100.00%
11.2.5Adi Dravidar Department Schools
As per Census 2011, the Scheduled Caste (SC) population constitutes approximately 12.7% of the total population in Coimbatore District. The SC population is predominantly concentrated within the limits of the Coimbatore Municipal Corporation, while areas outside the Corporation exhibit relatively lower concentrations.
At present, all Adi Dravidar Department-run schools in the district—totaling sixteen (16)—are situated outside the boundaries of the Local Planning Area (LPA). Despite this, the educational needs of the SC population within the Corporation limits are being effectively met by the existing schools. These schools cater to the concentration of SC student enrollment within the city, as observed in Map 11.3, ensuring access to education for marginalised communities in the urban area.
11.2.6 Tribal Welfare Department Schools
Out of the 16 Tribal Welfare Department-run Schools in Coimbatore District, only 2 are located within the Local Planning Area (LPA) — one each in No.24 Veerapandi Part and Nayakkanpalayam Revenue Villages with a total student enrolment of 52.
Table 11.11Tribal Welfare Department Run school details in Coimbatore LPA
Administration
Number
Students Enrollment
No.24 Veerapandi Part
1
5
Nayakkanpalayam
1
47
11.2.7Spatial Coverage Analysis of Schools in Coimbatore LPA
The spatial coverage analysis of schools in the Coimbatore LPA is guided by the norms set under the Tamil Nadu Education School Policy as listed in the following Table. These norms aim to ensure equitable distribution of educational facilities and reduce travel burden on students.
Table 11.12Norms for Spatial Coverage Analysis for Schools as per TN Education School Policy
Type of institution
Distance (KM)
Primary
1 Km
Secondary
5 Km
Higher Secondary
8 Km
Source: Tamil Nadu Education School Policy
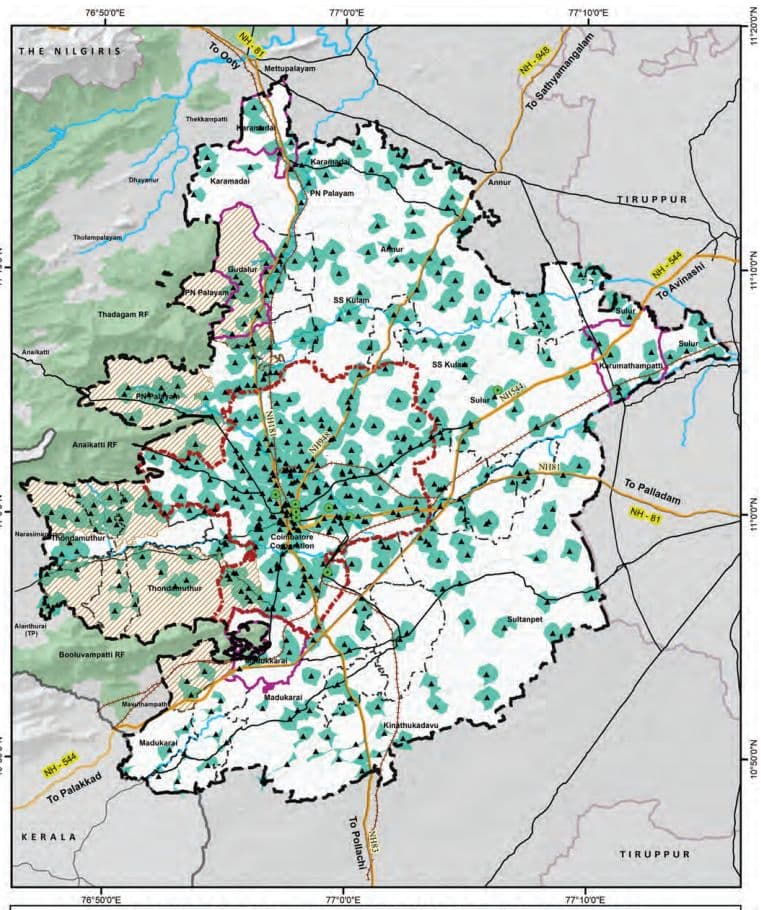
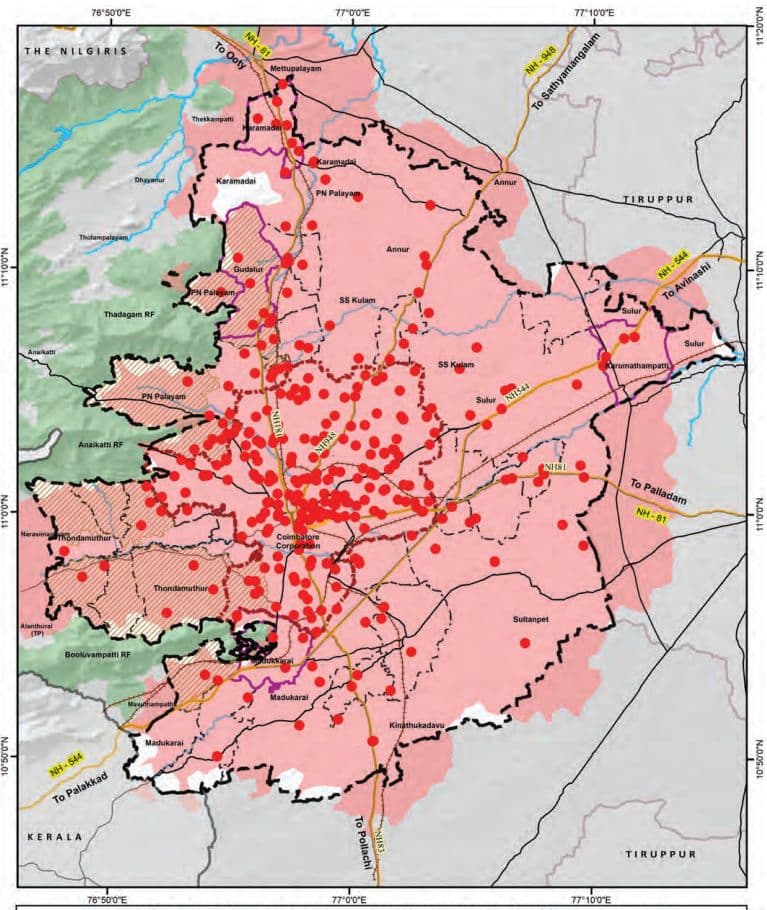
Map 11.5: Pre-Primary and Primary Schools Service Coverage Area (1km)
PRE-PRIMARY AND PRIMARY SCHOOL SERVICE AREA - 1KM
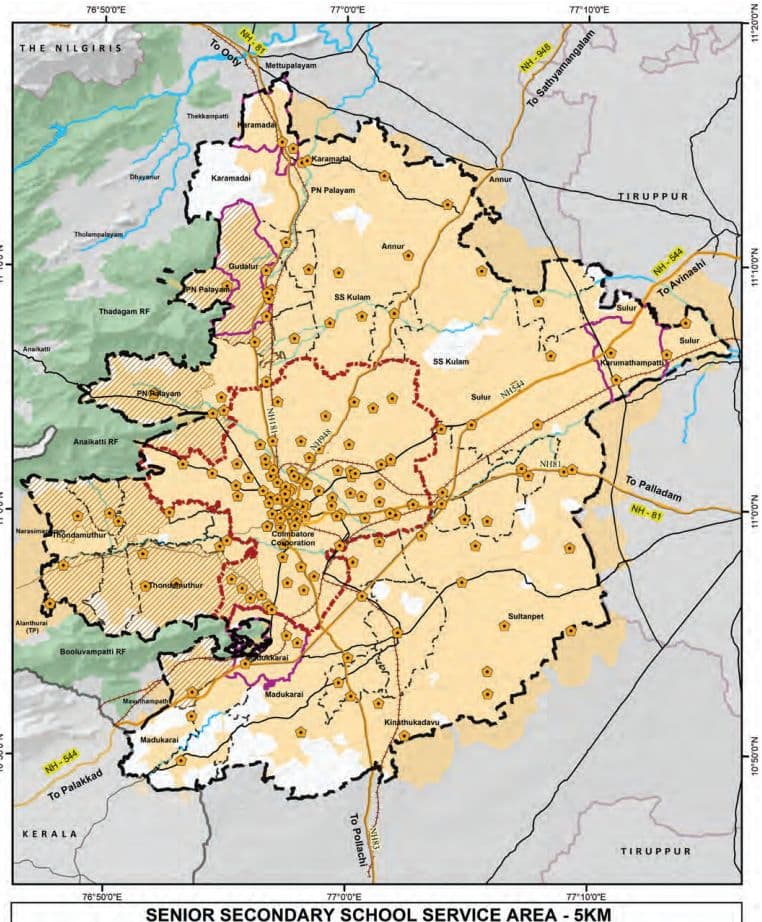
Map 11.6: Senior Schools Service Coverage Area (5km)
Map 11.7: Higher Secondary Schools Service Coverage Area (8km)
INTEGRATED HIGHER SECONDARY SCHOOL SERVICE AREA - 8KM
It is observed that the spatial service coverage for primary and pre-primary schools adequately encompasses the areas within the Coimbatore Corporation limits. However, regions outside the Corporation boundary, within the LPA region, exhibit relatively lower levels of coverage.
In contrast, over 90% of the Coimbatore LPA is spatially well-served by secondary and higher secondary schools, indicating a wider distribution of institutions catering to higher levels of education across the planning area.
11.2.8Projection and Gaps
The URDPFI Guidelines provide population-based thresholds for different categories of educational institutions, as presented in the below table. These benchmarks serve as a planning tool to assess the adequacy of existing educational infrastructure within a region.
Table 11.13URDPFI Guidelines with Population Threshold for the School Institutions
URDPFI Category
Threshold Populations
Pre-primary, Nursery School
2500
Primary School (I-V)
5000
Senior Secondary (VI-XII)
7500
Integrated School without hostel facility (I-XII)
90000 - 1 lakh
Integrated School with hostel facility (I-XII)
90000 - 1 lakh
Source: URDPFI
The total number of schools in each category has been derived by aggregating institutions with overlapping class ranges in accordance with URDPFI guidelines. As several schools offer multiple levels of education, the figures reflect overlaps, although the actual number of schools within the LPA is 1,172.
Table 11.14URDPFI norms -Catagory wise existing school institutions in LPA
URDPFI Category
Category of School Education
No. of Schools In Coimbatore LPA
Total No. of Schools in Coimbatore LPA
Pre-primary, Nursery School
Nursery Only (PrkG-UKG)
8
141
Nursery & Primary (Pre-KG-V)
133
Primary School (I-V)
Primary Only (I-V)
368
664
Nursery & Primary (Pre-KG-V)
133
Middle School (I-VIII)
163
Senior Secondary (VI-XII)
High Schools (VI-X)
67
170
Hr. Sec School (IX-XII)
1
Hr. Sec School (VI-XII)
98
Middle School (VI-VIII)
4
Integrated School without hostel facility (I-XII)
Hr. Sec School (I-XII)
249
318
High Schools (I-X)
69
As per the Projections in the following section, it is observed that:
Senior Secondary Schools (VI–XII): There would be additional requirement of 358 institutions by 2041,for which the space requirement would be 6.46 sq.km (as per URDPFI norms). The number of additional schools assessed to be provided by 2041, inthe Corporation is 271 school and 24 Schools and 18 Schools in the high growth blocks of PN Palayam and Sulur
Primary Schools (I–V): There would be an additional requirement of 316 primary schools by 2041 requiring an additional area of 1.26 sq. A Substancial part of the additional requirement would be in core urban areas.
Integrated Schools without hostel facilities (I–XII) show surplus availability for the 2041.
Table 11.15Projections and Gap analysis for the School Education Institutions in Coimbatore LPA as per URDPFI norms
Gaps
Gap in Schools 2021
Gap in Schools 2031
Gap in Schools 2041
Pop.2021
Primary School (I -V)
Senior Secondary (VI -XI I)
Inte-grated School without hostel facility (I -XI I)
Pop.2031
Primary School (I -V)
Senior Secondary (VI -XI I)
Inte-grated School without hostel facility (I -XI I)
Pop.2041
Primary School (I -V)
Senior Secondary (VI -XI I)
Inte-grated School without hostel facility (I -XI I)
Corporation
20,51 ,71 9
-
-24
-
27,64,842
-78
-1 1 9
-
39,03,784
-306
-271
-
M unicipal ity
1 ,82,262
-
-
2,36,449
-
-5
-
3,05,996
-3
-1 5
-
Town Panchayats
3,73,063
-
-5
-
4,59,1 88
-
-1 2
-
5,67,685
-3
-1 9
-
Annur Block
50,1 83
3 1
1
4
58,1 1 5
29
0
4
67,51 8
27
-1
4
Karamadai Block
23,784
1 5
2
4
28,728
1 4
1
4
34,773
1 3
0
4
Kinathukadavu Block
25,762
8
0
2
3 1 ,727
7
-1
2
39,204
5
-2
2
Madukarai Block
58,01 0
25
1
5
79,61 0
21
-2
5
1 ,1 3,727
1 4
-6
5
PN Palayam Block
1 ,47,01 1
38
3
23
2,21 ,1 34
23
-6
22
3,49,51 4
-3
-24
21
SS ku lam Block
11.3 Higher Education in Coimbatore LPA
By 2041, Coimbatore LPA will require approximately 7.73 sq.km of additional land to meet the additional schools indicated above. The projections highlight a pressing need for strategic land allocation and infrastructure augmentation, particularly for higher-level institutions, to accommodate the growing population and ensure equitable access to education.
Table 11.16Additional Area Requirement for the Schools Education Institutions in LPA by 2041 - as per URDPFI norms
Area Requirement 2041 in Sq.km
Category
Primary School (I-V)
Senior Secondary (VI-XII)
Corporation
1.224
4.878
Municipality
0.012
0.27
Town Panchayats
0.012
0.342
Annur Block
N/A
0.018
Karamadai Block
N/A
N/A
Kinathukadavu Block
N/A
0.036
Madukarai Block
N/A
0.108
PN Palayam Block
0.012
0.432
SS kulam Block
N/A
N/A
Sultanpet Block
N/A
N/A
Sulur Block
0.004
0.324
Thondamuthur Block
N/A
0.054
Total Revenue Villages
0.016
0.972
Area Required in Total Coimbatore LPA
1.264
6.462
Tamil Nadu, India’s leader in Gross Enrolment Ratio (GER) for higher education, owes its success to a robust network of institutions that blend academic rigor with innovation. At the heart of this achievement lies Coimbatore, a cornerstone of South India’s educational landscape. Renowned as an industrial and intellectual hub, the city hosts a diverse array of state-owned universities and specialized institutes that have consistently ranked high in the National Institutional Ranking Framework (NIRF).
11.3.1Distribution of Higher Education Institutions in LPA
Coimbatore LPA host notable and specialized institutions such as Forest College and Research Institute (1916), Tamil Nadu Agricultural University (1971), Air Force Administrative college 1946, PSG College of Technology, Coimbatore Institute of Technology (CIT), Coimbatore Medical College, and the Government Law College.
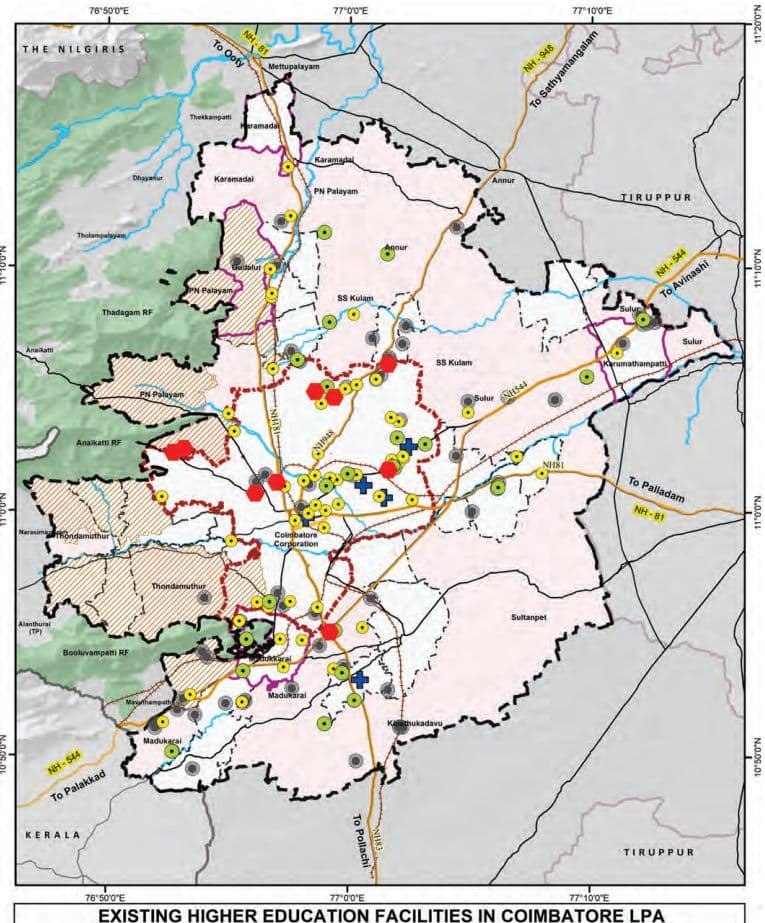
The distribution of higher education institutions is depicted in the Map 11.8. The Engineering institutions constituting 41% (73 of 180) of all institutions, with notable penetration in rural areas (25 in Revenue Villages), aligns with the region’s industrial potential. Arts & Science colleges area primarily located in the urban areas (36 out of 60 in the Corporation).
Table 11.17Category wise Distribution of Higher Education Institutions in LPA
Category
Corporation
Municipality
Town Panchayat
Revenue Villages
Total LPA
Engineering
19
6
23
25
73
Arts & Science
36
6
10
8
60
Polytechnic
8
3
4
8
23
Medical Institute
4
0
1
0
5
University
9
0
0
1
10
Others
0
0
0
9
9
Grand Total
76
15
38
51
180
Source: Directorate of Higher Education
Map 11.8: Existing Higher Education Facilities in Coimbatore LPA
11.3.2Projection and Gap analysis of Higher Education Institutions
Table 11.18URDPFI Norms for Population Threshold of Higher Education Institutions
URDPFI guideline
Services
Threshold population
Arts & Science College
1,25,000
Engineering college
10,00,000
Medical college
10,00,000
The following table presents the gap analysis of higher education institutions within the Coimbatore Local Planning Area (LPA), based on the projected population growth for the years 2021, 2031, and 2041. The analysis, carried out in accordance with the URDPFI Guidelines, indicates a consistent surplus across most categories of higher education institutions, including engineering, medical, arts, and technical colleges. The existing infrastructure is adequate to meet the needs of the projected population.
Table 11.19Projections and Gap Analysis for the Higher Education Institutions in Coimbatore LPA as per URDPFI norms
Category
Existing Institution numbers
Estimated population - 2021(31,62,392)
Estimated population -2031(42,04,955)
Estimated population -2041(58,24,706)
Required
Surplus/Gap
Required
Surplus/Gap
Required
Surplus/Gap
Technical Education
25
3
22
4
21
6
19
Arts College
60
25
35
34
26
47
13
Engineering college
73
3
70
4
69
6
67
Medical college
5
3
2
4
1
6
-1
11.4
Existing Health
Care Facilities
However, by 2041, when the estimated population reaches approximately 58.24 lakh, the demand for medical colleges is projected to slightly exceed supply, resulting in a marginal deficit of one institution. Surpluses persist in other sectors, including technical (19 institutions), arts (13 institutions), and engineering (67 institutions). This trend suggests that while the existing higher education infrastructure remains largely adequate. To cater to the projected demand by 2041, the existing medical colleges will need to be expanded with additional capacity. Strategic planning should prioritize addressing potential gaps in medical education while maintaining optimal capacity across other disciplines to align with long-term educational needs.
Coimbatore Local Planning Area (LPA) hosts a wellstructured network of healthcare facilities catering to primary, secondary, and tertiary care needs. The system includes government and private institutions that provide a range of services—from preventive and basic healthcare to advanced medical and surgical treatments. Facilities are categorized based on their service levels, ensuring accessibility from rural sub-centres to urban multispecialty hospitals. They are categorised as follows:
Table 11.20Types of Health Care Facilities
Facility Name
Care Level
Typical Services / Basic Equipment
Health Sub-Centre (HSC / SC)
Primary Care
First contact point, maternal and child care, immunization, basic first aid, referrals
Primary Health Centre (PHC)
Primary Care
Outpatient care, maternity services, immunization, treatment of minor ailments, basic diagnostic support
Urban Primary Health Centre (UPHC)
Primary Care
OPD, maternal & child health, immunization, NCD screening, basic laboratory and pharmacy services
Community Health Centre (CHC)
Secondary Care
Emergency services, labour room, diagnostic services, minor surgeries, specialist consultations
Taluk Hospital / Sub-District Hospital (SDH)
Secondary Care
General OPD and IPD, maternity care, basic surgeries, diagnostics, referral services
ESI Hospital (Medical College)
Tertiary Care
Inpatient and specialist care, ICU, diagnostics, trauma care, medical education and training
Government Hospital (GH)
Tertiary Care
Multispecialty services, surgeries, ICU, blood bank, emergency care, diagnostics
District Hospital (DH)
Tertiary Care
Comprehensive care including trauma services, surgery, ICU, multi-specialty diagnostics and treatment
Multi-specialty Hospital (Private Sector)
Tertiary Care
Advanced diagnostics, critical care, specialized surgeries, multiple specialty departments
Source:IPHS
11.4.1Distribution of Health Care Facilities
Table 11.21Distribution of Health Care Facilities in Coimbatore LPA
Category
Corporation
Municipality
Town Panchayat
Revenue Villages
Total LPA
HSC
0
0
13
47
60
UPHC
34
0
0
0
34
PHC
0
2
9
4
15
CHC/ UGPHC
0
2
2
1
5
Taluk Hospital
1
1
1
2
5
Private MSH
8
0
0
0
8
Medical College Hospital
4
0
1
0
5
Grand Total
47
5
26
54
132
Source: Health Department, Coimbatore District
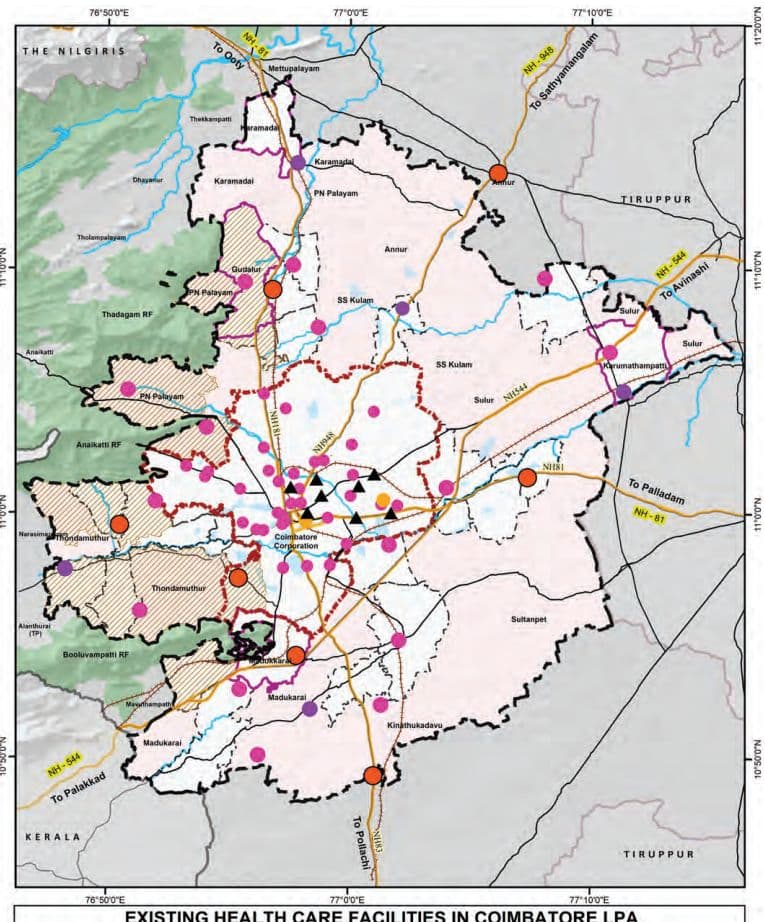
The distribution of healthcare facilities within the Coimbatore Local Planning Area (LPA) reflects a tiered system suited to the area’s urban and rural needs, with a total of 132 institutions spread across Corporation, Municipality, Town Panchayat, and Village areas. Revenue Villages have the highest number of facilities (54), followed by the Corporation (47), Town Panchayats (26), and Municipalities (5).
In the Corporation area there are with 34 Urban Primary Health Centres (UPHCs), 8 Private Multi-Specialty Hospitals, 1 Taluk Hospital and 2 Medical College Hospitals. These facilities cater to specialized and tertiary care.
Municipalities have a total of 5 healthcare institutions: 2 Primary Health Centres (PHCs), 2 Community Health Centres/Upgraded PHCs (CHC/UGPHCs), and 1 Taluk Hospital.
Town Panchayats have 13 HSCs, 9 PHCs, 2 CHC/UGPHCs, and 1 Taluk Hospitals, indicating a structured approach to primary and referral care in semi-urban areas.
Revenue Villages are primarily served by 47 HSCs, along with 4 PHCs, 1 CHC/UGPHC, and 2 Taluk Hospitals
34,520
1 8
2
5
39,984
1 7
2
5
46,338
1 6
1
5
Su ltanpet Block
27,250
1 3
1
2
30,466
1 2
1
2
34,1 48
1 1
0
2
Su lur Block
1 ,36,1 64
3 1
3
1 1
1 ,94,073
1 9
-5
1 0
2,93,363
-1
-1 8
9
Thondamuthur Block
52,664
1 0
-1
3
60,640
9
-2
3
68,656
7
-3
3
Total Revenue Vi l lages
555,347
-
-1
-
744,476
-
-1 6
-
1 ,047,241
-4
-54
-
Total Gap assessed in Coimbatore LPA
3 1 ,62,392
-
-30
-
42,04,955
-78
-1 52
-
58,24,706
-3 1 6
-358
-
Map 11.9: Existing Health Care Facilities in Coimbatore LPA
EXISTING HEALTH CARE FACILITIES IN COIMBATORE LPA
(located near the LPA boundary), showing a strong foundation in basic healthcare delivery and referral care.
Overall, the distribution ensures wide coverage of primary care in rural and semi-urban areas, while advanced and private healthcare services are concentrated in the urban areas.
11.4.1.1 Mental Health Care Units
Coimbatore has a well-established network of mental healthcare services, predominantly offered through private clinics, multi-speciality hospitals, and specialized rehabilitation centres. These facilities provide a range of services including psychiatric consultation, counselling, therapy, and long-term care, contributing significantly to the city’s mental health ecosystem. The presence of experienced mental health professionals and diverse treatment options across the private sector ensures that residents have access to quality care.
Map 11.10: Mental Health Care Facilities in Coimbatore LPA
EXISTING MENTAL HEALTH CARE FACILITIES IN COIMBATORE LPA
11.4.2Golden Hour Access -Health Facilities Service Coverage Analysis
The concept of the “Golden Hour” represents the critical first sixty minutes following a traumatic injury, during which timely medical intervention significantly enhances the chances of survival and reduces the risk of long-term complications. Within this timeframe, the ability to provide rapid on-site stabilization and swift transportation to a trauma care center is essential.
Access Time: While the full “golden hour” encompasses 60 minutes, studies and emergency response protocols indicate that the first 10 following an incident are especially vital for determining outcomes. In a practical scenario, however, the time taken for an ambulance to reach the site of injury and few additional time may be required to transport the patient from the site to the trauma care facility. This time taken is also depending on various factors such as terrain, traffic, and resource availability.
However, the travel time coverage modeled in this analysis is intended to represent a conservative estimate of the outbound journey, effectively accounting for a total response window of approximately 20 to 25 minutes. This approach enables the identification of areas where a patient can reasonably be reached and transported to a trauma care center within the “golden hour” framework, accounting for both directions of travel.
Coimbatore has witnessed significant growth in road infrastructure, vehicular movement, and population density. With this rapid growth comes an increased risk of road traffic accidents and associated trauma. In such a context, assessing the spatial distribution of trauma care accessibility within this practical response window becomes imperative to inform health system strengthening, infrastructure investment, and emergency preparedness planning.
11.4.2.1 Network Analysis - for the Health Care Service Coverage Analysis:
The network study is designed to identify Revenue Villages and urban areas that fall within this access zone, as well as those that remain underserved. The analysis was conducted using GIS, OpenRouteService (ORS) Tool, and Open Street Map (OSM), considering the road network.
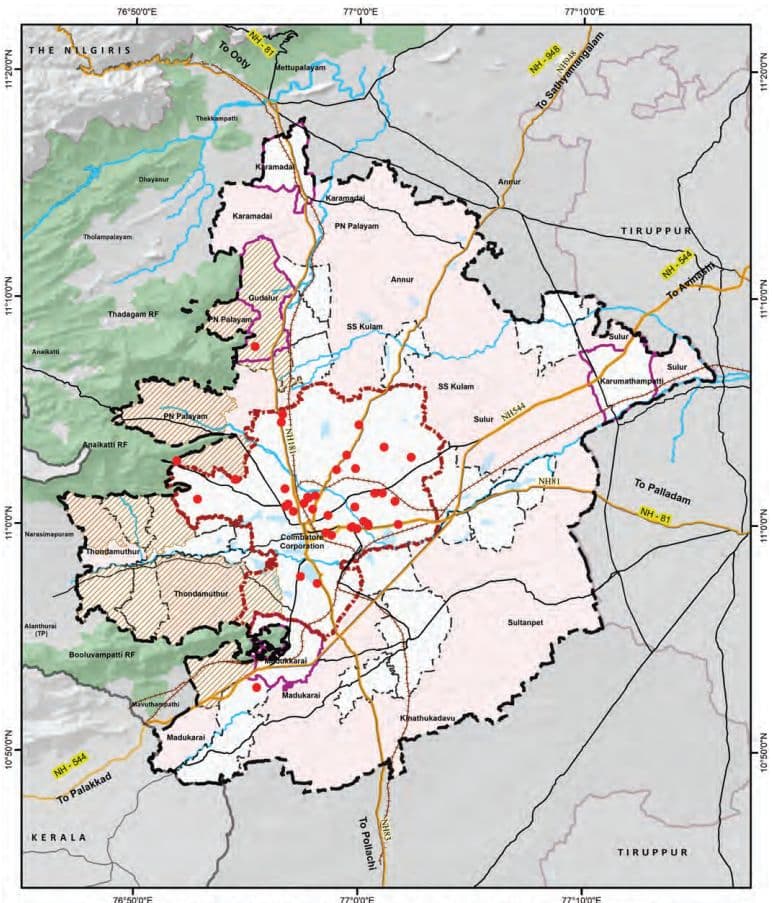
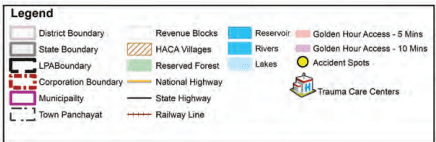
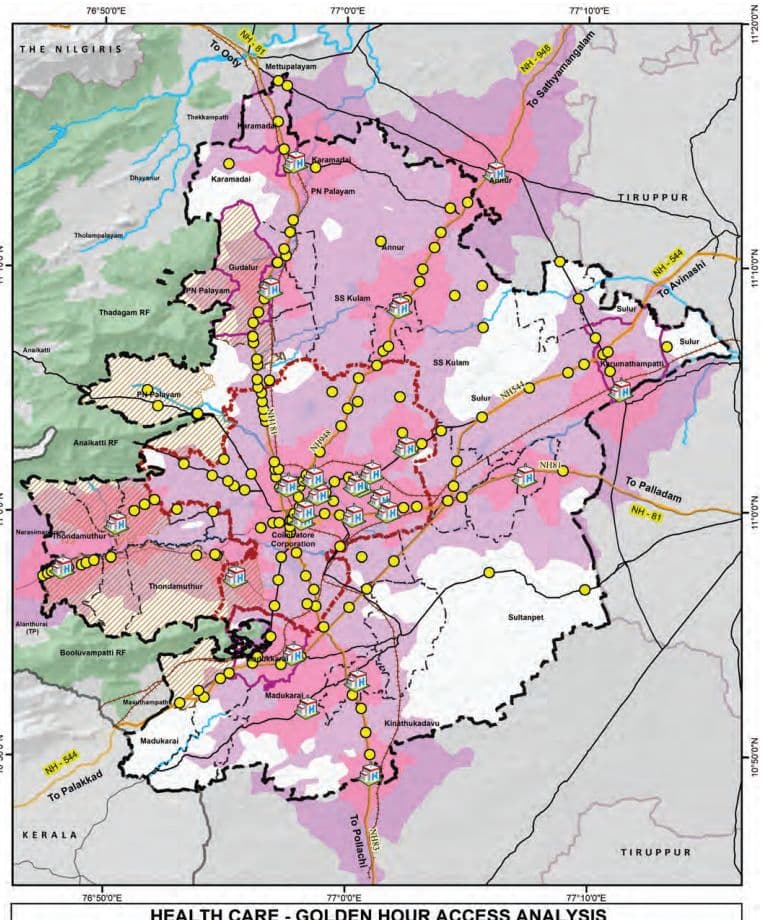
Map 11.11: Golden Hour Coverage Analysis (5-10 mins coverage)
HEALTH CARE - GOLDEN HOUR ACCESS ANALYSIS
Network Analysis Inference: The analysis of trauma care accessibility in Coimbatore LPA reveals significant spatial disparity between urban and rural regions.
• Urban areas such as the Coimbatore Municipal Corporation exhibit a high level of emergency service coverage, with approximately 95% of the area falling within the golden hour access zone.
Similarly, municipalities and town panchayats show substantial coverage levels of 85% and 81% respectively, reflecting relatively well-established road networks and proximity to health facilities.
• The Revenue Villages demonstrate a notably lower coverage of approximately 60%, indicating critical gaps in trauma care accessibility.
Around 11 Revenue Villages fall entirely outside the golden hour zone, with 0% coverage, highlighting their vulnerability in emergency situations. These include: Bogampatti, Chinnathadagam, Idayar palayam, Kallapalayam, Nanjundapuram, Naranapuram, No.24 Veerapandi Part, Pappampatti, Pichanur, Selakkarichel, and Panapatti
In addition, a few Revenue Villages have partial coverage (less than 25%) but remain significantly underserved: Pannimadai – 5%, Mylampatti – 9%, Semmandampalayam – 11%, Somayampalayam – 12%, Pachapalayam – 14% and Pottaayandipurambu – 24%.
These findings underscore the urgent need for targeted interventions in rural areas, such as enhancing road connectivity, deploying decentralized trauma response units, and expanding emergency medical infrastructure. Addressing these accessibility gaps is vital to strengthening the health care delivery system across the entire planning area and ensuring equitable health outcomes for both urban and rural populations.
11.4.3Spatial Coverage Analysis for the Health Care Facilities
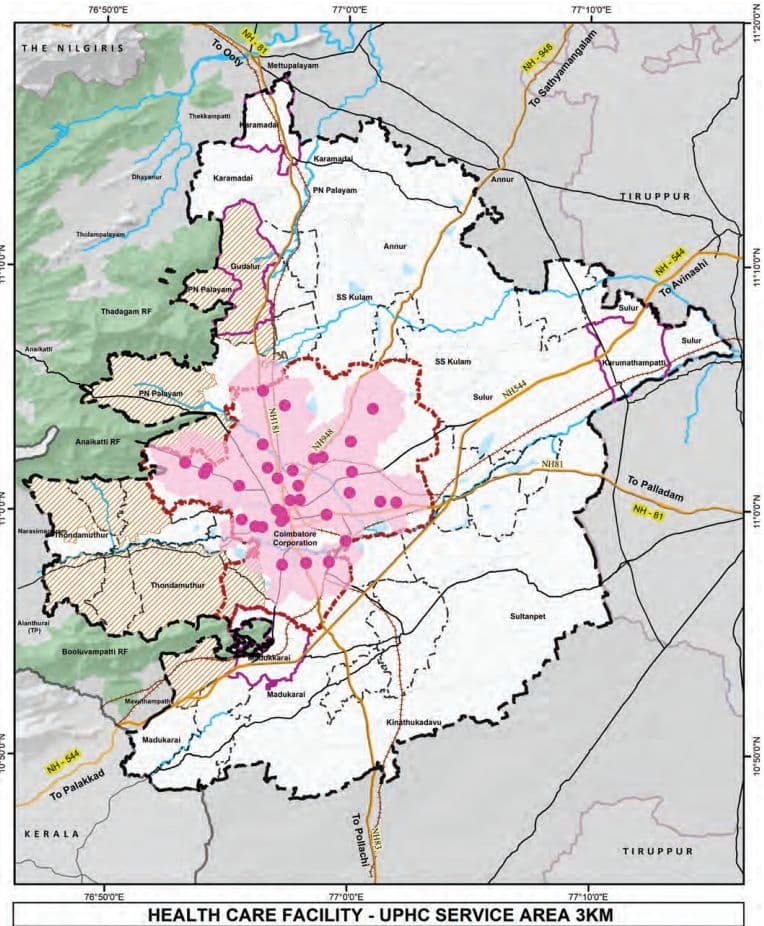
It is observed that the healthcare service coverage analysis for Coimbatore LPA reveals significant disparities in accessibility across different regions. Within the Coimbatore Corporation limits, Urban Primary Health Centers (UPHCs)
Map 11.12: Service Coverage Analysis for UPHC facilities (3Km)
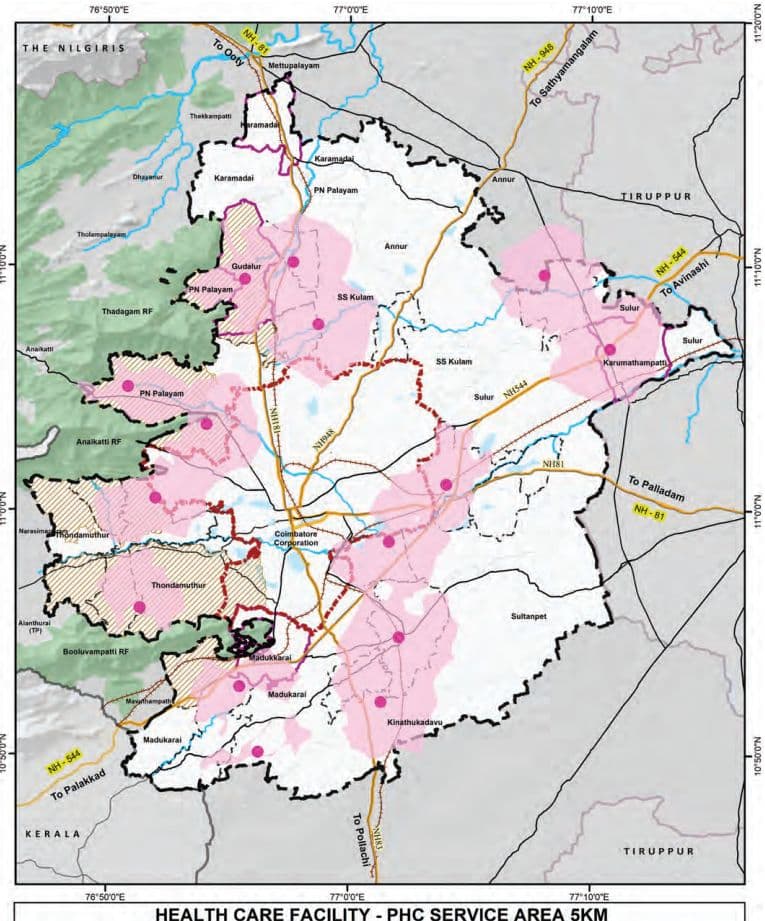
Map 11.13: Service Coverage Analysis for PHC facilities (5Km)
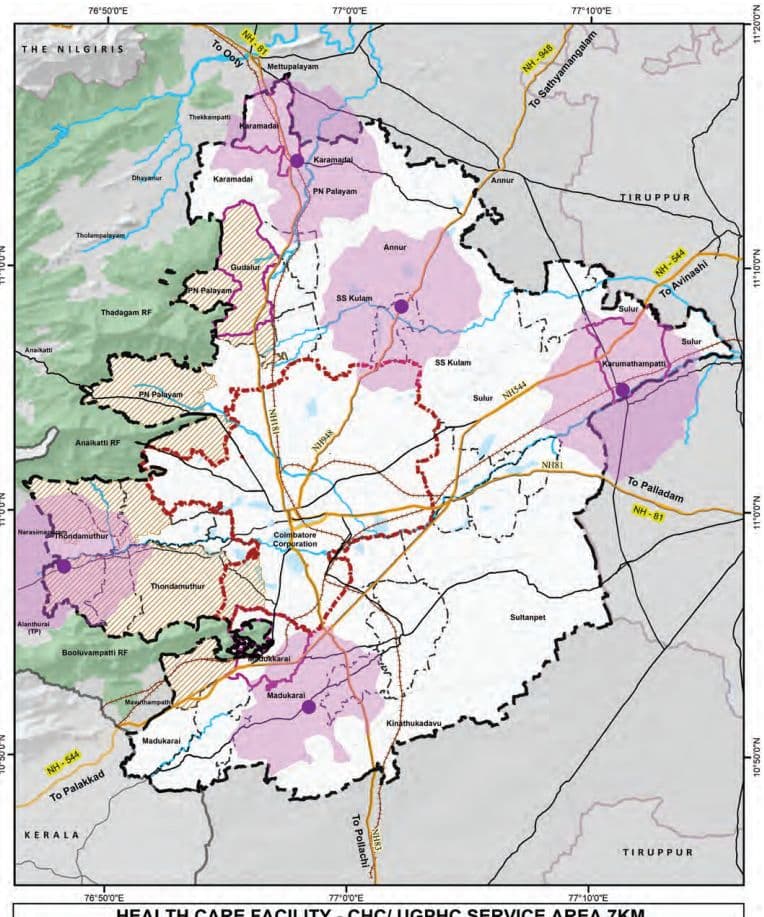
Map 11.14: Service Coverage Analysis for UPHC facilities (7Km)
HEALTH CARE FACILITY - CHC/ UGPHC SERVICE AREA 7KM
provide nearly complete coverage, ensuring adequate primary healthcare services for urban residents.
However, in rural areas, Primary Health Centers (PHCs) are predominantly located along major transportation corridors, leaving many interior Revenue Villages with limited access to basic medical care. For secondary healthcare needs, Community Health Centers (CHCs) and Upgraded PHCs, in the northern and southern parts of the LPA offer sufficient coverage.
A concerning gap exists in the eastern region, which lacks both primary and secondary healthcare facilities, creating a significant service void for the local population. This imbalance highlights the urgent need for strategic expansion of healthcare infrastructure, particularly in the underserved eastern rural areas.
11.4.4Distribution of Beds in Hospitals
As per the Indian Public Health Standards (IPHS) guidelines, essential beds refer to the minimum required inpatient beds provided in public health facilities. These facilities form the backbone of the public healthcare delivery system, focusing on accessible and affordable primary and secondary healthcare. The desirable beds are those available over and above the essential bed count in all facilities, including the advanced and tertiary care facilities. While not mandated under IPHS, desirable beds are critical for addressing complex health needs and emergencies and play a vital role in comprehensive healthcare provisioning in urban areas.
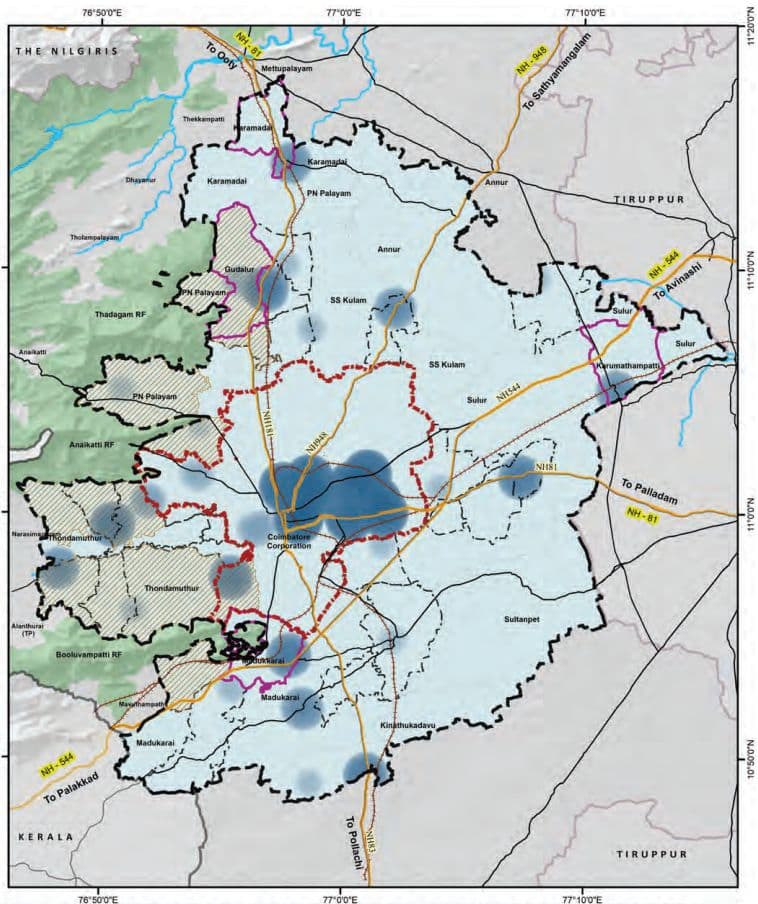
Map 11.15: Heat Map of Health Care Facilities -Beds in Coimbatore LPA
HEAT MAP OF NUMBER OF HEALTH CARE BEDS IN COIMBATORE LPA
Table 11.22Distribution of Hospital Beds in Coimbatore LPA
Category
Corporation
Municipality
Town Panchayat
Revenue Villages
Total LPA
Essential Beds
HSC
-
-
13
52
65
UPHC
49
-
-
-
49
PHC
-
10
54
13
77
CHC/ UGPHC
-
60
60
30
150
Taluk Hospital
50
60
183
-
293
Total (Essential beds)
99
130
310
95
634
Desirable Beds
Private MSH
2400
-
-
-
2400
Medical College Hospital
600
-
-
-
600
Total
3000
0
0
0
3000
Grand Total (Desirable Beds)
3099
130
310
95
3634
The distribution of hospital beds within the Coimbatore Local Planning Area (LPA) highlights the natural healthcare hierarchy that supports the needs of both urban and rural populations. Advanced tertiary healthcare facilities—comprising private multi-specialty hospitals and medical college hospitals—are primarily concentrated within the Corporation limits, accounting for approximately 3,000 of the total 3,634 beds, ensuring high-quality medical services at the urban core. At the same time, essential healthcare infrastructure, including Primary Health Centres (PHCs), Community Health Centres (CHCs), and Taluk Hospitals, is well-represented across Town Panchayats, contributing to broad and inclusive service coverage.
11.4.5 Projections and Gaps of Health Care Facilities in Coimbatore LPA Table 11.23: Indian Public Health Service Guidelines for the Health care Facilities
IPHS guideline
Services
Population per Unit
Bed Norms
HSC
5,000
Essential bed norms: 1 bed for 1000 people Desirable bed norms: 2 bed for 1000 people
UPHC (Urban)
50,000
PHC
30,000
UGPHC/ CHC (Rural)
1,20,000
Taluk / Sub-District Hospital
10 lakh
District Hospital
1 DH per District
According to the Indian Public Health Standards (IPHS) 2022 guidelines, in alignment with the National Health Policy, 2017, the recommended provision of hospital beds is based on a norm of one bed per 1,000 population as an essential requirement, with two beds per 1,000 population as the desirable target to strengthen the public healthcare delivery system.
The essential number of hospital beds is to be met exclusively through infrastructure available under the public sector, including Primary Health Centres (PHCs), Health Sub-Centers (HSCs), Community Health Centres (CHCs), Sub-District Hospitals (SDH) or Taluk Level Hospitals, and District Hospitals (DH). It is also explicitly stated that beds available in tertiary care institutions such as Medical College Hospitals shall not be included in the calculation of essential bed requirements but in the desirable bed count, as such institutions serve a wider catchment area beyond a single district.
Similarly, beds available in private healthcare facilities, including private multi-specialty hospitals, are excluded from the calculation of essential public sector capacity. However, in the context of achieving the desirable norm, the contribution of the private sector and other institutional healthcare providers—such as those operated by the Railways, Armed Forces, Employees’ State Insurance (ESI), and Public Sector Undertakings (PSUs)—may be
considered, particularly in regions where these facilities provide accessible and functional inpatient care for more than 24 hours.
These norms ensures that the public healthcare system is independently capable of meeting the minimum inpatient care needs of the district population, irrespective of the availability of tertiary or private healthcare infrastructure.
Table 11.24Projections – Healthcare Facilities in Coimbatore LPA
Gaps
Health Care Facilities 2021
Health Care Facilities 2031
Health Care Facilities 2041
Area Requirement 2041 (in Sq.Km)
Population 2021
UPHC / PHC
CHC / UGPHC
Population 2031
UPHC / PHC
CHC / UGPHC
Population 2041
UPHC / PHC
CHC / UGPHC
UPHC / PHC
CHC / UGPHC
Corporation
20,51,719
-7
0
27,64,842
-21
0
39,03,784
-44
0
0.088
0
Municipality
1,82,262
-2
0
2,36,449
-2
0
3,05,996
-4
-2
0.008
0.006
Town Panchayats
3,73,063
-6
0
4,59,188
-9
0
5,67,685
-12
2
0.026
0
Annur Block
50,183
-2
0
58,115
-2
0
67,518
-2
-1
0.004
0.003
Karamadai Block
23,784
-1
0
28,728
-1
0
34,773
-1
0
0.002
0
Kinathukadavu Block
25,762
-1
0
31,727
-1
0
39,204
-1
0
0.002
0
Madukarai Block
58,010
0
1
79,610
-1
0
1,13,727
-2
0
0.004
0
PN Palayam Block
1,47,011
-3
-1
2,21,134
-5
-2
3,49,514
-10
-3
0.02
0.009
SS kulam Block
34,520
-1
0
39,984
-1
0
46,338
-2
0
0.004
0
Sultanpet Block
27,250
-1
0
Table 11.25Projections - Healthcare Facilities (Taluk Hospitals) in Coimbatore LPA
Gap
Health Care Facilities 2021
Health Care Facilities2031
Health Care Facilities2041
Area Requirement by 2041 (in Sq. Km)
Population2021
Taluk Hospital
Population2031
Taluk Hospital
Population2041
Taluk Hospital
Annur Taluk
1 07284
1
1 25096
1
1 46273
1
0
Coimbatore (North) Taluk
71 7620
-1
1 1 77698
-1
2002386
-2
0.01
Coimbatore (South) Taluk
1 1 9 1 951
-1
1 3521 64
-1
1 5339 1 2
-2
0.01
Kinathukadavu Taluk
25762
1
3 1 727
1
39204
1
0
Madukkarai Taluk
500547
0
700283
0
993856
0
0
Mettupalayam Taluk
701 85
1
89953
1
1 1 5558
1
0
Perur Taluk
21 8903
1
283750
1
374461
1
0
Su lur Taluk
3301 41
1
444285
1
61 9055
0
0
Gap in Total Coimbatore LPA
3 1 ,62,392
-2
42,04,955
-2
58,24,706
-4
0.04
As per the projected population for the year 2041, Coimbatore Local Planning Area (LPA) is expected to require a significant addition in primary and secondary health facilitiesIn 2021, there was a deficit of 31 UPHCs/ PHCs and 2 CHCs/UGPHCs. By 2041, the required numbers of these facilities would increase to 91 and 7 respectively, to serve a projected population of 58.24 lakh. The Coimbatore Corporation area alone will require 44 additional UPHCs by 2041. For the additional health care facilities, a total area of 0.21 Sq.km is assessed.
Taluks such as Coimbatore North and South lacks taluk hospitals and hence these taluks will require taluk hospital to meet the growing demand. A cumulative area of 0.02 Sq.km will be required for these additional taluk hospitals, while others like Perur and Mettupalayam will be comparatively better equipped by 2041. This also indicates the requirement for substantial augmentation of primary and community-level healthcare facilities to meet the growing demand.
Table 11.26Demand and Gap Analysis of beds requirement for Overall LPA
Category
Existing Health facilities in Coimbatore LPA
Estimated population - 2021(31,62,392)
Estimated population -2031(42,04,955)
Estimated population - 2041(58,24,706)
Required
Surplus/Gap
Required
Surplus/Gap
Required
Surplus/Gap
Essential Beds
UPHC
634
553
81
613
21
726
-92
HSC & PHC
CHC/UGPHC
Taluk Hospital
Desirable Beds
UPHC
3000
700
2300
700
2300
700
2300
HSC & PHC
CHC/UGPHC
Taluk Hospital
Based on IPHS norms, Coimbatore will need a 100 essential bedded hospital by 2041, which is expected to be met through the proposed taluk hospitals.
The number of desirable beds available in private hospitals and medical colleges is in surplus of 2300 beds even for the projected demand of 2041.
In conclusion, bridging the projected gap in essential bed capacity while ensuring strategic utilization of the surplus desirable beds will be critical to achieving an inclusive, responsive, and resilient health system in Coimbatore LPA.
11.4.6 Veterinary Hospital Facilities
Table 11.27Existing and Projected Gap by 2041 - for the Veterinary Hospital Facilities
Taluk
Existing Veterinary Hospitals
Gap analysis of Veterinary Hospitals -(Deficit by 2041)
Population Threshold
1 unit per 50000 Population
Annur
1
1 (Surplus)
Coimbatore (North)
3
-1 (0.002 sq.km)
Coimbatore (South)
0
-3 (0.006 sq.km)
Kinathukadavu
0
0 (Surplus)
Madukkarai
1
-1 (0.002 sq.km)
Mettupalayam
0
0 (Surplus)
Perur
1
0 (Surplus)
Sulur
1
0 (Surplus)
Total Deficit
7
-5 (0.010 sq.km)
Source: TNGIS (Existing Data), URDPFI (Norms)
Map 11.16: Distribution of veterinary Hospitals in Coimbatore LPA
EXISTING VETERINARY HOSPITAL FACILITIES IN COIMBATORE LPA
11.5 Recreational Facilities
The existing Veterinary Hospital facilities are primarily concentrated along the three major roads namely Avinashi road, Sathy Road and Mettupalayam Road, leaving peripheral regions underserved.
A gap analysis of veterinary hospitals in the Coimbatore Local Planning Area (LPA), based on the URDPFI guideline of one veterinary hospital facility per 50,000 population, highlights a total deficit of 5 veterinary hospitals by 2041.
While Taluks such as Annur, Kinathukadavu, Mettupalayam, and Perur show adequate or surplus facilities, deficits are observed in few taluks namely: Coimbatore (North), Coimbatore (South), and Madukkarai, with Coimbatore (South) having the highest shortfall of three hospitals. Establishing additional veterinary hospitals in deficit areas is essential to meet future demand and ensure equitable access to animal healthcare services across the LPA.
The recreational facilities play a vital role in enhancing the quality of life and well-being of urban residents as well as offering a diverse range of recreational opportunities catering to various age groups and socio-economic segments. Coimbatore is endowed with a mix of natural, cultural, and built recreational assets, including parks, stadiums, sports complexes, cultural venues, informal gathering spaces, and lakes.