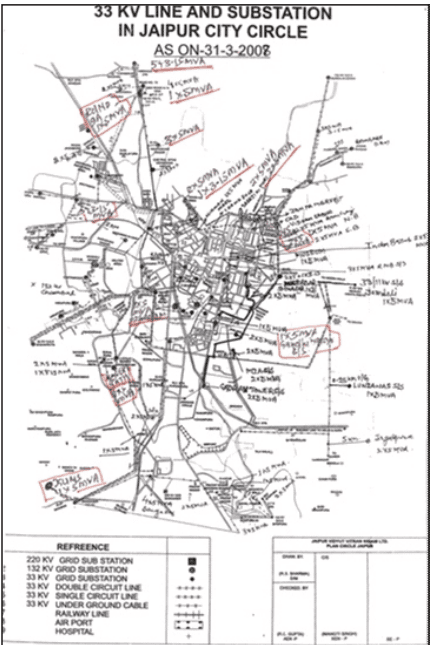
Power distribution of Jaipur City and it is environs by Jaipur Vidhyut Vitran Nigam Ltd. The existing city is having 220 KV, 132 kv and 33 kv grid substations and 33 kv double circuit line, single circuit line & underground cable.
In the entire city (the map enclosed) enumerate the distribution system in the existing city. Further, it is also proposed that as per the requirement looking into the future growth of the Zonal Development plans as and when prepared the the sites may be suggested for suitable locations after technical inputs from RVVNL for the Sub-stations. More reservation of facility area at scheme level present effective distribution system.
Map 2-20 Power Distribution in Jaipur city
2.13 Land uses in Master plan 2025
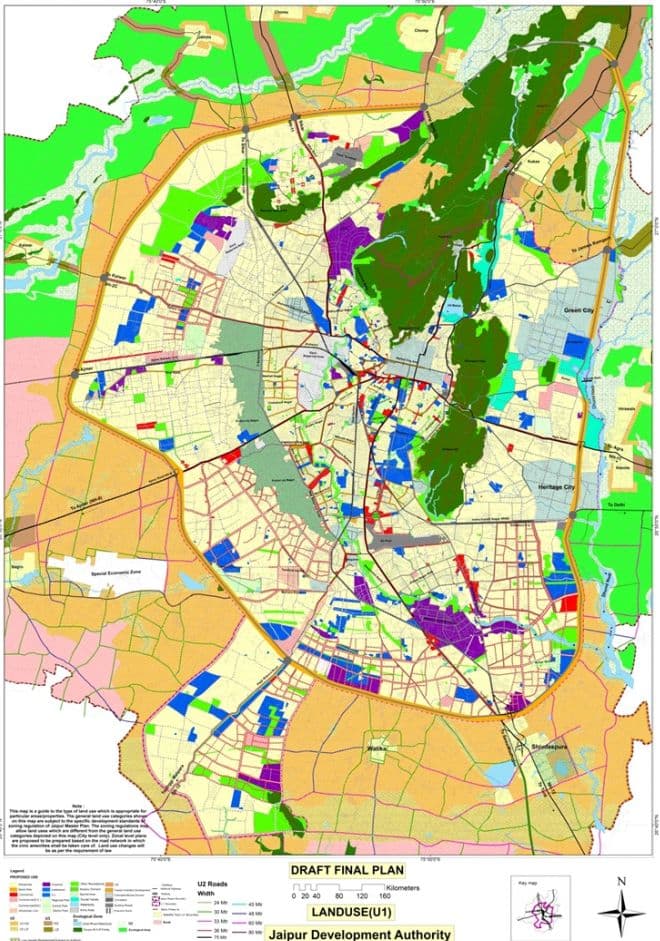
In order to reorient and redefining the system of change in land use the basic frame work of the urbanisable area is categorized with minimum number of major heads while defining the land use zoning in the urbanisable area. These are further supported by development controls and proposed development plans in reading the sub-heads use premises. The land use zoning was provided with major heads as mentioned below for the horizon Year 2025.
The following table enumerate the land use under each head provided for Jaipur
| Land use for U1 -2025 | |||
| S. No. | Use | Area (sq km) | Percentage |
| 1 | Residential | 457.46 | 48.39 |
| 2 | Commercial | 72.22 | 7.64 |
| 2.1 | Retail | 31.57 | 3.34 |
| 2.2 | DC | 6.22 | 0.66 |
| 2.3 | SCC | 0.50 | 0.05 |
| 2.4 | WC | 4.01 | 0.42 |
| 2.5 | Mixed | 29.58 | 3.13 |
| 2.6 | TOD | 0.33 | 0.03 |
| 3 | Public Semi Public | 52.00 | 5.50 |
| 4 | Govt Use | 0.44 | 0.05 |
| 5 | Army Area | 10.42 | 1.10 |
| 6 | Tourist Facility | 10.32 | 1.09 |
| 7 | Industry | 26.38 | 2.79 |
| 8 | Special Area | 70.36 | 7.44 |
| 9 | Circulation | 100.30 | 10.61 |
| 10 | Recreational | 62.99 | 6.66 |
| 11 | Nursery & Orchards | 0.33 | 0.03 |
| 11 | Water Bodies & Drain | 7.99 | 0.85 |
| 12 | Open Forest | 70.97 | 7.51 |
| 13 | Open Space | 0.35 | 0.04 |
| 14 | Ecological | 0.48 | 0.05 |
| 15 | U3 Area | 2.33 | 0.25 |
| Total | 945.34 | 100.00 | |
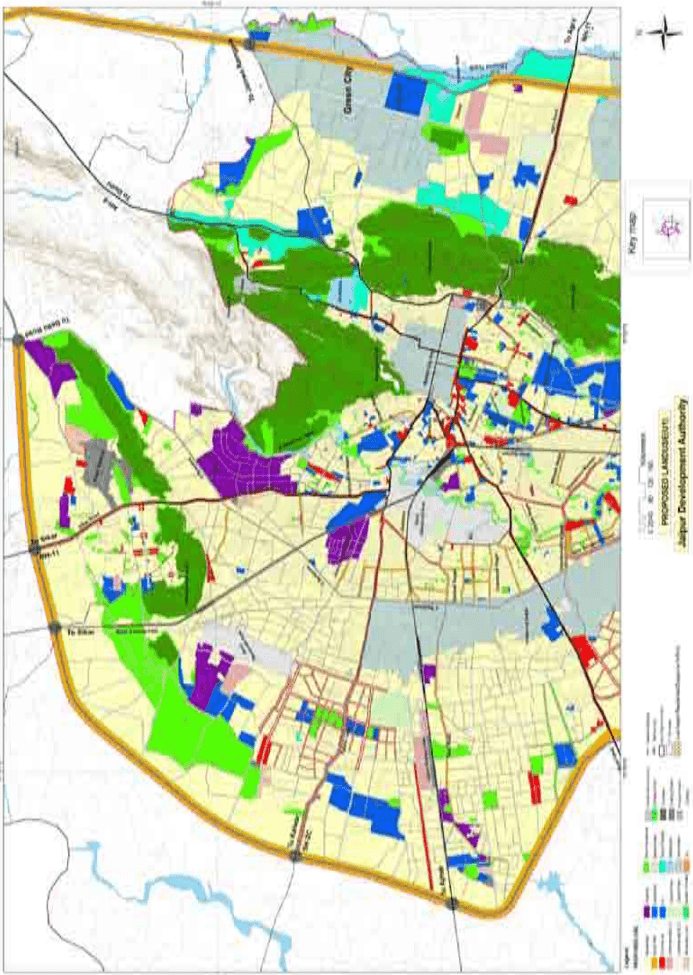
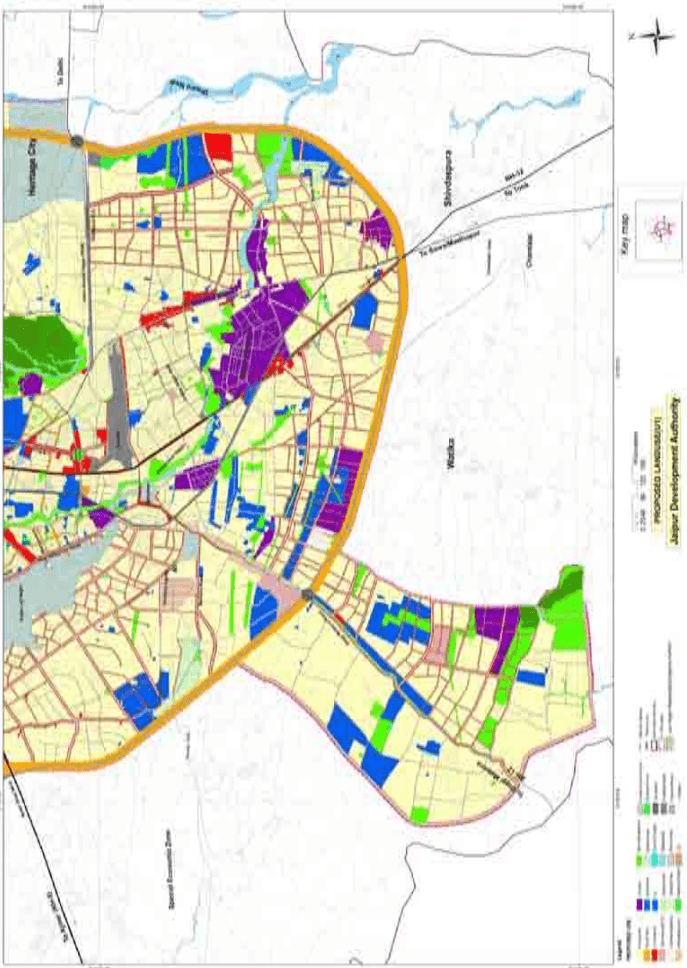
Map 2-21 land use plan-2025 for U1 area
CHAPTER
Quality of Life
Thought the level and quality of Infrastructure has been upgraded considerably, yet keeping the Importance of the Jaipur city, it is obligatory that the quality of life be brought at par with International standards.