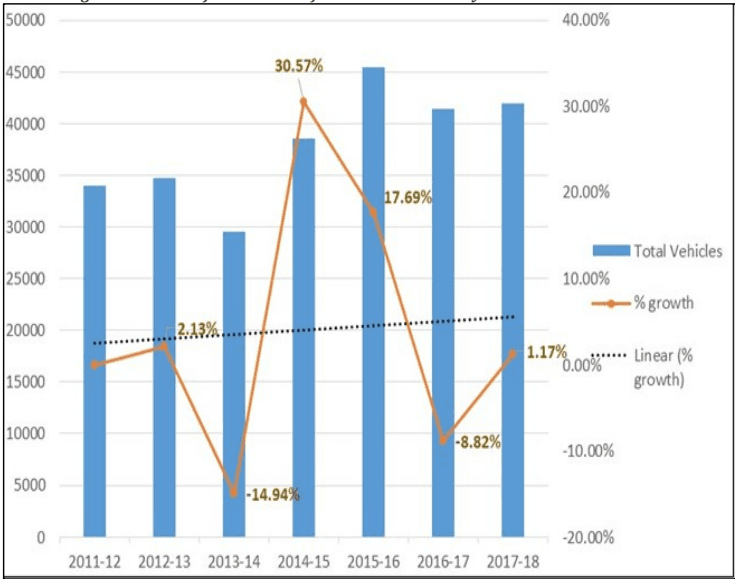
The details about the total no. of vehicles cars, motorcycles, 3-wheelers, etc. for the last 7 years is illustrated in the following table.
| Year / Vehicles 2011-12 2012-13 2013-14 2014-15 2015-16 2016-17 2017-18 | |||||||
| Motor Cycle | 15269 | 17395 | 16525 | 18455 | 24354 | 22535 | 22175 |
| Car | 13288 | 11808 | 8298 | 10799 | 10709 | 10345 | 10180 |
| Tourist/ Meter Taxi | 719 | 851 | 439 | 1006 | 1966 | 3155 | 1288 |
| Auto Rickshaw | 493 | 628 | 1663 | 3469 | 2445 | 1993 | 4695 |
| Buses | 237 | 184 | 157 | 308 | 378 | 274 | 202 |
| School Bus | 136 | 171 | 99 | 101 | 143 | 32 | 84 |
| Pvt. Service vehicle | 32 | 10 | 5 | 15 | 11 | 10 | 16 |
| Ambulance | 28 | 30 | 16 | 39 | 18 | 18 | 20 |
| Truck | 1067 | 901 | 725 | 1802 | 2609 | 1057 | 802 |
| Tanker | 220 | 249 | 155 | 241 | 267 | 283 | 403 |
| D/Van 4 wheelers | 643 | 512 | 213 | 322 | 284 | 197 | 655 |
| P/Van 3 wheelers | 1462 | 1565 | 1019 | 1648 | 1866 | 1129 | 788 |
| Trailers | 381 | 438 | 230 | 364 | 364 | 344 | 434 |
| Other Govt vehicle | 49 | 7 | 15 | 25 | 9 | 45 | 159 |
| Total | 34024 | 34749 | 29559 | 38594 | 45423 | 41417 | 41901 |
[Source: Dy. RTO, Navi Mumbai]
The growth chart is prepared from the above table depicting the increase/ decrease in the trend. It is shown in the below figure.
Figure 07: Trend of the number of vehicles in the last 7 years within NMMC area.
6.4 General conditions of roads:
Total constructed road length within corporation area is 559.635Kms. Out of which cement concrete roads are 76.821 kms. and Asphalted 482.814 kms.
| Node/ Ward Cement Asphalt Total in mtrs. | |||
| Belapur | 1600 | 114761 | 116361 |
| Nerul | 6120 | 85222 | 91342 |
| Turbhe | 26069 | 66724 | 92793 |
| Vashi | 3310 | 49954 | 53264 |
| Koparkhairane | 8265 | 77229 | 85494 |
| Ghansoli | 7877 | 37695 | 45572 |
| Airoli | 6258 | 38809 | 45067 |
| Dighe | 3522 | 7620 | 11142 |
| Thane/ Belapur Road | 13800 | 4800 | 18600 |
| Total | 76821 | 482814 | 559635 |
[Source: C.E. Dept., NMMC.]